
Abstract
This article investigates the effect of the guide vane outlet angle on the hydraulic performance and pressure fluctuation of the blood pump. In this study, an implantable two-stage axial-flow blood pump with guide vanes was used as the research model, and the guide vane outlet angle β4 was designed to be 20°, 15°, 10°, and 5°. The whole flow field in the pump under different guide vane outlet angles was unsteady and simulated by commercial code FLUENT. The simulation results were validated by experimental results, which use Xanthan gum solutions with concentration of 0.6 wt.‰ as working fluid. The results indicate that the pump head and efficiency of the pump are the best when the guide vane outlet angle is 10°. Then, the effects of guide vane outlet angle on the pressure fluctuation of blood pump were analyzed. In one rotation period, all the pulsations of the pressure fluctuation are periodic and there are one large peak and one small peak; the decrease in the guide vane outlet angle β4 makes the internal flow in the pump more uniform, which would lead to higher head and efficiency of the pump. But if the β4 is too small, the flow passage of the guide vane will become too narrow, thus the flow velocity in the guide vane is extremely high that causes the guide vane unable to convert kinetic energy into pressure energy well, which implies more hydraulic loss in the pump. According to the simulation, the minimum pressure pulsation amplitude appears at β4 = 10° and the corresponding value is 0.0016, the decrease of which reaches as much as 18.8% of maximum pulsation amplitude 0.00197.
Keywords
Introduction
Blood pump is a small pump that can completely or partially replaces heart function and maintains normal body blood circulation, and it plays an important role in the treatment of cardiovascular disease and can significantly improve survival rate of the patients who suffer from severe congestive heart failure. 1
There are two types of blood pumps such as centrifugal blood pump and axial-flow blood pump. Since 1980, the axial-flow blood pump has benefits such as compact size and easy control and gradually becomes the development direction of artificial heart. Axial-flow blood pump is composed of a motor stator with columnar pump shell and a propeller set, including flow straightener, guide vane, impeller, and magnetic rotor. Blood was always regarded as the Newtonian fluid in the development and design of the rotary blood pump. 2 Few reports focused on the fluid characteristics of the non-Newtonian fluid in the axial-flow blood pump. 3 The human blood composition differs from one donor to another, and its shear stress and shear rate change with time. Therefore, blood test results are difficult to be reproduced.
Guide vane can transfer the kinetic energy into pressure energy and make the flow field smooth. The effect of guide vanes on performance of the centrifugal pump has been researched carefully.4,5 However, the guide vane in blood pump gains less attention, especially whether the guide vane can further influence the pressure fluctuation of the blood pump.
With the rapid development of computer technology, numerical simulation has been used in flow field analysis and performance prediction in hydromechanical flow passage components. Majidi and Gonzalez6,7 analyzed the internal flow characteristics of centrifugal pump using standard k–ε model. Xu 8 analyzed the unsteady turbulent characteristics between impeller and guide vane using renormalization group (RNG) k–ε model to simulate the rotor–stator interaction. The pressure fluctuation of impeller was experimentally researched by Okamoto; 9 he found that the pressure fluctuation of the impeller is the main reason why there were many extra frequency components. Kruger 10 analyzed a vertical mixed pump by computational fluid dynamics (CFD), and he investigated the vortexes’ distribution near pump inlet and stated that radial force had a good agreement with experimental results. Sinha 11 and Cao 12 studied the centrifugal pump with guide vane, but their researches focused on the pattern of the inner flow and the improvement in the pump hydraulic performance.
This article aims at the effects of different guide vane outlet angles on the hydraulic performance and pressure fluctuation of the blood pump which were analyzed by both experimental and numerical methods. The non-Newtonian characteristics of the blood are also considered using Xanthan gum solutions as working fluid in the experiment.
Model test rig
In order to verify the simulation results, the experiment system of the research pump was established. The schematic arrangement of the test rig is shown in Figure 1. The motor is able to drive the pump to the designed rotation speed of 7000 r/min. Pressure meters are installed in the test loop to measure the inlet and outlet pressure, and its measurement error is 0.1%. Gate valve is connected near the inlet and outlet of the loop to adjust the flow rate of the pump. The flow meter is mounted behind the pressure meter near the gate valve to measure the volumetric flow rate of the pump, and the uncertainty of the flow meter is 0.1%; the hygronom and circulating water pump are installed to keep the fluid in test loop with a proper temperature. Besides the control pulse was outputted to the windings of the electromagnet by the shared circuits model (SCM) controlled circuit, the alternating magnetic field was obtained. Thus, the permanent magnet rotor which had a certain coupling distance to the electromagnet can be forced to rotate by the alternating magnetic field.

The sketch of test rig.
Xanthan gum solution is a non-Newtonian fluid which displays remarkable shear thinning behavior and can be used as a blood analog fluid. The experimental results show that at 37°C, Xanthan gum solutions with concentration of 0.6 wt.‰ will match human blood best in terms of rheological properties.13–15
The rotary speed was set to 6000, 6500, and 7000 r/min. Outlet pressure was adjusted to 3.2, 6.1, and 11 kPa. The flow meter was used to test the outlet of the blood pump for eight times. After averaging the values, the test flow rate was compared with the theoretical values as shown in Tables 1 and 2.
Experiment data with different rotary speed (5 L/min).

Experiment data with different rotary speed (10 L/min).

It can be seen from Table 1 that when the flow rate is set to 5 L/min, the deviations in the experimental and theoretical values gradually decrease with the increased rotary speed. When the rotary speed reaches to 7000 r/min, the errors of the dates are all less than 5%, and thus, the precision of the test is considered in the allowed range. While the flow rate is set to 10 L/min as shown in Table 2, the deviations are all more than 5%, and the deviations are considered beyond the allowed range.
Numerical methods
Research model
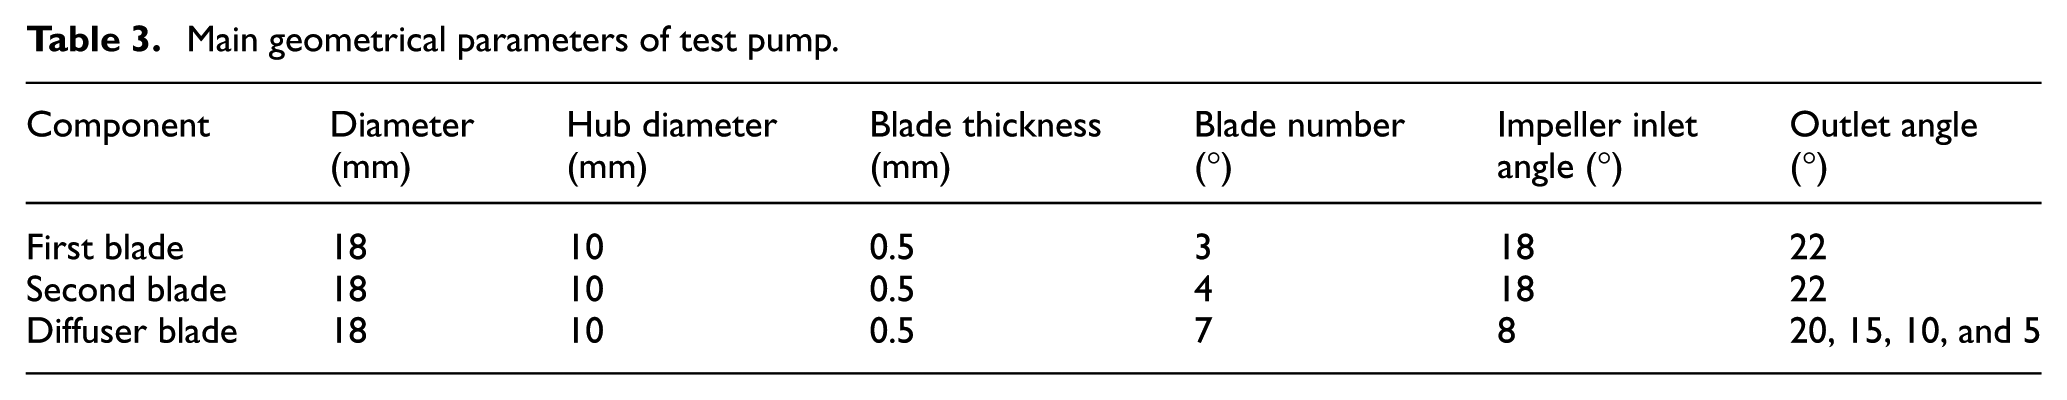
The research model is a blood pump with guide vanes. The parameters of the research model are shown in Table 3.
Main geometrical parameters of test pump.
As shown in Figure 2, the outlet angle of the guide vane was designed to be 20°, 15°, 10°, and 5°.
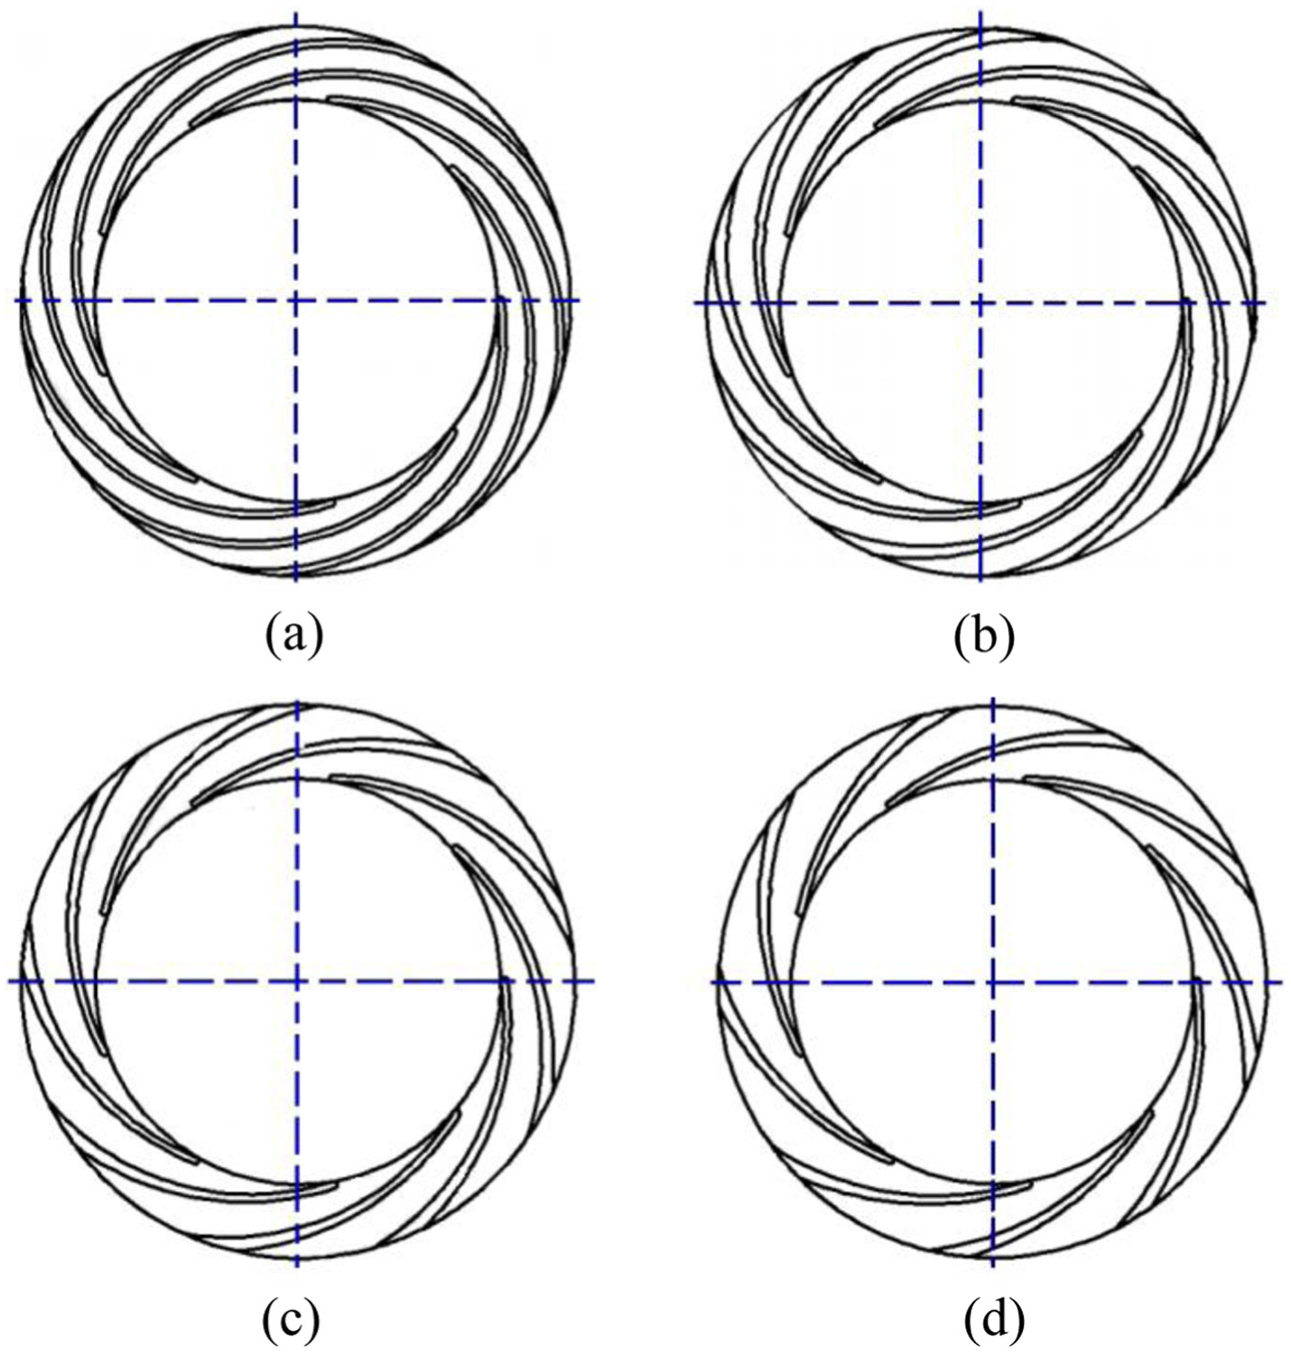
Research scheme: (a) β4 = 5°, (b) β4 = 10°, (c) β4 = 15°, and (d) β4 = 20°.
The hydraulic passage of the blood pump including rotor head, rotor stern, first-stage impeller, second-stage impeller, and rotor-guide impeller is shown in Figure 3.

Calculation domains.
The lengths of outlet pipe and inlet pipe are extended to three times the pipe diameter to increase the simulation accurately. 16
Grid generation
The grid is generated using the geometry preprocessor of the ICEM program. As the trailing edges of blades and diffuser are all quite thin, the size of grids cannot be uniform. To form dense grids near the blades and diffuser trailing edge, densification technique is utilized in some local blades and diffuser portion. Figure 4 displays the mesh, which consists of a hybrid grid with prismatic and Hex-core cells (see Figure 4).

Cross section of mesh.
Boundary conditions
Blood is a non-Newtonian fluid which displays remarkable shear thinning behavior; 17 when the shear rate is more than 100 s−1, the human blood apparent viscosity becomes a constant value of about 3.4–4.0 mPa·s, which means blood can be treated as Newtonian fluid;18,19 in the simulation, viscosity, and density are μ = 3.6 mPa·s and ρ = 1055 kg/m3, respectively.
Inlet and outlet boundary conditions: considering the velocity of inlet, “outflow” is implemented on pump outlet and the flow rate is set to be 1.
Wall boundary condition: no slip condition is enforced on wall surface, and enhanced wall function is applied to the adjacent region; the near wall y+ value should be less than 5. As shown in Figure 5, most of the y+ values are about 1, and the maximum is 3.5. Obviously, all the y+ values of the model surfaces met the requirement. This study utilized the ANSYS FLUENT 17 commercial code to solve the RNG k–ε equations for the unsteady flow in the computational domain. The SIMPLEC algorithm and second-order implicit transient formulation are selected to solve pressure–velocity coupling for steady and unsteady simulations, respectively. In addition, interfaces between impeller and other parts are set to be “sliding mesh model (SMM),” while other interfaces remain to be “general connection.” Time-step for unsteady simulations is considered as 1.1261e−3 s, which means the impeller rotates for 1 degree during 5 time-steps. Convergence precision of residuals is 10−4.

Y plus near first layer gird.
Validation of grid independence
In order to check the influence of the grids on the results, five different types of girds are validated, and the results are shown in Table 4 and Figure 6. It indicates that the pump head curve tends to rise along with the increased grids and tends to become smooth. Given the time cost for the calculation considered, gird 4 is selected for calculation in the end. The mesh in the whole computational zone has 3,140,000 grids.
Grid independence analysis (×106).


Grid independence analysis.
Prediction algorithm
Pump head is an important parameter of blood pump. In medicine, the differential pressure is used to indicate the head and its unit is mmHg; 100 mmHg is equal to 1.38 m head. Normal human height is 1.5–2.0 m, while human heart is about three-quarter of the body, which means that 1.5-m water column can basically meet one body’s physiological pressure requirements.
The differential head of blood pump can be defined as follows

where m and n denote the node number of section at the entrance and exit of computation domain, respectively; p denotes pressure; C denotes absolute velocity;
The efficiency of heart pump can be calculated using the following formula

where Q denotes the flow rate,
In unsteady analysis, to obtain the change law of the guide vane impeller pressure fluctuation with time, we sampled the pressure fluctuation of guide vane impeller and impeller hub. The pressure fluctuation coefficient Cp is calculated by the following formula20,21

In this expression, p is the total pressure at monitor points, p0 is the reference pressure, ρ is the density of liquid, and v is the circular velocity of the outer blade.
Selection of turbulence model
Turbulence model selection is a very important part for numerical simulation because inappropriate turbulence model always leads to high calculation error. Figure 7 shows the curves of numerical and experimental results, and the standard k–ε, RNG k–ε and k–ω, and shear-stress transport (SST) k–ω turbulence models have been used to simulate the inner flow of the pump with β4 = 10°. Figure 7 shows that numerical performance curves are in good agreement with experimental results. For the range of flow rate, Q = 0.85–3.36 m3/h and the relative errors of head and efficiency are less than 5%. RNG k–ε turbulence model is closest to the experiment data. So, the RNG k–ε turbulence model is adopted to perform the simulations in this article. The comparison between numerical and experimental results also proves that the CFD method could predict the pump performance with acceptable accuracy.

Comparison of numerical and experimental results.
Results and discussion
Influence of guide vane outlet angle on the pump performance
Figure 8 shows the pump performance with guide vane angle β4, which changes when the flow rate is 3 m3/h. With the decrease in the value of β4, the values of the head and efficiency of the pump increase at first, and the maximum values of head and efficiency appear on β4 = 10°; when β4 is smaller than 10°, the values of head and efficiency decrease dramatically. Figure 9 shows the pump efficiency with change in the guide vane angle under different flow rates. It can be clearly seen that with the increase in the flow rate, the efficiency of the pump increases at first and then decreases, and the pump gets the highest efficiency when the flow rate is 3 m3/h.

Pump performance with guide vane angle changes under Q = 3 m3/h.

Pump efficiency with guide vane angle changes under different flow rate.
Analysis of flow field in the pump
The reasons for the changes in pump performances under different guide vane angles of β4 are indicated in Figure 10. In Figure 10, with the increase in β4, the overall uniformity of the flow gradually gets worse. There are many vortexes in the guide vane when β4 = 20° and 15°, but all vortexes disappear when β4 is smaller than 15° because the length of the flow passage in the guide vane becomes bigger and its width gets smaller with the decrease in β4, which regulates the flow pattern in the guide vane more strictly. So that the flow in the guide vane becomes smoother and the vortex vanishes.

Velocity contours and streamlines (m/s): (a) β4 = 5°, (b) β4 = 10°, (c) β4 = 15°, and (d) β4 = 20°.
It can also be seen from Figure 10 that with the decrease in β4, the overall absolute velocity in the pump increases. For the distribution of velocity in the guide vane, the high-speed zone becomes larger with the decrease in β4. When β4 is smaller than 10°, high-speed area has basically occupied the entire flow passage. When β4 is equal to 20°, the magnitude of the velocity is mainly in the range of 3–4 m/s, but when the β4 is equal to 5°, the magnitude of the velocity increases in the range of 3.5–6 m/s. The above analysis can be verified by Figure 8; the head and efficiency of the pump decrease dramatically when the β4 is smaller than 10°.
As shown in Figure 11, the recirculation at β4 = 5° spreads over the one-third height of suction side of guide vane and expands gradually when β4 is increased, and it disappears when β4 = 10°. When the β4 is 15° and 20°, the recirculation takes over almost the whole guide vane, which leads to more loss in kinetic energy. The expanded recirculation causes bad pump performance, and the guide vane cannot convert the kinetic energy into pressure energy efficiently, and it just explains why the best guide vane angle β4 is equal to 10°.

Streamline distribution chart in suction side of guide vane: (a) β4 = 5°, (b) β4 = 10°, (c) β4 = 15°, and (d) β4 = 20°.
In conclusion, the decrease in the guide vane outlet angle β4 makes the internal flow in the pump more uniform, which would lead to higher head and efficiency of the pump. But if the β4 is too small, the flow passage of the guide vane will become too narrow, thus the flow velocity in the guide vane is extremely high, which makes the guide vane unable to convert kinetic energy into pressure energy well, implying more hydraulic loss in the pump.
Hydrodynamic pressure fluctuation in time domain
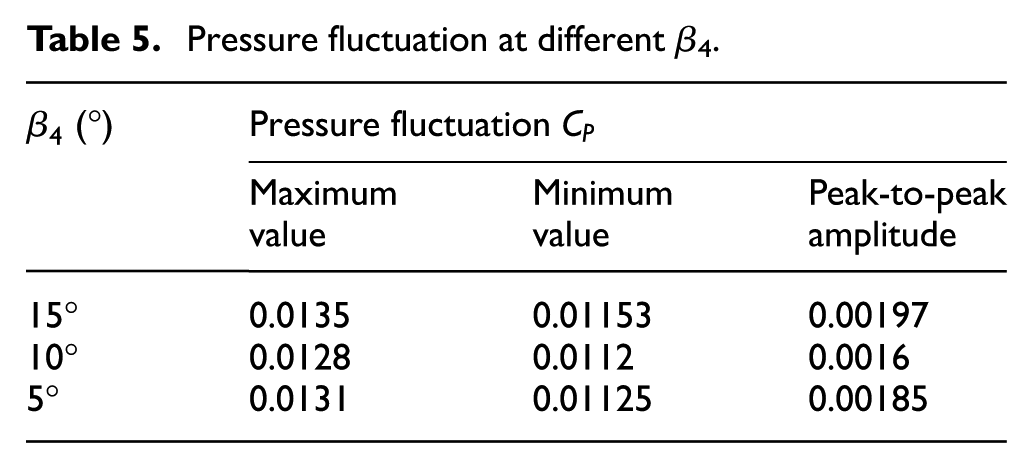
Pressure fluctuation in an axial-flow blood pump is a major factor affecting the operation stability. Based on the numerical simulations, the pressure fluctuation vector’s modulus at every time-step in the last rotation cycle is calculated. Figure 12 presents the time domain curves of pressure fluctuation under different β4, and in one rotation period, all the pulsations of the pressure fluctuation are periodic and there are one large peak and one small peak. With the decrease in β4, the two peaks in each pulsation are more similar, and this may be due to the improvement in flow uniformity in the pump. Table 5 shows the maximum, minimum, and peak-to-peak amplitude of pressure fluctuation under different β4. When β4 falls from 15° to 5°, the peak-to-peak amplitude of pressure fluctuation decreases from 0.00197 to 0.0016 and the decline reaches as much as 18.8%.
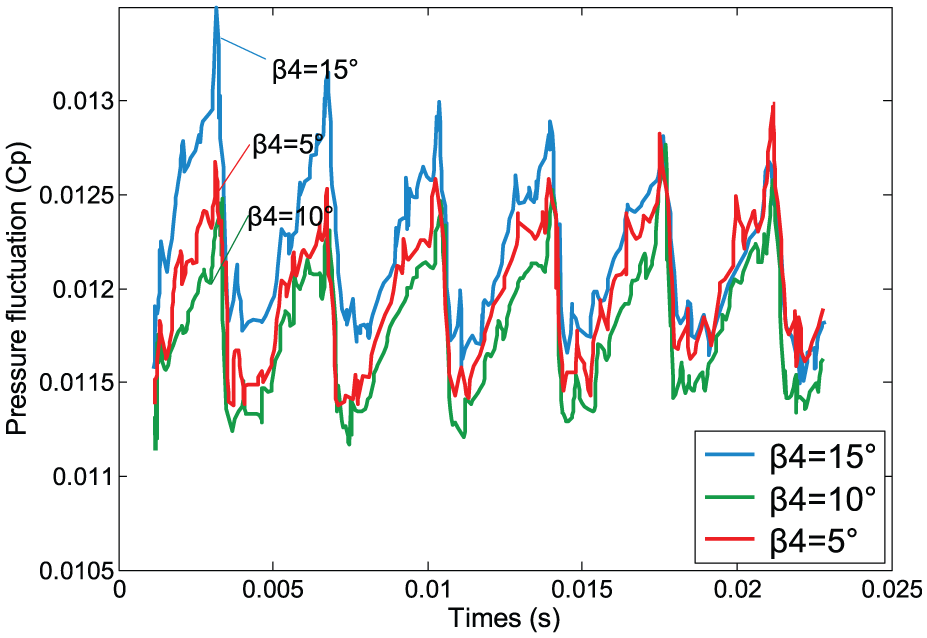
Hydrodynamic pressure fluctuation curve at different β4.
Pressure fluctuation at different β4.
Velocity distribution analysis with different outlet guide vane angles
To further analyze the influences of the guide vane outlet angle β4 on pump outlet velocity. The cross section to outlet are set to 0 mm, 15 mm, 18 mm, 20 mm when β4 are equal to 5°, 10°, 15°, 20°, respectively, as show in Figure 13(a)–(d), the guide vane outlet angle have deep influence on the outlet flow field of the blood pump. The velocity of outlet changes obviously; when β4 is equal to 10°, the distance to outlet is 0, 15, 18, and 21 mm and obtain greater velocity than other angles. The maximum velocity is 4.5 m/s.

Radial velocity distribution of cross section at different β4: (a) β4 = 5°, (b) β4 = 10°, (c) β4 = 15°, and (d) β4 = 20°.
Conclusion
In this article, a two-stage axial-flow blood pump is used as the object of the study. The computational and experimental analyses of the results could be summarized as follows:
A small outlet angle of the guide vane β4 can enhance the uniformity of flow inside the pump, which can improve the pump head and efficiency. While β4 is too small, the guide vane cannot convert the kinetic energy into pressure energy efficiently. When the outlet angle is 10°, the head and efficiency of the pump are the best.
There are many vortexes in the guide vane when the outlet guide vane angle β4 is bigger than 10°, but with the decrease in β4, the length of the flow passage in the guide vane becomes bigger and its width gets smaller, which regulates the flow pattern in the guide vane more strictly. So that, the flow in the guide vane becomes smoother and the vortex vanishes.
The minimum pressure pulsation amplitude appears at β4 = 10° and the corresponding value is 0.0016, the decrease of which reaches as much as 18.8% of maximum pulsation amplitude 0.00197.
Footnotes
Appendix 1
Academic Editor: Hyung Hee Cho
Declaration of conflicting interests
The author(s) declared no potential conflicts of interest with respect to the research, authorship, and/or publication of this article.
Funding
The author(s) disclosed receipt of the following financial support for the research, authorship, and/or publication of this article: This research was supported by the National Natural Science Foundation of China (Grant No. 51574161).