
Abstract
In this article, an optimization technique using the Taguchi method with multiple performance characteristics for the percent zinc coating balances edge joints of galvanized steel sheets for metal inert gas pulse brazing process was proposed. The orthogonal array, multi-response signal-to-noise ratio, and analysis of variance were employed to study the performance characteristics. Five metal inert gas pulse brazing process parameters, namely, wire feed speed, arc voltages, travel speed, peak currents, and pulse frequency, were optimized with considerations of multiple performance characteristics including percent zinc coating balances edge joints. Experimental results were provided to confirm the effectiveness of this approach. The optimum metal inert gas pulse brazing technique conditions were wire feed speed of 3.25 m/min, arc voltages of 18 V, travel speed of 0.8 m/min, peak currents of 425 A, and pulse frequency of 35 Hz. Confirmation tests of the optimal levels with the initial cutting parameters are carried out in order to illustrate the effectiveness of this method in metal inert gas pulse brazing technique for galvanized steel sheets.
Keywords
Introduction
Galvanized steel sheets were used as materials for producing work pieces in many important industries such as automotive industry, shipbuilding industry, constructions, or medical equipment. All of them used galvanized steel sheets in completion more and more. In addition, brazing of joint process by welding and brazing is being used for these assembly products. 1 Metal inert gas pulse brazing process (MIGPBP) is a high technology of welding which is applied with metal inert gas pulse welding or MIGPW. 2 Pulse system is used to design the welding current. It uses only the surface of the material at the interface for metal droplets from burned filler metals to braze of joint. As a result, the material does not melt. This makes joints to have less surface damage and can be connected to various types of metals. Brazing speed up to 3–4 times more welding speed than conventional welding processes and coordination processes can also control the variables of brazing accuracy. Therefore, MIGPBP3,4 is used in industrial brazing galvanized sheets more and more. However, the actual use of MIGPBP in industry has relative problems with joint burn and volume loss of zinc-coated loss, which was affected by the variables taken into improper MIGPBP. Moreover, the optimization of industrial processes, the MIGPBP, also relies on the experience and expertise of practitioners. Determining the adverse conditions can cause defects in the joints and the quality of work, and reduce the shorter lifespan.
The Taguchi method is universally applied to all engineering fields.5–7 This method uses a loss function to calculate the deviation between the experimental value and the desired value. This loss function is further transformed into signal-to-noise (S/N) ratio. There are three categories of multiple performance characteristics (MPC) depending on the type of characteristics: lower is better, higher is better, and nominal is the best. However, the published Taguchi applications to date concerned with the optimization of single and MPC. Some researchers8–15 used the MPC to select the optimum levels of process parameters in welding and turning. For example, Sriprateep 8 employed the MPC to solve the optimization for turning metal matrix composites. Acherjee et al. 9 applied the MPC and grey-based Taguchi method for the laser transmission welding process of thermoplastics. Sathiya et al. 10 studied the MPC of the laser butt welding parameters in the laser welding process. Jung and Kwon 11 employed the MPC and grey-based Taguchi method to solve the optimization of electrical discharge machining (EDM) process. Tosun and Pihtili 12 applied the MPC and grey-based Taguchi method of in minimum quantity lubrication (MQL) milling process of 7075 Al alloy. Tzeng et al. 13 and Nian et al. 14 adopted the MPC and grey-based Taguchi method to the optimization condition in turning processes. Also, Pan et al. 15 adopted this method for optimization of the quality characteristic parameters in Nd:YAG laser welding process.
This article is an extension of an earlier one in which Songsorn et al. 1 put forward an optimization technique with grey–Taguchi method to optimize the percent zinc coating balances edge joints (PZBEJ) for galvanized steel sheets using MIGPBP. In this work, the optimization technique using the Taguchi method with MPC for the PZBEJ of galvanized steel sheets was proposed. Taguchi’s design experiment method was used to find out the influence parameters to response characteristics. Experimental results are provided to confirm the effectiveness of this approach.
Experiment details
This section describes the experimental set-up and the method for the measurement of PZBEJ. Also, plans for experiments, the MPC, were explained.
Experimental set-up
MIGPBP
A galvanized steel sheet was deposited by the MIGPBP of Fronius-Tranpulse 450 Inverter as a power source.
Base material
The specimen materials were 0.8-mm galvanized steel sheets with a 7.02-µm-thick galvanized coat as shown in Table 1.
Chemical compositions (wt%) of the base metal. 1

Filler metal (electrode solid wire)
The filler metal was solid wire AWS; ER.CuSi-3 (∅ 0.8 mm) as shown in Table 2.
Chemical composition (wt%) of the filler metal. 1

Shielding gas
Commercial argon (99.98%) was used as the shielding gas in all experiments. The flow rate of the shielding gas is 10 L/min.
Specimens
There were two specimens. Each had a 100 mm × 150 mm dimensional surface. The specimens in this study must be cleaned by Acetone before the MIGPBP. In preparing specimens for the MIGPBP, both specimens were put in forms of a lap joint for a length of 10 mm and joint fit-up for 0.50 mm as shown in Figure 1.

Schematic diagram of preparing joint of specimens for metal inert gas pulse brazing process. 1
Measuring PZBEJ
The specimens were prepared and cut to the size of 20 mm × 30 mm. Cleaning specimens was accomplished using Acetone. PZBEJ was measured as shown in Figure 2. After the MIGPBP, the specimens were taken and PZBEJ was measured to see the effect on the upper edge joint (PZBEJ1), the lower edge joint (PZBEJ2), and the back sides of edge joints (PZBEJ3). In doing so, the scanning electron microscope was used to check the quantity of PZBEJ using the energy dispersive spectroscopy mode, which was used to test the PZBEJ1, PZBEJ2, and PZBEJ3, as shown in Figure 2.

Schematic determination of PZBEJ. (a) Graphics drawing of PZBEJ1 (F-A) presents an upper edge joint, PZBEJ2 (A-F) is a lower edge joint, and PZBEJ3 (A-F) is a backside joint. (b, c) PZBEJ1 shows an upper edge joint, PZBEJ2 is a lower edge joint, and PZBEJ3 is a backside joint. 1
Figure 2 presents the checking points of the PZBEJ at the upper edge joints and lower edge joints front sides (PZBEJ1 and PZBEJ2). All checking points were placed 1.00 mm apart from one another (see PZBEJ1 (F-A) and PZBEJ2 (A-F). Hence, there were six checking points per each zone ranging from 1–6 mm to measure the average percentage of the zone PZBEJ1 and PZBEJ2. The same was true for measuring the PZBEJ’s backside of the joint at zone PZBEJ3, directly resulting from the MIGPBP. All checking points at the backside of the joint were placed apart from one another by 1.00 mm, including six checking points, to be checked for average percentage of PZBEJ3. Finally, all parameters were calculated once again to find the average percentage of the PZBEJ.
Plan of experiments
This study investigated the appropriate parameters in MIGPBP using MPC to analyze the level of the appropriate parameters that affect the highest PZBEJ value. The parameters, namely, wire feed speed, arc voltage, travel speed, peak current, and pulse frequency, were optimized with their levels as shown in Table 3.
Metal inert gas pulse brazing process parameters and their levels. 1

MIGPBP: metal inert gas pulse brazing process.
The Taguchi method was applied in this work. The experiment was performed on the combinations of level of factors defined by orthogonal array. It performed the combination of levels of parameters defined by L25 orthogonal array. The experimental design is shown in Table 4.
Experimental design using an L25 OA of Taguchi. 1

OA: orthogonal array; MIGPBP: metal inert gas pulse brazing process.
Analysis of the MPC methods
The Taguchi method uses S/N ratio instead of the average value to interpret the trial results’ data into a value for the characteristic evaluation in the optimum setting analysis. Taguchi used a loss function to calculate the deviation between the experimental value and the desired value. This loss function is further transformed into S/N ratio. There are several S/N ratios available depending on the type of characteristics. The higher-the-better for PZBEJ can be expressed as

where Lij is the loss function of the ith performance characteristic in the jth experiment, n stands for the number of tests, and yijk is the experimental value of the ith performance characteristic in the jth experiment at the kth test. In a process with MPC, it cannot be straightforward. The loss function corresponds to every performance characteristics and is normalized first to solve the normalized loss function

where Sij is the normalized loss function for the ith performance characteristic in the jth experiment, Lij the loss function for the ith performance characteristic in the jth experiment, and

where

Results and discussion
Analysis of the multi-response S/N ratio
MPC was used to analyze the five main parameters; each of these parameters consisted of five levels to investigate the most appropriate parameters within MIGPBP. Experimenting in an attempt to find the PZBEJ in the PZBEJ1 zone, PZBEJ2 zone, and PZBEJ3 zone gave results, which were taken to determine the three multi-response S/N ration, derived from equation (4) as shown in Table 3. The experimental results were calculated for multi-response S/N ratio using equations (1)–(4). In equation (3), the correlation (

OA: orthogonal array; PZBEJ: percent zinc coating balances edge joints; S/N: signal-to-noise.
Average of three replications.
TM with MPC
MPC were used to analyze the combination of the different levels of each parameter that best suited MIGPBP. The respond parameters are PZBEJ. The results from the study were transferred using S/N ratio (higher-the-better). The respond parameters of PZBEJ are the aims of the experiment to find out the best optimize value. Then, combine S/N ratio of the respond with weighting factor,
In case 1, the graph in Figure 3 presents the relationship between multi-response S/N ratio mean of different levels of parameters within each experiments and multi-response S/N ratio mean of different levels. The most multi-response S/N ratio mean of each parameter was selected as the most appropriate conditions. From Figure 3, when considering wire feed speed at level 2, it provided the most multi-response S/N ratio. So, it was selected. In terms of arc voltage parameter, multi-response S/N ratio mean was level 4, and it provided the most multi-response S/N ratio. Travel speed was level 4, peak current was level 4, and pulse frequency was level 2 (w2, v4, s4, p4, f2). Hence, the complements of the best conditions within MIGPBP for case 1 were wire feed speed of 3.25 m/min, arc voltage of 18 V, travel speed of 0.9 m/min, peak current of 400 A, and pulse frequency of 30 Hz.

Multi-response S/N ratio graph for ω1 = 0.5, ω2 = 0.2, and ω3 = 0.3 (case 1).
To find out the best condition for the experiment in case 2 as shown in Figure 4, the most multi-response S/N ratio mean in each level was used as the appropriate condition for MIGPBP in case 2. When considering wire feed speed level2, it provided the most multi-response S/N ratio. In terms of arc voltage was level 4, travel speed was level 3, peak current was level 4, and pulse frequency was level 3 (w2, v4, s3, p4, f3). Hence, the complements of the best conditions within MIGPBP for case 2 were wire feed speed of 3.25 m/min, arc voltage of 18 V, travel speed of 0.8 m/min, peak current of 425 A, and pulse frequency of 35 Hz.

Multi-response S/N ratio graph for ω1 = 0.3, ω2 = 0.5, and ω3 = 0.2 (case 2).
In case 3, the most multi-response S/N ratio mean in each level was used as the appropriate condition. For this experiment, wire feed speed was level 2, arc voltage was level 2, travel speed was level 4, peak current was level 4, and pulse frequency was level 3 (w2, v2, s4, p4, f3). Therefore, the complements of the best conditions within MIGPBP for case 3 were as follows: wire feed speed was 3.25 m/min, arc voltage was 16 V, travel speed was 0.9 m/min, peak current was 425 A, and pulse frequency was 35 Hz. These are the most appropriate condition for the MIGPBP in case 3, as shown in Figure 5.
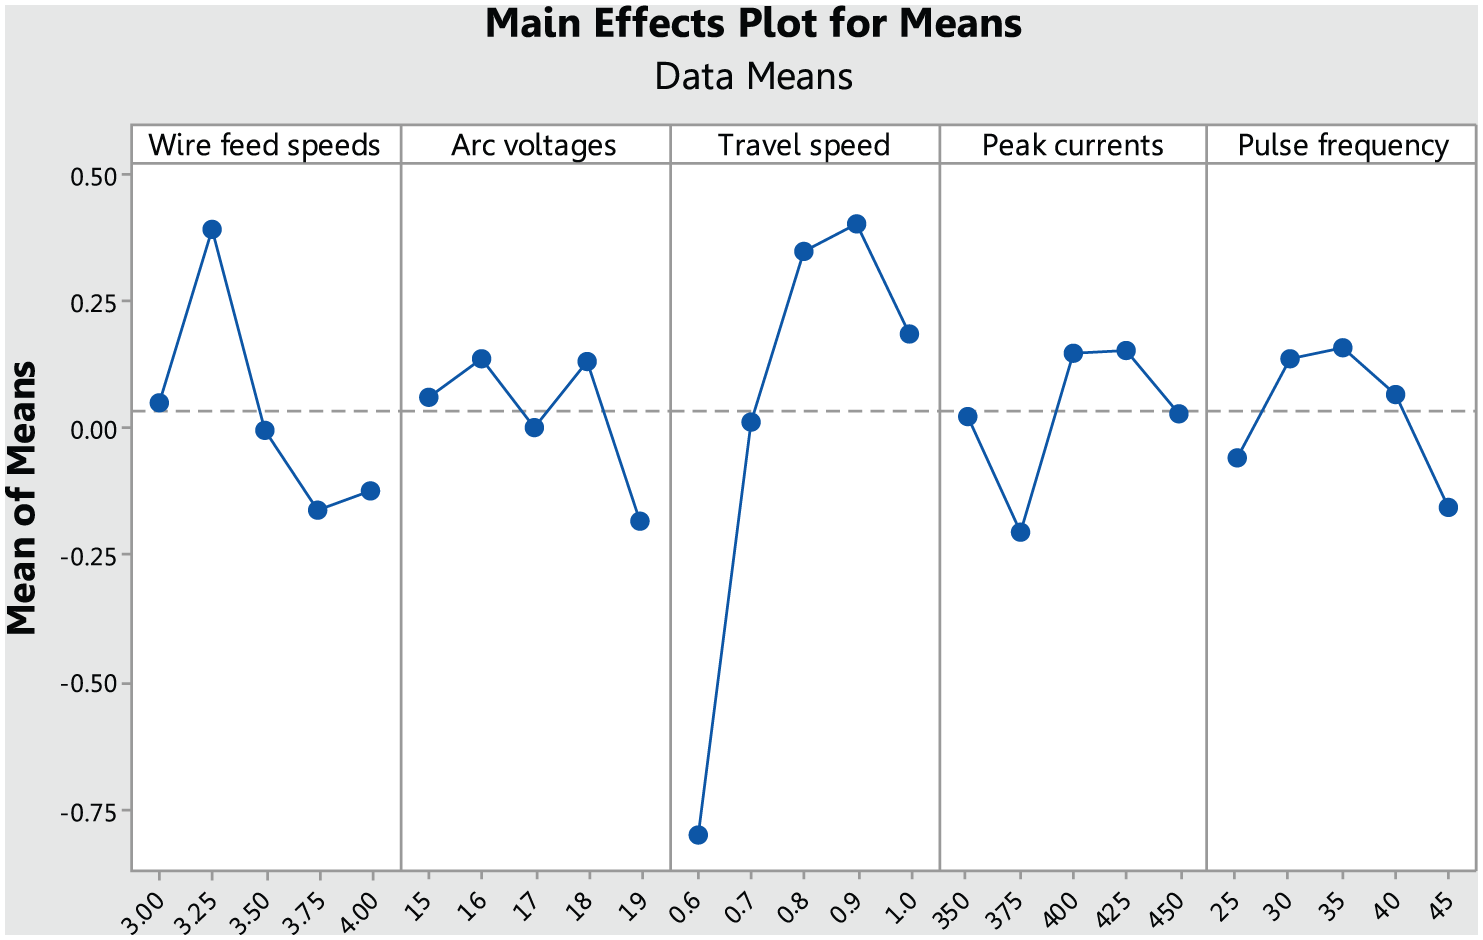
Multi-response S/N ratio graph for ω1 = 0.2, ω2 = 0.3, and ω3 = 0.5 (case 3).
The selection of the conditions of the parameter level which best suited in cases 1, 2, and 3 was analyzed to confirm the experiment by combining the level of each parameter. Each parameter was tested for three times, and the results obtained from the experiments were analyzed using MPC to find out the best multi-response S/N ratio value.
Analysis of variance
Analysis of variance (ANOVA) was used to investigate all five parameters in the MIGPBP that significantly affect MPC. Tables 6–8 show the results of the variance for the multi-response S/N ratio using basic statistical values at the significant level F0.05. ANOVA measured the spread out of the data using F-test and percent contribution. In case 1 (Table 6), it was found that travel speed has the highest value when compared to other parameters. It indicated that travel speed has the greatest influence upon the multi-response S/N ratio. The arc voltage has the least influence upon multi-response S/N ratio within MIGPBP. Table 7 presents the ANOVA for the multi-response S/N ratio in case 2. Considering F-test and percent contribution, the travel speed has the most effect. However, arc voltage has the least effect on multi-response S/N ratio. This indicates that arc voltage has the least influence on multi-response S/N ratio within MIGPBP. The travel speed and wire feed speed have the similar value on multi-response S/N ratio. The result of multi-response S/N ratio analysis in case 3 as shown in Table 8 was found that travel speed has great influence upon multi-response S/N ratio. Next parameters such as pulse frequency and arc voltages have the least influence upon the multi-response S/N ratio.
Result of the analysis of variance for

DF: degree of freedom; SS: sum of square; MS: mean square.
Percentage of contribution.
Result of the analysis of variance for

DF: degree of freedom; SS: sum of square; MS: mean square.
Percentage of contribution.
Result of the analysis of variance for

DF: degree of freedom; SS: sum of square; MS: mean square.
Percentage of contribution.
The percent contribution of the MIGPBP parameters is shown in Tables 6–8. The results show that travel speed is a major factor affecting the performance (56.22%– 68.77%); the percent contribution of wire feed speed (13.74%–17.18%), the percent contribution of pulse frequency (5.14%–9.53%), the percent contribution of peak current (6.04%–8.21%), and the percent contribution of arc voltages (4.91%–7.17%) are much lower, respectively.
Confirmation experiments
To predict and verify the improvement in the performance characteristics for the MIGPBP of PZBEJ (PZBEJ1, PZBEJ2, and PZBEJ3) with respect to the chosen initial parameter setting, verification tests were used. The optimal level of designed parameters has been selected based on the optimal conditions presented. The estimated S/N ratio

where
Tables 9–11 present the conditions within MIGPBP analyzed by MPC and also show the results of the confirmation experiment using the optimal MIGPBP parameters of cases 1–3. The increase in the multi-response S/N ratio from the initial MIGPBP parameters to the optimal MIGPBP parameter for cases 1–3 was 1.115, 1.211, and 0.727 dB, respectively. It provides the most multi-response S/N ratio as shown in Table 10 (case 2). When compared with the initial condition, it derived to 1.211 dB and had better response to the three PZBEJ zones. The PZBEJ1 rise up from 59.97% to 71.45%, PZBEJ2 from 68.32% to 72.12%, and the PZBEJ3 increased from 89.58% to 90.10%. Table 12 illustrates the specimens of the MIGPBP and explains the response of PZBEJ1, PZBEJ2, and PZBEJ3 resulting from the optimal parameters. The initial parameters, 1 the optimal parameters at the PZBEJ zones, derived from the MPC are shown in Table 12.
Results of the confirmation experiment for

MIGPBP: metal inert gas pulse brazing process; PZBEJ: percent zinc coating balances edge joints; S/N: signal-to-noise.
Results of the confirmation experiment for

MIGPBP: metal inert gas pulse brazing process; PZBEJ: percent zinc coating balances edge joints; S/N: signal-to-noise.
Results of the confirmation experiment for
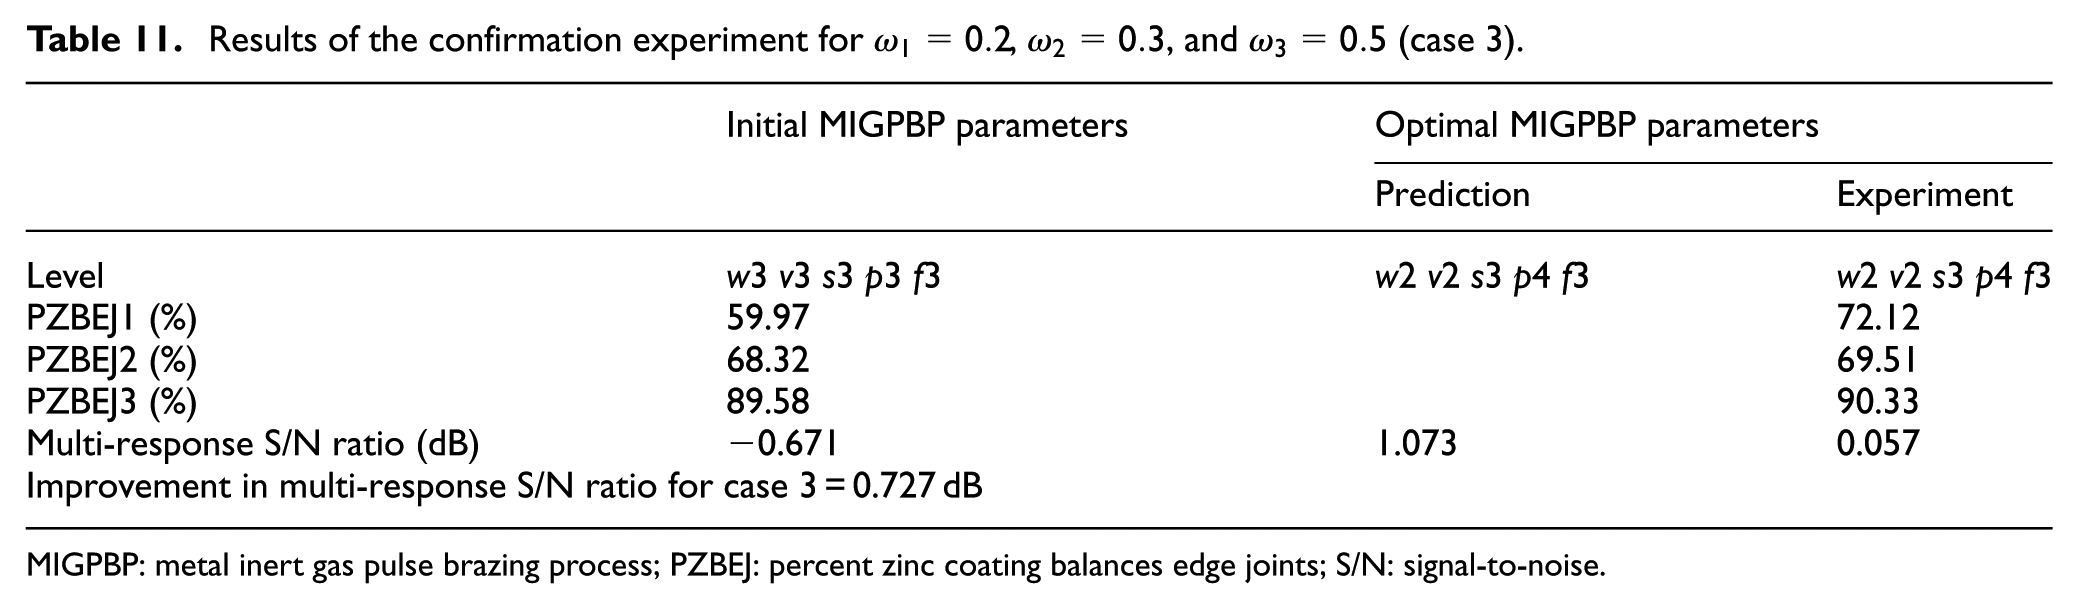
MIGPBP: metal inert gas pulse brazing process; PZBEJ: percent zinc coating balances edge joints; S/N: signal-to-noise.
Specimens of the MIGPBP explain the response of PZBEJ1, PZBEJ2, and PZBEJ3 resulted from the optimal parameters. 1

MIGPBP: metal inert gas pulse brazing process; PZBEJ: percent zinc coating balances edge joints; MPC: multiple performance characteristics.
Discussion
The results from the analysis contributed to the different values of multi-response S/N ratio. It provided the most multi-response S/N ratio as shown in Table 10 (case 2). The increase in the multi-response S/N ratio from the initial MIGPBP parameters to the optimal MIGPBP parameter was 1.211 dB and had better response to the three PZBEJ zones. The PZBEJ1 raised up from 59.97% to 71.45%, PZBEJ2 from 68.32% to 72.12%, and the PZBEJ3 increased from 89.58% to 90.10%. Optimum MIGPBP parameter performance was obtained with settings of wire feed speed of 3.25 m/min, arc voltages of 18 V, travel speed of 0.8 m/min, peak currents of 425 A, and pulse frequency of 35 Hz (w2, v4, s3, p4, f3). However, the three main factors (PZBEJ1, PZBEJ2, and PZBEJ3) and the value of MIGPBP parameters would affect the quality of joint. If the travel speed and wire feed speed were slow, peak currents, pulse frequency, and arc voltages that have high value would affect the higher percentage of PZBEJ. Hence, in the real-life practice, MIGPBP parameters are the most important toward the quality of joint.
In the previous research, 1 the most appropriate parameter for PZBEJ1, PZBEJ2, and PZBEJ3. MIGPBP with Taguchi method (TM) and grey relational analysis (GRA) were wire feed speed level 2, arc voltages level 2, travel speed level 4, peak currents level 4, and pulse frequency level 3. The results from parameter analysis of PZBEJ1, PZBEJ2, and PZBEJ3 of MIGPBP with MPC compared to TM and GRA indicated that arc voltages were the factors that have the least effect on PZBEJ. This means the arc voltage level of 16–18 V could be applied to MIGPBP for galvanized steel sheets at all levels. Travel speed has the most parameters on PZBEJ and wire feed speed, peak currents, and pulse frequency, respectively.
Conclusion
This study presents the effects of MIGPBP parameters (wire feed speed, arc voltages, travel speed, peak currents, and pulse frequency) on the MPC of PZBEJ1, PZBEJ2, and PZBEJ3 to perform the MIGPBP operation. The optimal MIGPBP conditions depend on different combinations of weighting parameters that were determined for three cases. The MIGPBP performance of case 2 showed the most improvement in the multi-response S/N ratio. The increase in the multi-response S/N ratio from the initial MIGPBP parameters to the optimal MIGPBP parameter was 1.211 dB. The optimum MIGPBP performance was obtained with settings of wire feed speed of 3.25 m/min, arc voltages of 18 V, travel speed of 0.8 m/min, peak currents of 425 A, and pulse frequency of 35 Hz. The most important influence of the MIGPBP parameters with MPC on brazing is the travel speed (56.22%–68.77%). The PZBEJ1 raised up from 59.97% to 71.45%, PZBEJ2 from 68.32% to 72.12%, and the PZBEJ3 increased from 89.58% to 90.10%. Therefore, a useful technical tool for the quality optimization with considerations of MPC was proposed and verified in this study.
Footnotes
Appendix 1
Academic Editor: Xichun Luo
Declaration of conflicting interests
The author(s) declared no potential conflicts of interest with respect to the research, authorship, and/or publication of this article.
Funding
The author(s) received no financial support for the research, authorship, and/or publication of this article.