
Abstract
The objective of this work was to optimize the percent zinc coating balances edge joints of galvanized steel sheets using the metal inert gas pulse brazing process. The Taguchi method and grey relational analysis were used to determine the relationship between the metal inert gas pulse brazing process parameters and percent zinc coating balances edge joints. The metal inert gas pulse brazing process parameters used in this study included wire feed speeds, arc voltages, travel speed, peak currents, and pulse frequency. The characteristics of metal inert gas pulse brazing process that were considered to find response were percent zinc coating balances edge joints on the upper edge joint (PZBEJ1), the lower edge joint (PZBEJ2), and the back sides of the edge joint (PZBEJ3). Analysis of variance was performed to determine the impact of an individual process parameter on the quality parameters. The results showed that the optimal parameters in which grey relational grade increases at the highest level were wire feed speeds at 3.25 m/min, arc voltages at 16 V, travel speeds at 0.9 m/min, peak currents at 425 A, and pulse frequency at 35 Hz. These parameters gave a 74.90% higher response value than those of the initial parameters of metal inert gas pulse brazing process.
Keywords
Introduction
Presently, Thailand’s industries, such as the automotive industry, the shipbuilding industry, the construction industry, and even the medical industry, use galvanized steel sheets as assembly materials for their products. In their manufacturing or production process, 1 the joint process through welding or brazing is routinely employed, because it is considered useful for assembly production and maintenance work. As such, brazing technology must be able to efficiently respond to the industrial need. Metal inert gas pulse welding (MIGPW) 2 is a welding process in which the welding current has been designed as a pulsing system. The pulsing MIGPW process contributes a low joining heat input, resulting in the removal of the zinc coating around the joining area of the workpiece being welded, and at the same time, the process allows the melting filler materials to flow through the joint area leading to the none-melting base metal. With this welding process, a very low de-coating surface will be achieved. Metal inert gas pulse brazing (MIGPB) 3 is an efficient and a high-technology method of joining, when utilized with the MIGPW process. MIGPB can be used for many types of joints because of its efficient joint penetration control, with low spatter level, and up to 3–4 times more welding speed than conventional welding processes. Thus, MIGPB has been employed for joining galvanized steel sheets. However, the actual metal inert gas pulse brazing process (MIGPBP) in the industry faces constraint of zinc coating balances edge joints where inputs or parameters of the MIGPBP are non-optimal. MIGPBP still depends on the experience and skill level of welders and/or practitioners. Non-optimal parameters and improper conditions might lead to defects of a joint that reduce the quality of work and shorten its lifetime.
The general procedures that could be used to search for the optimal welding parameter settings are the design of experimental techniques, such as fractional factorial design, soft computing techniques (e.g. genetic algorithm, artificial neural networks), multi-objective optimization methods, and the Taguchi method (TM). In recent years, the TM has been increasingly used for process optimization. It is a systematic application for the design and analysis of experiments aimed at developing optimal parameters in order to achieve a desired quality and productivity improvement, with a minimum number of experiments.4–6
The TM and grey relational analysis (GRA) have been successfully applied in the manufacturing field for nearly three decades to robustly design products or processes having a single quality parameter. Table 1 shows that some researchers7–10 used the TM for selection of optimum levels of process parameters in welding. For example, Juang and Tarng 7 employed the TM to solve the optimal weld bead geometry in the tungsten inert gas welding process for stainless steel. Anawa and Olabi 8 applied the TM for the minimization of a weld pool fusion area and dissimilar weld pools in the laser welding process. Sathiya et al. 9 also adopted the TM for micro-structural characteristics of a bead on plate welding of AISI 904L, super austenitic stainless steel, in the gas metal arc welding (GMAW) process. Huang 10 studied the TM for analysis of the optimal effects of activating flux on the welded joint characteristics in the GMAW process. Haragopal et al. 11 applied this method to the design parameter of the Al-65032 alloy in the GMAW process.
Comparison of related research.
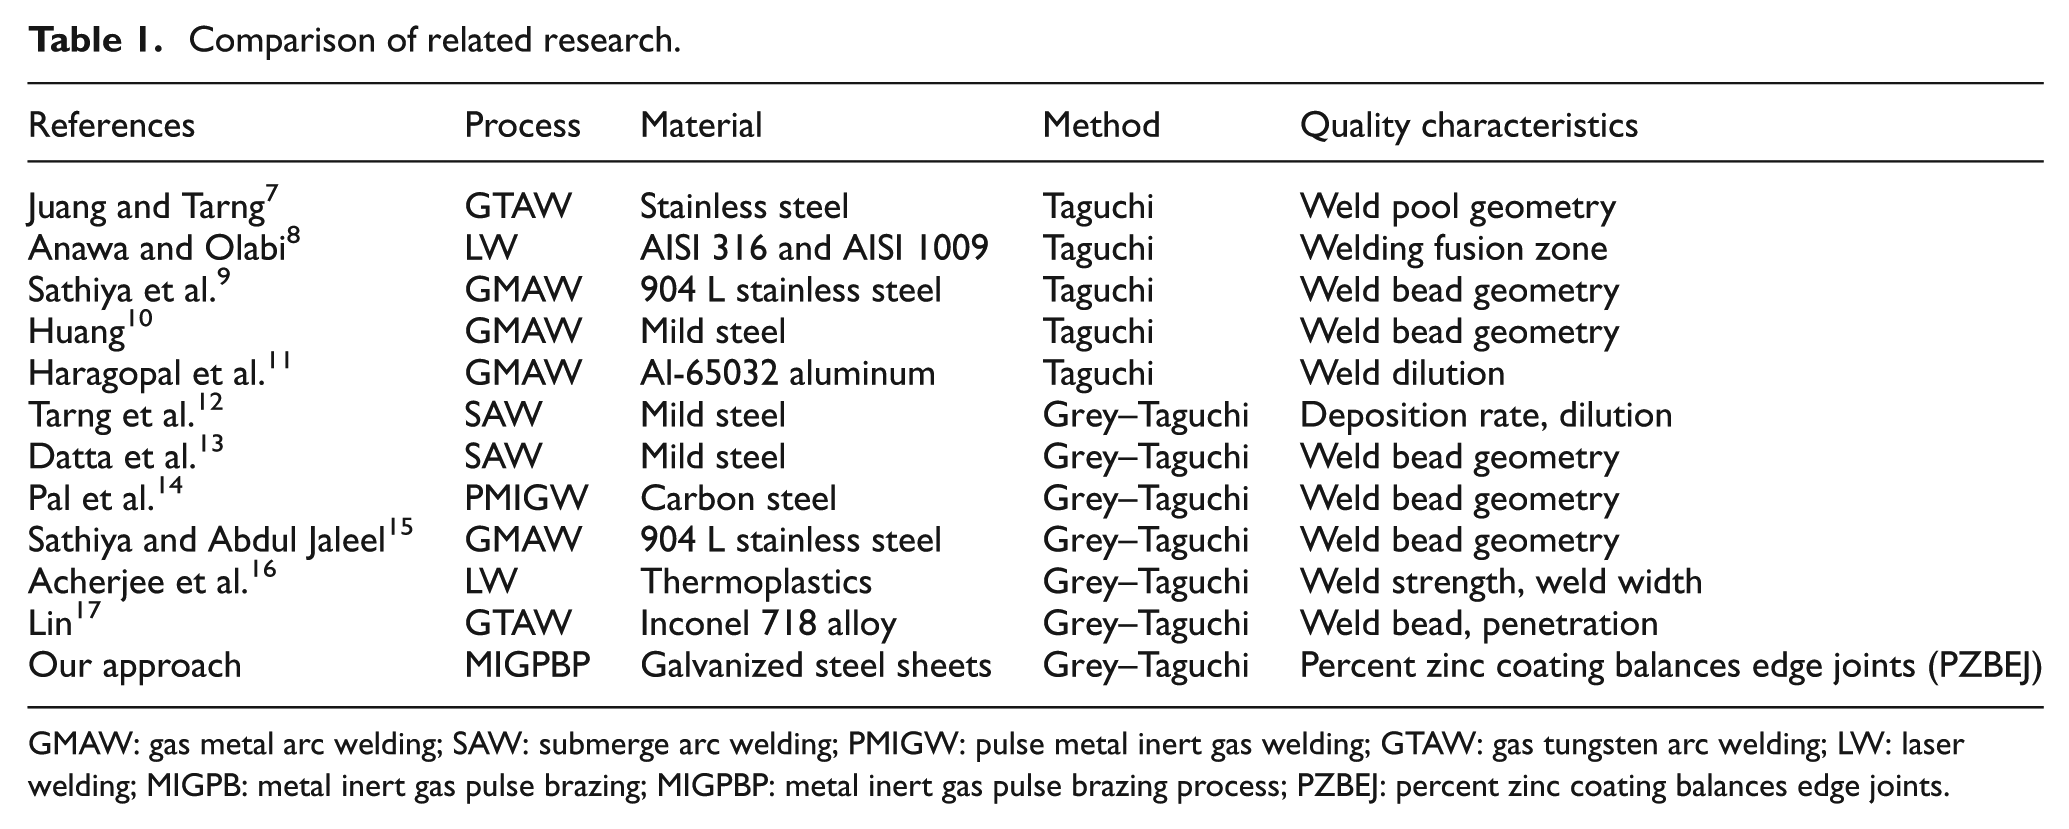
GMAW: gas metal arc welding; SAW: submerge arc welding; PMIGW: pulse metal inert gas welding; GTAW: gas tungsten arc welding; LW: laser welding; MIGPB: metal inert gas pulse brazing; MIGPBP: metal inert gas pulse brazing process; PZBEJ: percent zinc coating balances edge joints.
Some researchers12–17 have used the TM and GRA for their selection of optimum levels of process parameters in welding. All of them used the same method to solve for optimum values; their different welding processes, workpiece materials, and quality characteristics are shown in Table 1. Tarng et al. 12 applied the GRA-based TM to determine the optimal process parameters in the submerge arc welding (SAW) process by considering multiple weld qualities. Datta et al. 13 adopted the TM with GRA analysis to determine the optimal process condition in SAW processes so as to yield the desired weld bead geometry. Also, Pal et al. 14 adopted this method for optimization of the quality characteristic parameters in a pulsed metal inert gas welding process. Sathiya and Abdul Jaleel 15 studied the GRA-based TM for the micro-structural characteristics of the bead on plate welding of AISI 904 L super austenitic stainless steel in the laser welding process. Acherjee et al. 16 employed the GRA-based TM for analysis of the parametric optimization for the laser welding process. Lin 17 used the TM with GRA and a neural network for the optimization of Inconel 718 alloy welds in activated gas tungsten arc welding (GTAW).
In this work, the percentage of the zinc coating balances edge joints of the galvanized steel sheets using the MIGPBP was studied. The TM and GRA were used to look for the optimal parameter settings of the MIGPBP. Wire feed speeds, arc voltages, travel speed, peak currents, and pulse frequency were considered controllable parameters. Additionally, the analysis of variance (ANOVA) was also applied to identify the most significant parameter. Percent zinc coating balances edge joint (PZBEJ) efficiency was deemed the MIGPB quality parameters as shown in Figure 1.

Input and output parameters of the metal inert gas pulse brazing process.
Experiment details
This section describes the experimental set-up and method for the measurement of PZBEJ. Also, plans for experiments, the TM and GRA, were explained.
Experiment set-up
MIGPBP
A galvanized steel sheet, MIGPB layer, was deposited by the metal inert gas pulse (MIGP) process of Fronius-TransPulse 450 Inverter as a power source. Figure 2 shows a schematic diagram of the semi-mechanized MIGPB station used during the experiment.

Schematic diagram of metal inert gas pulse set-up.
Base material
The specimen materials were 0.8 mm galvanized steel sheets with a 7.02 µm thick galvanized coat. The chemical composition of the galvanized steel sheets is shown in Table 2.
Chemical composition (wt%) of the base metal.

Filler metal (electrode solid wire)
The filler metal was solid wire AWS ER CuSi-3 (∅ 0.8 mm). The chemical composition of the filler metal is shown in Table 3.
Chemical composition (wt%) of the filler metal.

Shielding gas
Commercial argon (99.98%) was used as the shielding gas in all experiments. The flow rate of the shielding gas is 10 L/min.
Specimens
There were two specimens. Each had a 100 mm × 150 mm dimensional surface. The JIS-Z-3194 was used for preparation of specimens in this study and must be cleaned by acetone before the MIGPBP. In preparing specimens for the MIGPBP, both specimens were put in forms of a lap joint for a length of 10 mm, and joint fit-up for 0.5 mm, as shown in Figure 3.

Schematic preparing joint of specimens for metal inert gas pulse brazing process.
Measurement of the PZBEJ
The researcher prepared the specimens and cut them to be sized for 20 × 30 mm. Cleaning specimens is accomplished using acetone. PZBEJ is measured as shown in Figure 4. After the MIGPBP, take the specimens and measure the PZBEJ to see the effect on the upper edge joint (PZBEJ1), the lower edge joint (PZBEJ2), and the back sides of edge joints (PZBEJ3). In doing so, the scanning electron microscope (SEM) equipment was used to check the quantity of PZBEJ using the energy dispersive spectroscopy (EDS) mode to test the PZBEJ1, PZBEJ2, and PZBEJ3, as shown in Figure 4.

Schematic determination of PZBEJ: (a) a graphics drawing of PZBEJ1 (F-A) shows an upper edge joint, PZBEJ2 (A-F) is a lower edge joint and PZBEJ3 (A-F) is a backside joint; (b) the photo specimen of PZBEJ1 shows an upper edge joint and PZBEJ2 is a lower edge joint; and (c) PZBEJ3 is a backside joint.
Figure 4 presents the checking points of the PZBEJ at the upper edge joints and lower edge joints front sides (PZBEJ1 and PZBEJ2). All checking points were placed 1.00 mm apart from one another (see PZBEJ1 (F-A) and PZBEJ2 (A-F)). Hence, there were six checking points per each zone ranging from 1 to 6 mm to measure the average percentage of the zone PZBEJ1 and PZBEJ2. The same was true for measuring the PZBEJ’s backside of the joint at zone PZBEJ3, directly resulting from the MIGPBP. All checking points at the backside of the joint were placed apart from one another by 1.00 mm, including six checking points, to be checked for average percentage of PZBEJ3. Finally, all parameters were to be calculated once again to find the average percentage of the PZBEJ1, PZBEJ2, and PZBEJ3.
Plan of experiments
This article used the TM to optimize MIGPBP parameters for galvanized steel sheets. Five parameters were used; each contains five levels18–21 as shown in Table 4. The MIGPBP parameters 22 were determined by varying ranges of the wire feed speed (w) at 3–4 m/min, of arc voltages (v) at 15–19 V, of travel speed (s) at 0.6–1 m/min, of peak currents (p) at 350–450 A, and of pulse frequency (f) at 25–45 Hz. Additional parameters, level 3 including w = 3.50 m/min, v = 17 V, s = 0.8 m/min, p = 400 A, and f = 35 Hz, were added in the design of experiment in order to look for its response and then compared with the optimal response resulting from the TM and GRA. MIGPBP parameters in this study are shown in Table 4. In addition, there were parameters relevant to MIGPBP that were used determine constants: work angle of filler metal at 45°, travel angle of filler metal at 75°, nozzle to work distant at 15 mm, and forehand MIGPBP.
Metal inert gas pulse brazing process parameters and their levels.

MIGPBP: metal inert gas pulse brazing process.
Initial MIGPBP parameters.
By taking into consideration the parameters of the plan of experiments, this study adopts Taguchi’s orthogonal array (OA) to test five parameters. Each parameter incorporates five levels. Thus, a L25 OA is designed to be five columns in accordance with the parameters and 25 rows in agreement with the five levels of each parameter for the MIGPBP of the galvanized steel sheets, as shown in Table 5.
Experimental design using an L25 OA of Taguchi. 14

MIGPBP: metal inert gas pulse brazing process; OA: orthogonal array.
Analysis of the signal-to-noise ratio
In the TM, the term signal represents the desirable value for the characteristic and term noise represents the undesirable value (standard deviation (SD)) for the output characteristic. This method is useful for studying the interactions between the parameters, and also it is a simple, efficient, and systematic approach to determine optimal MIGPBP parameters. The difference between the functional value and objective value is emphasized and identified as the loss function which is derived as follows

where L(y) is the loss function; y is the value of the quality characteristic; m is the target value of y; k is the proportional y constant, which depends on financial criticality of y; and MSD is the mean square deviation for the output characteristic. Equation (1) can be expressed by signal-to-noise (S/N) ratio

As mentioned earlier, there were three categories of experimental results, that is, the lower-the-better, nominal-the-better, and higher-the-better. To obtain optimal MIGPBP performance, the higher-the-better characteristic for the PZBEJ must be taken. The equation for calculating S/N ratio for the higher-the-better characteristic was defined as follows

where n is the number of observations, and yi is the observed data or each type use of the characteristic.
GRA
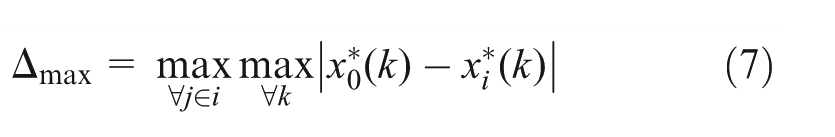
GRA is the method used to determine the appropriate parameters for the MIGPBP, in this case, PZBEJ1, PZBEJ2, and PZBEJ3. It is also the method used to compare the levels of parameters at different levels. Response parameters close to the reference give the average grade of grey relational grade (GRG) at a high level. In order to reach the optimal result, the highest grade of GRG should be adopted. To analyze GRG, average results obtained from the TM have been designed in the range of 0–1. Response parameters, PZBEJ1, PZBEJ2, and PZBEJ3, have been interpreted in the form of the larger-the-better which is calculated as shown below

When
Grey relational coefficient and grey relational grades
In order to find out the grey relational coefficient (GRC), the range of 0–1 response value has been calculated. GRC is the variable that presented the experimental response and ideal response relationship. It can be calculated as follows

When


When
When
Results and discussion
This experiment attempted to find the PZBEJ in the PZBEJ1 zone, PZBEJ2 zone, and PZBEJ3 zone, the results which were taken to determine the S/N ratio, derived from equation (3). This S/N ratio is the higher-the-better characteristic as shown in Table 6.

OA: orthogonal array; PZBEJ: percent zinc coating balances edge joints; S/N: signal-to-noise.
Average of three replications.
Results of TM
The earlier sections have shown the appropriate parameters in MIGPBP of the galvanized steel sheets as shown in Table 6. Moreover, ANOVA analysis 23 indicated that all five parameters in the MIGPBP have influenced PZBEJ1, PZBEJ2, and PZBEJ3. The TM has been implemented in this section.
Analysis of the results according to the PZBEJ1
The higher-the-better characteristics were used. MIGPBP parameter settings with the highest S/N ratio always yield the optimum quality with minimum variance. The average S/N ratio for PZBEJ1 is shown in Figure 5. It shows that optimum conditions for the PZBEJ1 can be established: wire feed speeds at 3.25 m/min (w2), arc voltages at 18 V (v4), travel speeds at 0.8 m/min (s3), peak currents at 425 A (p4), and pulse frequency at 30 Hz (f2). Only these conditions provide the best PZBEJ1 among the MIGPBP conditions tested. The results of ANOVA for the S/N ratio of the PZBEJ1 are shown in Table 7 and indicate that the P value of travel speed at 0.004 and wire feed speed at 0.033 are lower than α at 0.05. It can be concluded that travel speeds and wire feed speeds are influential parameters for PZBEJ at the PZBEJ1 zone, at a 95% significant level. As for the peak current at 0.067, pulse frequency at 0.078, and arc voltage at 0.220, these values do not affect the PZBEJ at PZBEJ1 zone, at 0.05.

Parameters responses of PZBEJ1.
Results of ANOVA for S/N ratio of the PZBEJ1.

ANOVA: analysis of variance; PZBEJ: percent zinc coating balances edge joints; S/N: signal-to-noise.
Percentage of contribution.
Analysis of the results according to the PZBEJ2
In Figure 6, the average S/N ratio for higher-the-better for PZBEJ2 is presented. The quality characteristic considered in the investigation is higher-the-better. Process parameter settings with the highest S/N ratio always yield the optimum quality with minimum variance. Based on the evidence from Figure 6, the optimum conditions for the PZBEJ2 can be established: wire feed speed at 3.25 m/min (w2), arc voltage at 16 V (v2), travel speeds at 0.8 m/min (s3), peak currents at 400 A (p3), and pulse frequency at 35 Hz (f3). The results of the ANOVA for S/N ratio as shown in Table 8 describe that P value of travel speed at 0.029 is less than α at 0.05. So, it is concluded that travel speed is the influential parameters of PZBEJ at PZBEJ2 zone for MIGPBP at a 95% significant level. As for the wire feed speed at 0.108, pulse frequency at 0.192, arc voltage at 0.224, and peak current at 0.381, these parameters have less effect to PZBEJ at the PZBEJ2 zone.

Parameters responses of PZBEJ2.
Results of ANOVA for S/N ratio of the PZBEJ2.
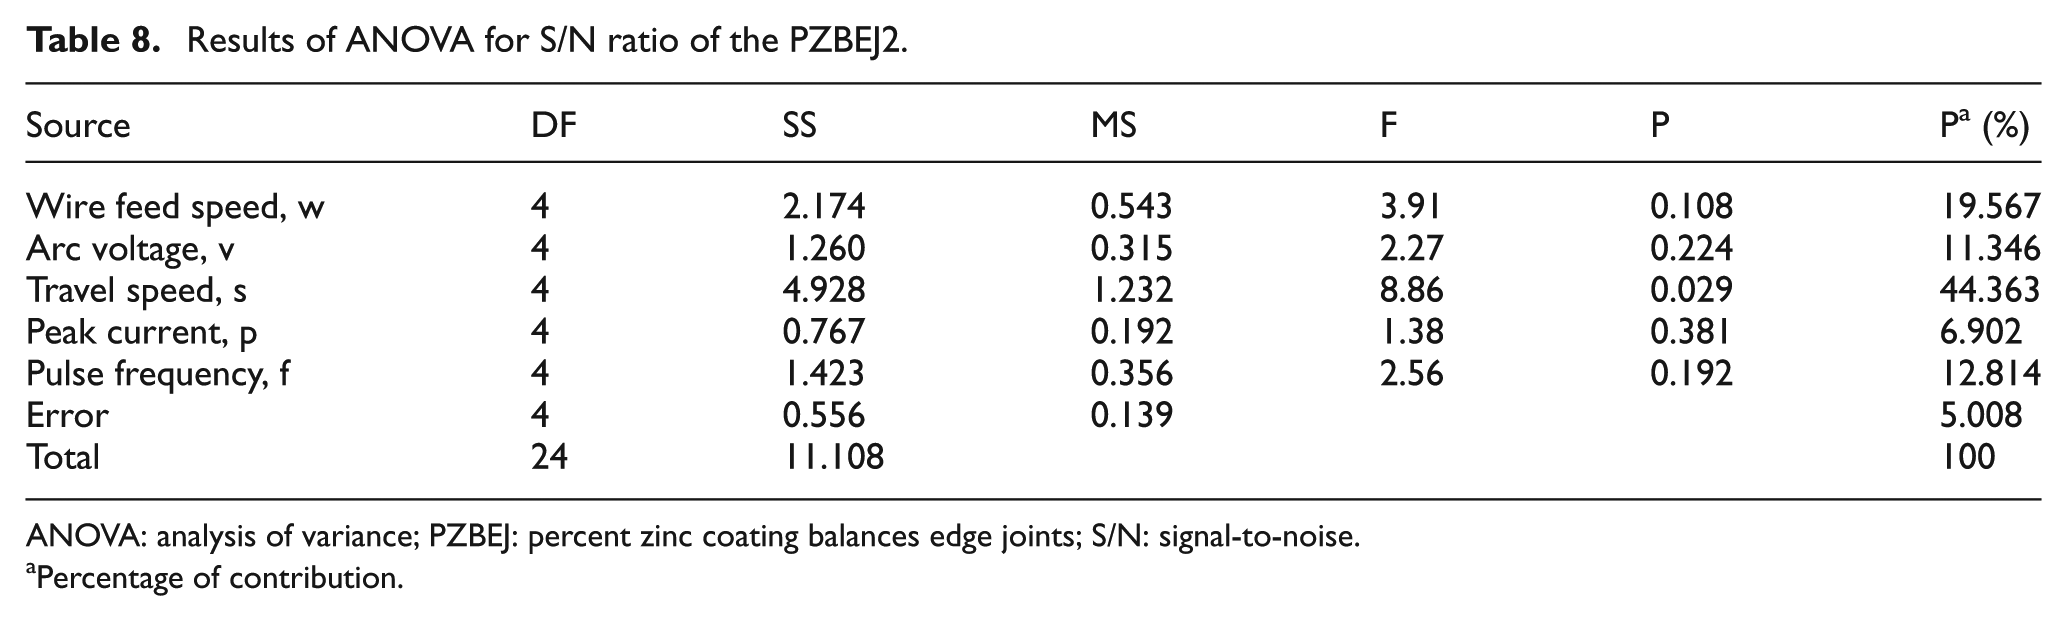
ANOVA: analysis of variance; PZBEJ: percent zinc coating balances edge joints; S/N: signal-to-noise.
Percentage of contribution.
Analysis of the results according to the PZBEJ3
Figure 7 shows the mean S/N ratio for each level of PZBEJ3. The higher-the-better characteristics were used. As evident from Figure 7, the optimum conditions for the PZBEJ3 can be established: wire feed speeds at 3.25 m/min (w2), arc voltages at 16 V (v2), travel speeds at 0.9 m/min (s4), peak currents at 400 A (p3), and pulse frequency at 45 Hz (f5). The results of ANOVA for the S/N ratio are shown in Table 9. The ANOVA table indicates that the P value of travel speed at 0.001, pulse frequency at 0.013, and wire feed speed at 0.024 is less than α at 0.05. So, it can be concluded that travel speed, pulse frequency, and wire feed speed are parameters that influenced PZBEJ3 for MIGPBP at a 95% significant level, while peak current at 0.076 and arc voltage at 0.169 have less effect on the PZBEJ3 zone.

Parameters responses of PZBEJ3.
Results of ANOVA for S/N ratio of the PZBEJ3.

ANOVA: analysis of variance; PZBEJ: percent zinc coating balances edge joints; S/N: signal-to-noise.
Percentage of contribution.
Evaluated GRC and GRG
GRA basically begins with transformed response or S/N ratio, resulting from the experiment, in the range of 0–1. Responses of PZBEJ1, PZBEJ2, and PZBEJ3 are needed to be the larger-the-better, and these responses can be transformed by equation (4). Transformed responses ranging between 0 and 1 in this study are shown in Table 10. The table presents percentage of PZBEJ1 resulting from the experimental specimens. The minimum values of experimental specimens will be designed as 0, while the maximum values will be designed as 1. In addition, transformed responses of PZBEJ2 and PZBEJ3 are also the same.
Normalized original sequences after data preprocessing for performance characteristics.

PZBEJ: percent zinc coating balances edge joints.
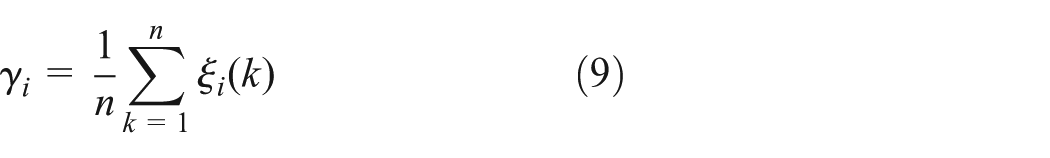
Transformed responses ranged between 0 and 1 will be calculated to find GRC and GRG, as shown in equations (5) and (9), respectively. The study used 0.5 coefficient difference
Calculated GRC and GRG.

GRC: grey relational coefficient; GRG: grey relational grade; PZBEJ: percent zinc coating balances edge joints.
ANOVA results GRG
Figure 8 points to values of GRG resulting from the GRA method. The results show that the optimal parameters, in which GRG increased at the highest level, were wire feed speeds at 3.25 m/min (w2), arc voltages at 16 V (V2), travel speeds at 0.9 m/min (s4), peak currents at 425 A (p4), and pulse frequency at 35 Hz (f3). The results of ANOVA from Table 12 present the comparison of P value. The parameters must be less than 0.05; then the parameter will affect GRG at the significant level. According to the ANOVA analysis of the GRG shown in Table 12, the most significant parameters were the travel speed, wire feed speed, peak current, and arc voltage, respectively. The contributions of the travel speed, wire feed speed, peak current, and arc voltage were 50.806, 28.968, 8.626, and 8.044, respectively.

Parameters responses of GRG.
Results of ANOVA for GRG.

GRG: grey relational grade; ANOVA: analysis of variance.
Percentage of contribution.
Confirmation tests
The objective of the experiment was to optimize the MIGPBP parameters to get better PZBEJ of the galvanized steel sheets. In this section, the optimal GRG of MIGPBP derived from the TM and GRA are response values, which were taken to compare with the initial parameters, including values of trial no. 26 at w3v3s3p3f3, as shown in Table 13. The experimental results obtained using these optimal MIGPBP parameters are presented in Table 13. The optimal parameters of MIGPBP at PZBEJ1 zone, derived from the TM, were values at w2v4s3p4f2. Those optimal parameters at PZBEJ2 zone were values at w2v2s3p3f3, and those at PZBEJ3 zone were values at w2v2s4p3f5. Besides, the optimal parameters of MIGPBP derived from the GRA were values at w2v2s4p4f3. The results of trial no. 27–29 confirm that optimization of the MIGPBP parameters, via the TM only, was achieved. In addition, the results of trial no. 30 confirm that the optimization of the MIGPBP parameters via the TM with GRA was achieved too.
Results of the confirmation experiment.

MIGPBP: metal inert gas pulse brazing process; PZBEJ: percent zinc coating balances edge joints; TM: Taguchi method; GRA: grey relational analysis.
Table 14 also shows the results of MIGPBP performance using the TM and GRA. The comparison of the optimal responses using the TM and the GRA methods results in GRG. The findings from these approaches show that the optimal parameters of MIGPBP derived from the TM were higher than the initial parameters response values: PZBEJ at the PZBEJ1 zone by 44.1%, at the PZBEJ2 zone by 53.9%, and at PZBEJ3 zone by 48.1%. Also, the optimal parameters using GRA gave a 74.9% higher response value than the initial parameters. Table 15 illustrates the specimens of the MIGPBP and explains the response of PZBEJ1, PZBEJ2, and PZBEJ3 resulting from the optimal parameters. The initial parameters, the optimal parameters at the PZBEJ1 zone derived from the TM, and the optimal parameters derived from the GRA are shown in Table 15.
Results of MIGPBP performance using the TM and GRA.

MIGPBP: metal inert gas pulse brazing process; PZBEJ: percent zinc coating balances edge joints; TM: Taguchi method; GRA: grey relational analysis.
Average of confirmation tests.
Specimens of the MIGPBP explain the response of PZBEJ1, PZBEJ2, and PZBEJ3 resulted from the optimal parameters.
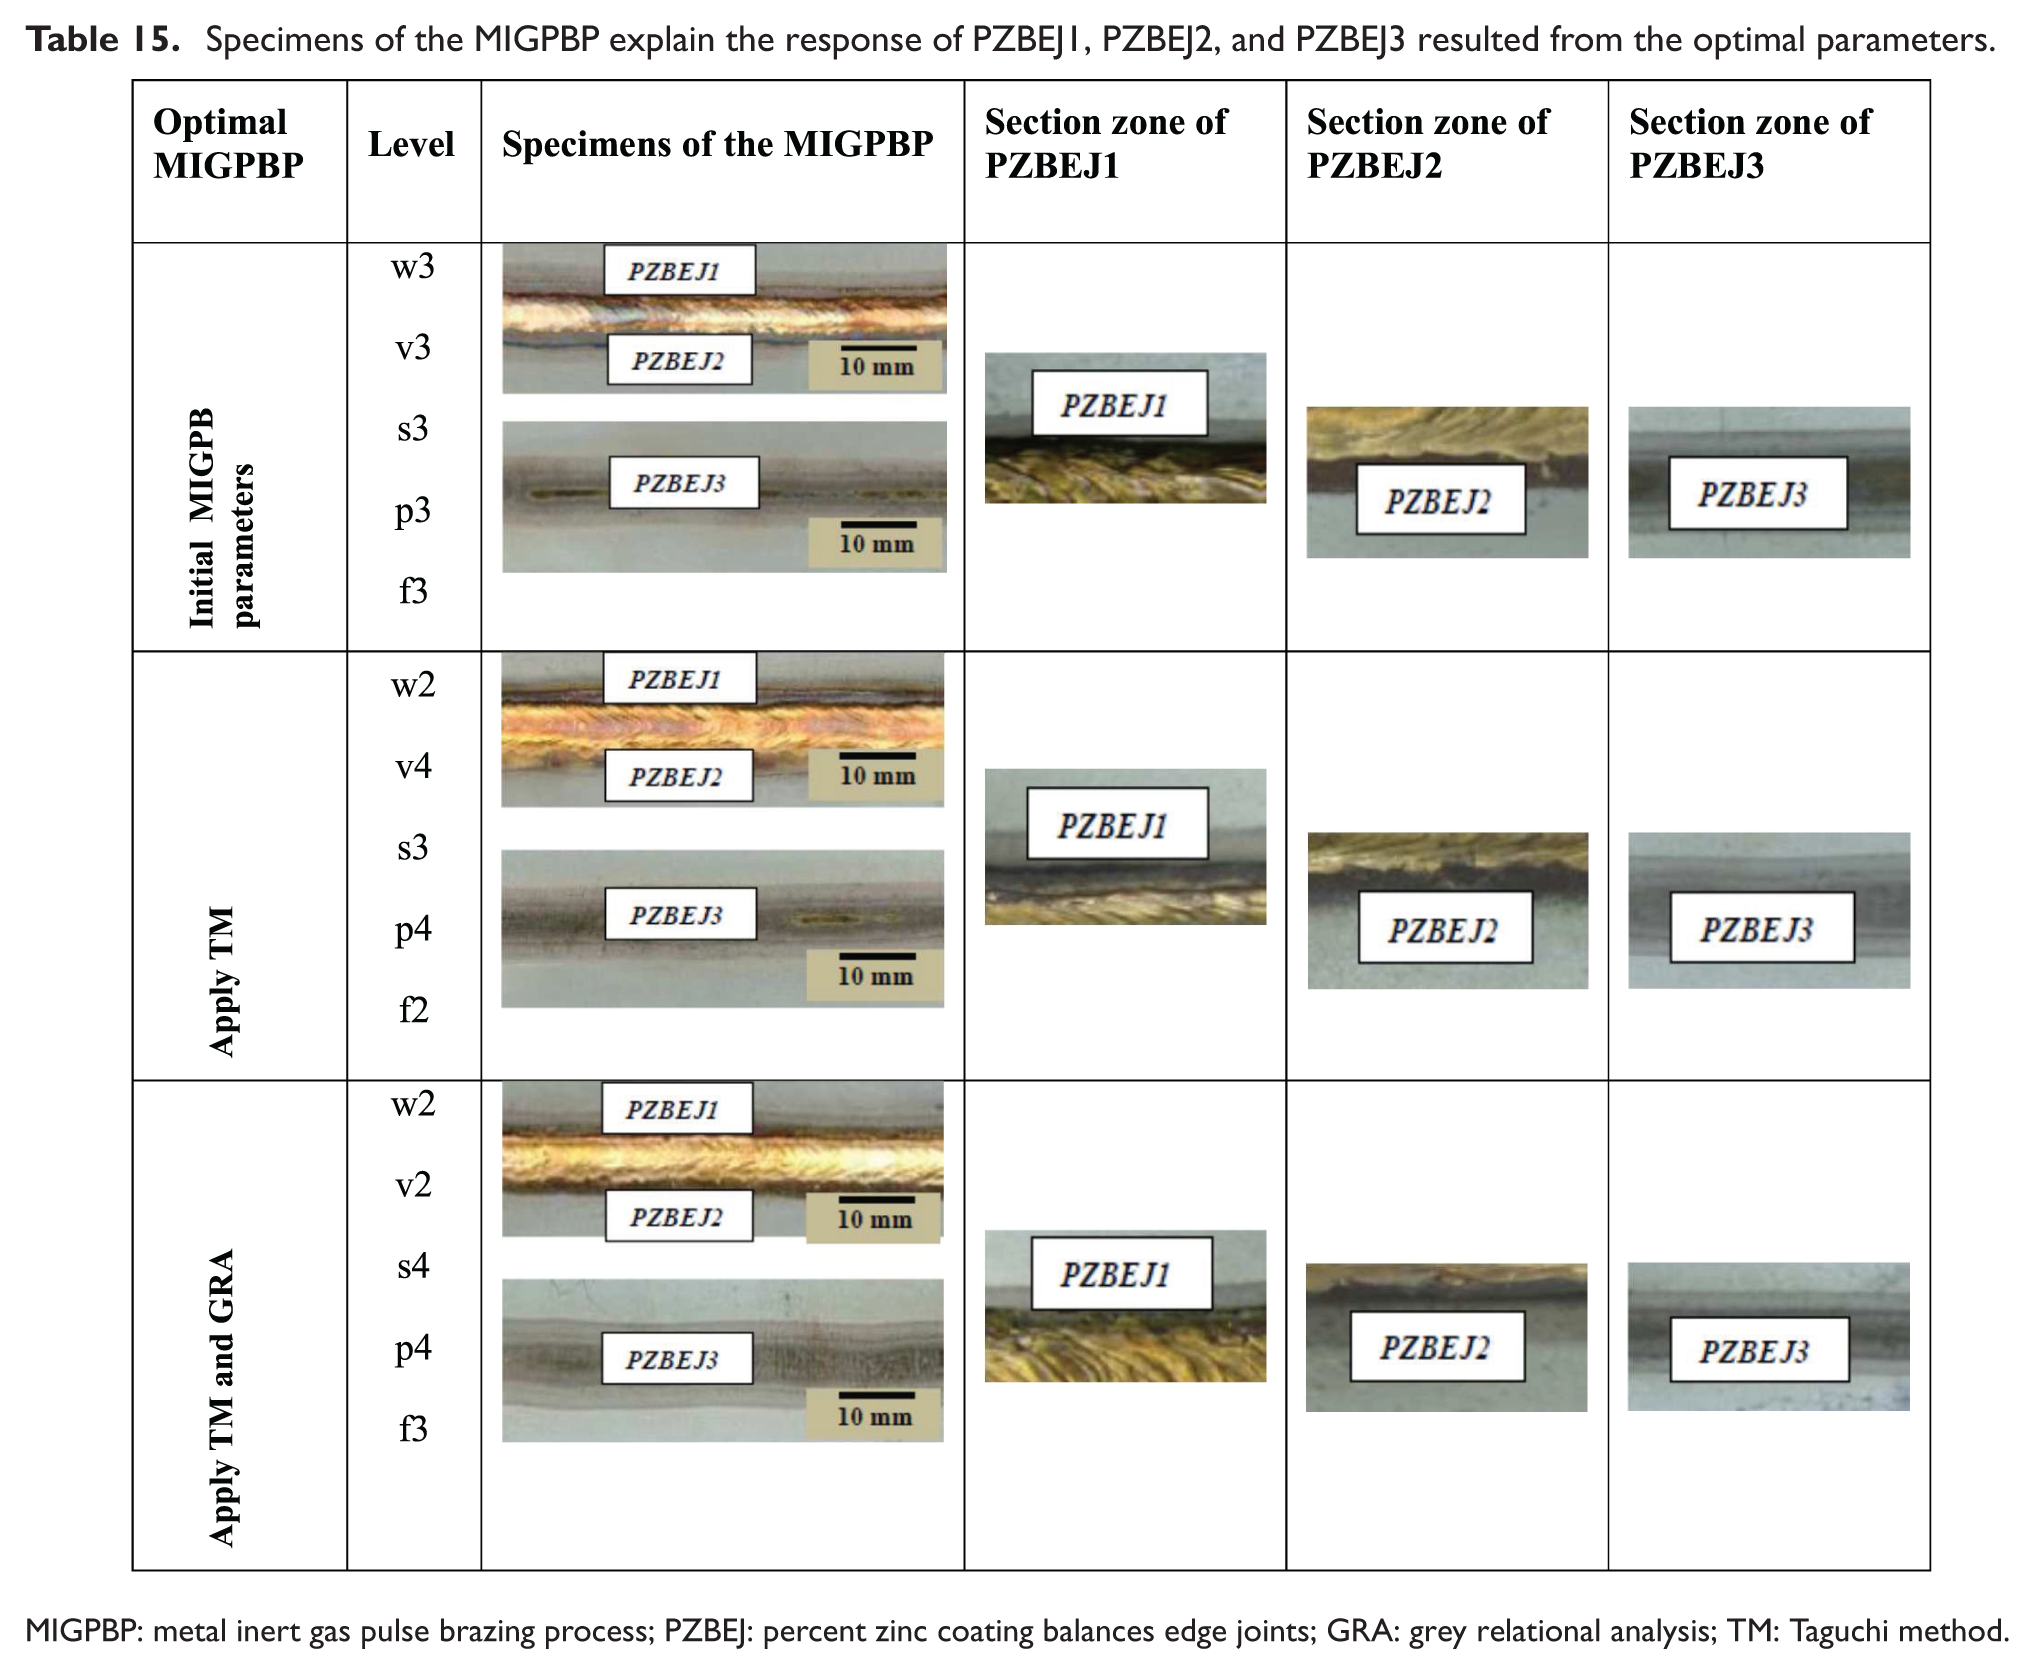
MIGPBP: metal inert gas pulse brazing process; PZBEJ: percent zinc coating balances edge joints; GRA: grey relational analysis; TM: Taguchi method.
It reveals that an improvement of the TM and GRG is made when the initial optimal parameters are changed to the real optimal parameters. The optimal parameter of the PZBEJ zone of the specimen, applying the proposed approach, not only improves each PZBEJ zone, but also increases every PZBEJ zone of the galvanized steel sheets as shown in Table 13, except for the optimal parameters of the PZBEJ2 zone which derived from the TM for the experimental value at PZBEJ3. In this experiment, not only the wire feed speed, arc voltage, travel speed, peak current, and pulse frequency affected parameters, but also work angle, travel angle, nozzle to work distant, and forehand MIGPBP, which are constant values, had affect on the optimal parameters as well. Therefore, in future work, these parameters may be taken into account.
Conclusion
This study presents the optimal parameters of the PZBEJ of the galvanized steel sheets using MIGPBP parameters including wire feed speed, arc voltage, travel speed, peak current, and pulse frequency. The target response values were the PZBEJ1 zone, PZBEJ2 zone, and PZBEJ3 zone. The results of MIGPBP performance using the TM and GRA showed the optimal parameters derived from the TM and were higher response values (PZBEJ1 zone by 44.1%, PZBEJ2 zone by 53.9%, and PZBEJ3 zone by 48.1%) than the initial parameters. Similarly, the optimal parameters using the GRA (w2v2s4p4f3 gave a 74.9%) showed a higher response value than the initial parameters. ANOVA was also performed to determine the effect of individual process parameters on the quality parameters. Confirmation tests were done for validation of the proposed approach.
Footnotes
Academic Editor: Xichun Luo
Declaration of conflicting interests
The author(s) declared no potential conflicts of interest with respect to the research, authorship, and/or publication of this article.
Funding
The author(s) received no financial support for the research, authorship, and/or publication of this article.