
Abstract
A mud pump is one of the three key components of a drilling site, and its lifetime and reliability are related to safety and cost. The fluid end is the most easily damaged part of the mud pump. To ensure normal operation, the fault modes of the fluid end need to be effectively identified. This study proposes to employ acoustic emission technique to identify the fault modes of mud pump fluid end, including valve disk leakage, spring break, and piston wear. The analysis method of parameters and waveforms of the acoustic emission signals are both used in this article. The characteristic parameters of the acoustic emission signals are combined with grey relational analysis to identify the fault modes with small samples; wavelet packet signal processing technique is applied to decompose and reconstruct the obtained acoustic emission signal waveforms and extract the energy of each frequency range to construct the eigenvectors which are input into the genetic algorithm with back propagation neural network for fault diagnosis. The results show that the fault modes under small samples can be effectively identified by combining the characteristic parameters and the grey relational analysis; the frequency range energy eigenvalue can be extracted using the method of wavelet packet signal processing, and the genetic algorithm with back propagation neural network is of better convergence than that of the back propagation neural network.
Keywords
Introduction
A mud pump which is often used to transport high density, high viscosity, and high sand content liquids under high pressure is one of the three key components of a drilling operation. The faults usually occurring in the fluid end of the mud pump, including valve disk leakage, spring break, and piston wear, have great effects on normal running of the mud pump; hence, it is significant to effectively identify the faults.
As a nondestructive testing technology, the acoustic emission (AE) technique began in 1950s, with the development of AE instruments, and it has been widely used in a variety of applications. Vishal et al. 1 and Ranjith et al. 2 used the AE method to study the behavior of coal. He et al. 3 applied the AE monitoring technique to study the characteristics of rock bursts. Kramadibrata et al. 4 solved rock engineering problems in Indonesian underground mining by applying the AE technique. Blachowicz et al., 5 Hooshmand et al., 6 Hekmati, 7 Casals-Torrens et al., 8 and Witos and Olszewska 9 employed the AE sensors for detection of partial discharge in power devices. Aggelis, 10 Muralidhara et al., 11 and Tittelboom et al. 12 used the AE method to monitor and analyze the crack in concrete. Dixon et al. 13 detailed the use of AE to monitor the stability of a rail soil cutting slope failure, and the monitoring approach was shown to provide real-time information that could be used by operators to make decisions on traffic safety. Kostryzhev et al. 14 applied the AE monitoring technique to detect crack growth in rail steel. Goszczyńska et al. 15 presented the application of the Identification of active damage processes (IADP) AE method to identification and location of active damage processes and automatic control of the traffic on reinforced concrete bridges that was intended to ensure safe operation of those facilities. Zejli et al. 16 employed the AE technique to detect the presence and location of broken wires in cables. Juliano et al., 17 Mostafapour and Davoudi,18,19 and Ozevin and Harding 20 detected leaks and discerned their location in pressure pipes using the AE method. Bi et al. 21 and Du et al. 22 used the AE method to detect storage tank bottom corrosion. Luo et al.,23–25 Charde et al., 26 Subramaniam et al., 27 and Stepanova et al. 28 applied the AE method in welding.
At present, fault diagnosis technology based on the AE signal has also been successfully utilized to detect faults in rotating machinery, such as diesel engines, turbines, and reciprocating compressors whose operation principles are similar with pumps. Sources of AE in rotating machinery include impacting, friction, cyclic fatigue, turbulence, cavitation, and leakage. Gao et al. 29 used the AE technique to diagnose the faults of low-speed heavy-duty gears. Wang et al. 30 and Sim et al. 31 employed the AE signal to detect valve abnormalities in reciprocating compressor. Elforjani and Mba 32 and Pandya et al. 33 applied the AE data to diagnose the faults in rolling element bearing. Mud pump is also one kind of rotating machinery. The state of pump is usually analyzed by vibration signal which is acquired by acceleration sensor.34–36 However, fault is a dynamic development process, and early weak fault vibration signal is so complex, often mixed with large amount of background noise, that the fault diagnosis gets more difficult. 37 Compared to vibration signal, AE elastic wave is not confined to the audible domain, and the effective spectral range can extend to several or even tens of megahertz frequency range. Furthermore, most of the mechanical noise frequency range can only reach up to tens of kilohertz, and the choice of resonant frequency of 150–300 kHz or higher sensor can effectively overcome the influence of interference noise. 38 On the basis of all the above, this study proposes to employ the AE technique to identify the faults in the mud pump fluid end.
Methodology
The detection principle of AE and acquisition of AE signals
The detection principle of AE
AE describes a class of phenomena in which transient elastic waves are generated by the rapid release of energy from localized sources within a material. 39 A working mud pump has plenty of AE sources. When the valve disk leaks due to corrosion, deformation, or wear, a large pressure difference is induced before and after the leakage hole. The media in the valve body spout out from the leakage hole at high speed, and the AE signals are produced due to the presence of multiphase turbulent flow formed by the fluctuating pressure field at the leakage hole. During the wear process between the piston and the cylinder liner, the AE signals are produced by the structure phase transition of the materials, the micro-process of the impact effect between the matched surfaces, the damage to the wear land, the continuously expanding micro-cracks, and the migration of abrasive particles. When the AE signals are generated from the fluid end of the mud pump, these signals can propagate along the valve body to the surface of the pump case and can then cause the surface displacement that can be detected by an AE sensor. Due to the piezoelectric effect, the AE sensor can convert the mechanical vibration of the pump box into electrical signals that are collected by an acquisition card after being amplified by the preamplifier; then, these electrical signals are input to the main control unit for analyzing, recording, and displaying.
Experiment setup
A BW-250 mud pump is taken as the research object, and faults including valve disk leakage, spring break, and piston wear are set in this study. A SAEU2S AE acquisition system and an AE sensor with operating frequency range of 20–400 kHz are used. The sampling frequency is 1 MHz, and the sample length is 2048. The AE sensor is installed on the discharge valve bonnet to collect the AE signal parameters and waveforms, simultaneously. The detection principle schematic diagram of AE and experimental equipment are shown in Figure 1.

(a) Detection principle schematic diagram and (b) experimental equipment.
Grey relational analysis
Grey relational analysis, whose basic thought is to determine the relational grade of discrete sequences by comparing the curve geometry similarity grade among different discrete sequence data, is a method to measure the relational grade of factors according to the similarity grade of internal relations or development trends among different factors in a grey system. This method is a relatively simple algorithm, which does not require too many sample data, and does not require data with a typical distribution.40,41

where

Wavelet packet analysis and energy feature extraction
Wavelet packet, which is proposed by Coifman and Wickerhauser 42 based on wavelet transform, is a more sophisticated signal analysis method. This method divides the frequency range to multi levels, further decomposes the high frequency part without subdivision in multi-resolution analysis, and adaptively chooses the corresponding frequency range according to the characteristics of analyzed signal to match the signal spectrum; hence, it can improve the time-frequency resolution.
The steps for energy feature extraction are as follows:
The original signal
The single reconstruction with wavelet packet decomposition coefficients is used to extract the signal of each frequency range.

The total energy of each frequency range is computed.

The eigenvector which is constructed based on the energy values is normalized. The eigenvector is constructed as in equation (5), and the formulations of normalization are shown in equations (6) and (7)


Wavelet packet decomposition.
Parameter optimization of back propagation neural network based on genetic algorithm
Back propagation (BP) neural network is a multilayer feed-forward network model based on the error BP algorithm. This neural network, which is connected by neurons according to a certain topological structure, as shown in Figure 3, completes information processing or fault diagnosis by making feedback on the continuous or intermittent input.

BP neural network.
Genetic algorithm, which embodies the competition mechanism of “survival of the fittest,” is an optimal search method based on natural selection and genetics.43–45 Genetic algorithm with back propagation neural network (GA-BP) is composed of structure determination of BP neural network, genetic algorithm optimization, and BP neural network prediction. The flow chart of GA-BP is depicted in Figure 4. The structure determination of BP neural network is according to the number of input and output parameters of the fitting function to determine BP neural network structure and then to determine the individual length of genetic algorithm. Genetic algorithm optimization uses genetic algorithm to optimize the weights and thresholds of BP neural network. Each individual of the population contains a weight and a threshold of the network, and the individual calculates the fitness by the fitness function. Then, genetic algorithm finds the individual with the optimal fitness through selection, crossover, and mutation operation. BP neural network prediction uses the optimal individual obtained using genetic algorithm to assign values to the initial weight and threshold of the network and then the network predicts the output after training. This method which combines genetic algorithm with BP neural network can achieve complementary advantages.

Flow chart of GA-BP.
Results and discussion
Parameter analysis
Parameter analysis is a traditional AE analysis method, which occupies an important position in the development of AE technology, and is still the main analysis method of AE signal. Figures 5 and 6 show the relational graph of mud pump under different strokes. Figure 5 displays the relational graph between impact rate and amplitude, and it can be seen that the impacts are mainly concentrated in 50–57 dB at 42 strokes/min, mainly concentrated in 62–70 dB at 72 strokes/min, mainly concentrated in 85–95 dB at 116 strokes/min, and mainly concentrated in 92–101 dB at 200 strokes/min, respectively. The amplitude range of the main impact is increasing with the increase in the pump stroke. Figure 6 displays the relational graph between energy and amplitude, and it can be seen that the signal is mainly low energy signal when the pump is at low stroke; the high energy signal is gradually increasing and the concentrated amplitude range is also increasing with the increase in the pump stroke.

Amplitude–impact rate relational graph: (a) 42 strokes/min, (b) 72 strokes/min, (c) 116 strokes/min, and (d) 200 strokes/min.

Amplitude–energy relational graph: (a) 42 strokes/min, (b) 72 strokes/min, (c) 116 strokes/min, and (d) 200 strokes/min.
For fault diagnosis, if the running state of the mud pump is regarded as a grey system, then the fault mode of the mud pump fluid end can be identified using the relational grade r. In this study, the average values of five groups of the AE characteristic parameters (impact rate, amplitude, ring count, energy rate, root mean square (RMS), and average signal level (ASL)) for each condition under 72 strokes/min are extracted as the standard eigenvectors of that condition. These eigenvectors are known as the reference sequences, as shown in Table 1, and four groups of the AE characteristic parameters for each condition are extracted as the eigenvectors to be identified, which are known as the comparison sequences. The characteristic parameters obtained under different conditions are different. The relational grades between the comparison sequences and the reference sequences are calculated according to equations (1) and (2). The calculation results of the grey relational analysis and mode identification are shown in Table 2. A higher calculated value indicates a higher relational grade, which means that the mud pump is in that running state.
AE characteristic parameters of the mud pump under different running states.

AE: acoustic emission; RMS: root mean square; ASL: average signal level.
Calculation results of grey relational analysis and mode identification.

As shown in Table 2, the combination of the AE signal characteristic parameters and grey relational analysis can effectively identify the running state of the mud pump fluid end. Grey relational analysis can accurately identify faults with small sample size, which is important for fault mode identification because obtaining a large number of test samples is difficult due to the limitations of experimental conditions and cost.
Waveform analysis
Compared with the parameters, the waveforms contain more information. In recent years, the analysis based on AE signal waveforms is gaining momentum. The AE signals of the mud pump under the normal condition, the valve disk leakage condition, the spring break condition, and the piston wear condition are obtained through experiment. Figure 7 shows the time domain waveforms of the AE signals under four experimental conditions. It is difficult to find the differences and implicit features from the figure.

Original AE signals.
The ddencmp and wpdencmp functions are applied in wavelet packet de-noising to de-noise the AE signal data. Ddencmp function is used to obtain the default threshold of the signal and then wpdencmp function is used to achieve the signal de-noising processing. A variety of wavelet basis functions could be used in wavelet packet analysis, and based on theoretical analysis and practical experience, Daubechies (db1) wavelet basis function is selected since the series of Daubechies is more suitable than other basis functions in the fault signal analysis for the rotating machinery. 46 After de-noising, the wavelet packet is used to decompose and reconstruct the de-noised signals with a three-level wavelet packet; then, the energy eigenvectors are constructed and normalized. A total of 280 eigenvectors are acquired for each condition. Taking the normal condition as an example, a de-noised AE signal waveform is decomposed and reconstructed, and the reconstruction coefficient waveforms of each node are shown in Figure 8.

Wavelet packet reconstruction coefficient waveforms.
Eight evenly divided sub-ranges are obtained after decomposition and reconstruction; the total energy of each frequency range is computed; the energy eigenvector is constructed; then, the normalized processing is performed. The energy distribution of the frequency range is shown in Figure 9.
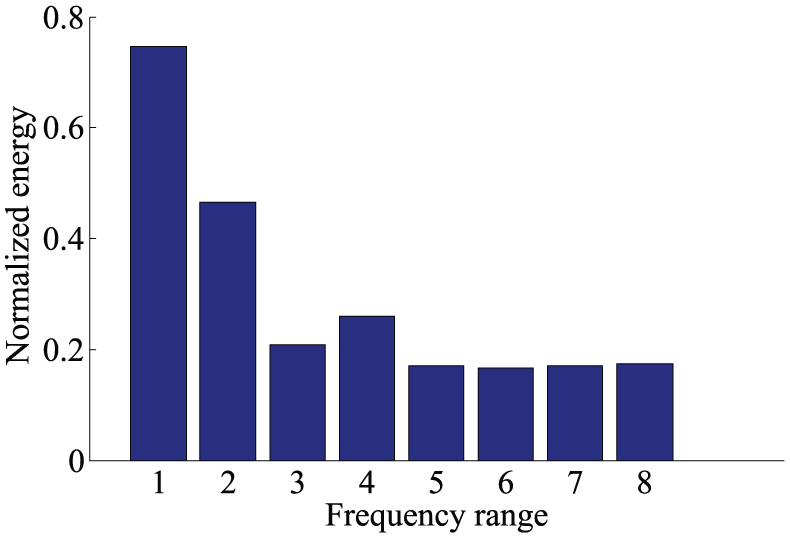
AE signal energy distribution.
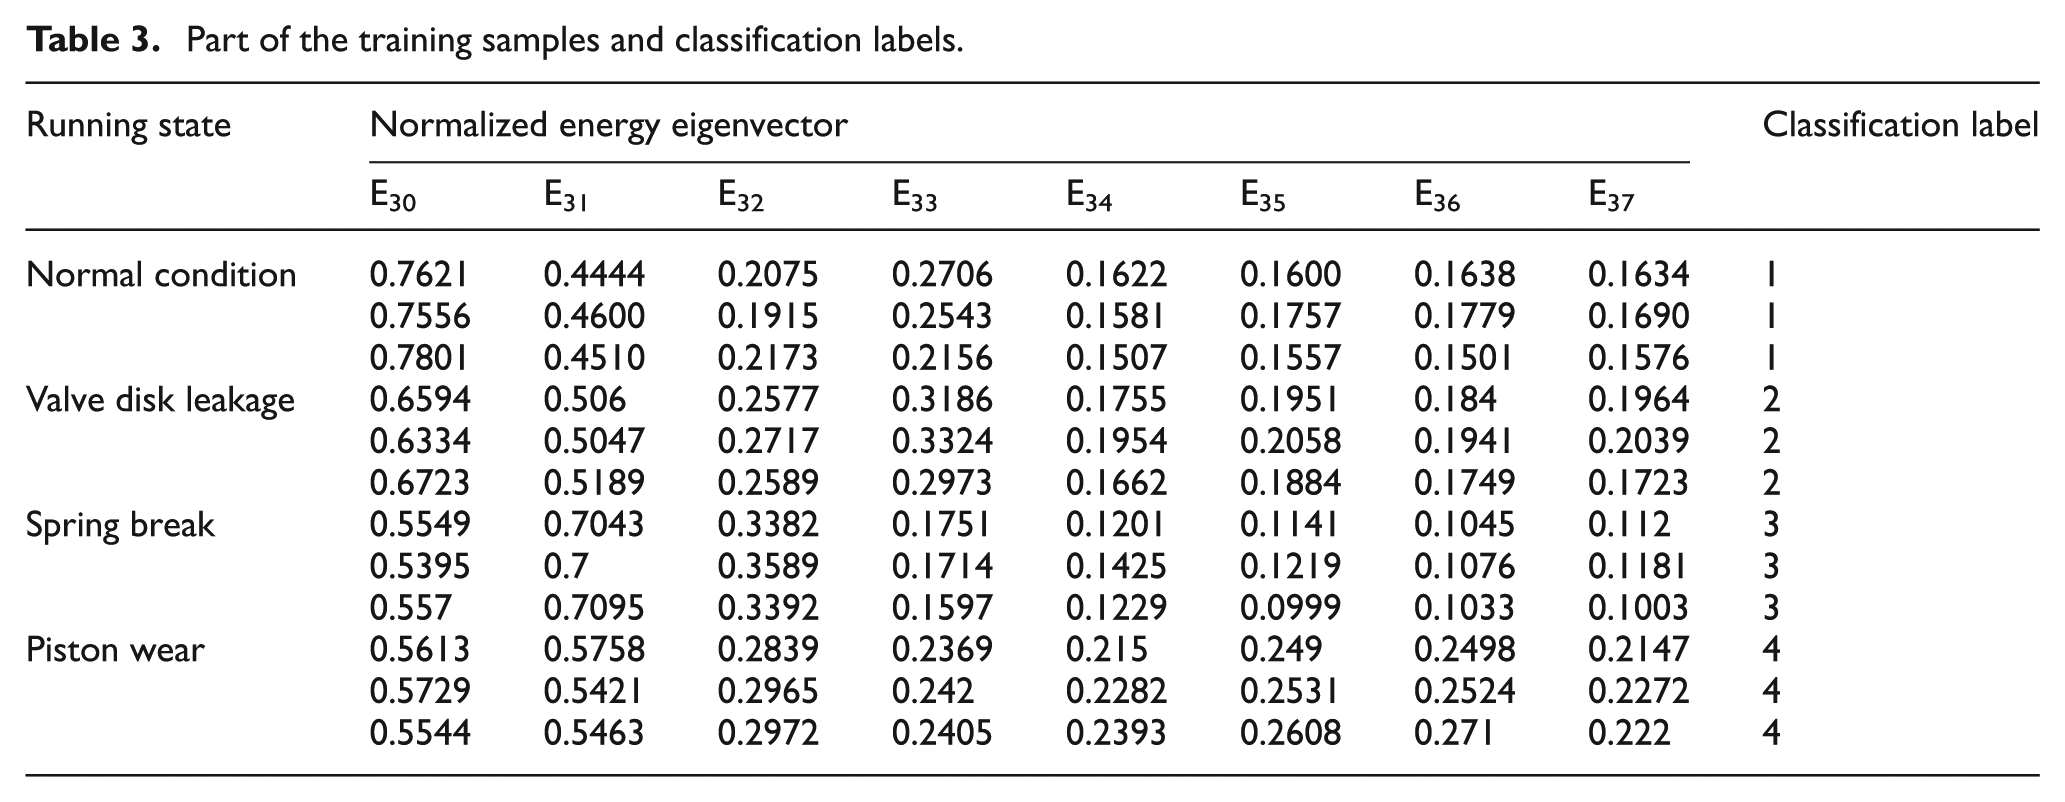
GA-BP and BP neural network are both used in this study for comparison. A total of 200 groups of data for each condition are randomly selected as the training samples and are input into GA-BP and BP neural network for training, respectively. The remaining 80 groups of data for each condition are input into the trained GA-BP and the BP neural network for classification, respectively. While training samples, different conditions are set to different classification labels. The classification label of the normal condition is 1, the classification label of the valve disk leakage condition is 2, the classification label of the spring break condition is 3, and the classification label of the piston wear condition is 4. Part of the training samples and classification labels are shown in Table 3.
Part of the training samples and classification labels.
First, the initial weight and threshold of the BP neural network are optimized using the genetic algorithm. Then, all the training samples are input into the GA-BP and the BP neural network for training, and all the test samples are input into the trained GA-BP and BP neural network for classification, respectively. In all, 8 input layer nodes, 17 hidden layer nodes, and 1 output layer node of the network are set. The tansig transfer function is used in the hidden layer neurons, the purelin transfer function is used in the output layer neurons, and the trainbr is selected as the network training function. The mean square error of the GA-BP is 9.3869e−07 and that of the BP neural network is 3.6348e−05; hence, the mean square error of the GA-BP has been greatly improved. Table 4 shows the diagnosis results. The overall classification accuracy of the GA-BP reaches 96.56%, and the overall classification accuracy of the BP neural network is 92.81%, as shown in the table. The method of GA-BP improves the diagnosis accuracy in comparison with method of BP neural network.
Diagnosis results.

GA-BP: genetic algorithm with back propagation neural network; BP: back propagation.
Conclusion
This study shows the application of AE signals for fault diagnosis of mud pump fluid end, drawing the following conclusions:
The characteristic parameters of the AE signals under different strokes of the mud pump fluid end are extracted. The impact amplitude and energy are increasing with the increase in the pump stroke, making the mud pump parts more easily damaged. Fault diagnosis for mud pump fluid end with small samples is achieved by combining the characteristic parameters of the AE signals with grey relational analysis.
The signal processing method of wavelet packet is used to extract the energy features of each frequency range of the AE signal waveforms. These energy values compose the eigenvectors that are input into the GA-BP and the BP neural network to identify the fault types of the mud pump fluid end. The overall classification accuracy reaches 96.56% improving the diagnosis accuracy in comparison with method of BP neural network, and the mean square error is 9.3869e−07 which is better than that of the BP neural network.
Footnotes
Academic Editor: Aditya Sharma
Author Note
Authors Shouceng Deng, Yu Wang and Baolin Liu are also affiliated to Key laboratory of Deep Geo-Drilling Technology of the Ministry of Land and Resources, Beijing, China.
Declaration of conflicting interests
The author(s) declared no potential conflicts of interest with respect to the research, authorship, and/or publication of this article.
Funding
The author(s) disclosed receipt of the following financial support for the research, authorship, and/or publication of this article: This work was supported by the National Natural Science Foundation of China (Nos 51175051, 41672366, and 41572360), the Fundamental Research Funds for the Central Universities (No. 292015061), and the National Key Technology Support Program (No. 2015BAD20B02). We sincerely acknowledge the previous researchers for their excellent work, which greatly assisted our academic study.