
Abstract
The energy crisis has spurred the development of electric vehicles (EVs). As one of key components of EVs, the reliability of motor drive system directly affects the wide application of EVs. Due to the bad working environment and complex working mode, the reliability of the motor is more prominent. However, at present, there are few researches on the reliability of drive motor of EVs. Therefore, research on the reliability of electric vehicle motor drive system is of great significance. In this work, the reliability theory and prior motor reliability work were applied to the validity research of driving motor of EVs. Correlation studies were performed by using a permanent magnet synchronous motor. The failure modes of the driving motor and factors influencing reliability were examined considering the environment and motor to establish a fault tree model and analyze reliability weaknesses, including the winding insulation, bearings, and permanent magnets. The reliability of the motor was then modeled via MATLAB using a hybrid intelligent algorithm based on stochastic simulation and a neural network. The results showed that the model and the algorithm were effective. In addition, this work is helpful for electric vehicle designers to improve the reliability of electric vehicle motors.
Introduction
As a whole, the automobile industry is facing large financial, energetic, and environmental challenges. Research efforts have thus been focused on developing electric vehicles to realize the electrification of the automobile power system and promote the strategic transformation of the current automobile industry.
Electric vehicles have one more electric drive link than traditional automobiles that includes the drive motor system and an energy storage unit. The drive motor system is an important part of electric and hybrid electric vehicles.1,2 Because of the complexity of the motor working environment, it has a great impact on the normal operation of the drive motor, so the reliability of the drive motor of the electric vehicle has become very important, and the reliability design and operation of the drive motor have become one of the focuses of attention.
The study of mechanical reliability began in the United States in the early 1960s at NASA as a result of many accidents caused by mechanical failures in space, 3 which included using overload testing to examine the reliability of mechanical products. The reliability of mechanical structures and parts was studied under random dynamic loads. The preset reliability target value is directly applied to the design of mechanical parts whose stress distribution and strength distribution change with time. The Reliability theory of mechanical products in the United States has been mainly studied the reliability probability design method of mechanical parts. Great progress has been made toward mechanical failure prevention and detection via the collection and analysis of failure data. Some reliability design manuals and guides and reliability data manuals have been compiled.
In Japan, the Japan Science and Technology Alliance has promoted the design of practical reliability testing. The development of mechanical reliability testing depends on the inherent technology, through the reliability experiment and the use of information feedback, continuous improvement, to achieve reliability growth.4–6 Reliability theory should be applied to the design part with problems. In addition, due to the application of a large number of new technologies, new materials, new processes, and the lack of practical experience, the reliability technology was required to help designers to analyze and evaluate. In the aspect of reliability engineering application, more attention should be paid to the research and application of reliability experiment, fault diagnosis and life prediction technology, as well as the collection and feedback of product failure analysis and field operation data.
Recently, researchers have investigated reliability models, reliability analysis, and reliability test methods of motors.7–9 A reliability analysis model based on a fault tree has been proposed, as were several insulation life estimation models.
Although researchers have investigated the reliability of various motors types, little work has been done on reliability of the drive motor of an electric vehicle. The widespread use of electric vehicles will require more thorough reliability investigations of this drive motor. This work therefore aims to develop a fuzzy evaluation model on the reliability of the electric vehicle’s drive motor.
Reliability theory of electrical machines
The reliability of a product refers to its ability of a product to perform a specified function without failure within a specified time and under specified conditions. An instrument that works when needed is reliable, whereas one that sometimes works and sometimes does not is unreliable. In technical terms, the more reliable a product is, the longer it can work without failure. As such, reliability can be evaluated by a product’s failure rate and average failure-free interval.
Reliability theory is the basis of fault tree analysis. As such, several key technical indicators are described as follows:
Reliability (R)
The reliability of an equipment R(t) is defined as the probability of the equipment that completes the specified function within the specified time t under the specified conditions:

where
Cumulative failure probability
The cumulative failure probability, or unreliability, is represented by the distribution of product life, F(t), and provides the probability that a product will fail under specified conditions within a specified period of time. The cumulative failure probability can be expressed as:

OR

Failure probability density
The failure probability density f(t) is the derivative of the cumulative failure probability with respect to time t, and represents the probability that the product will fail over time t. It can be expressed as:

OR

The cumulative failure probability and failure probability density are closely related to the product reliability, which determines the distribution type of product life. In the study of motor reliability, different parts have different life distribution types.
Failure rate (λ)
The failure rate λ(t) is the probability of failure of an equipment in the next unit time (0,t) without failure in the time. It can be calculated as:

The relationship among failure rate, reliability, and failure rate distribution can then be calculated:
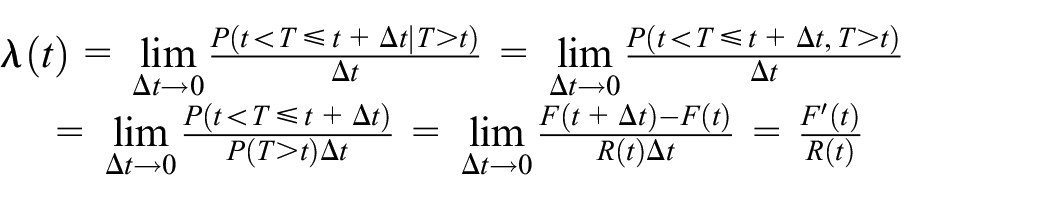
Thus

Integrating the differential equation yields:

According to the change of failure rate, the working process of a product can be divided into early failure, accidental failure, and wear and tear failure periods, the three of which can be mapped into a bathtub curve.
Mean time between failure (MTBF)
The mean time between failure (MTBF) is the expected value of the reliable operation time of the equipment, and can be expressed as:

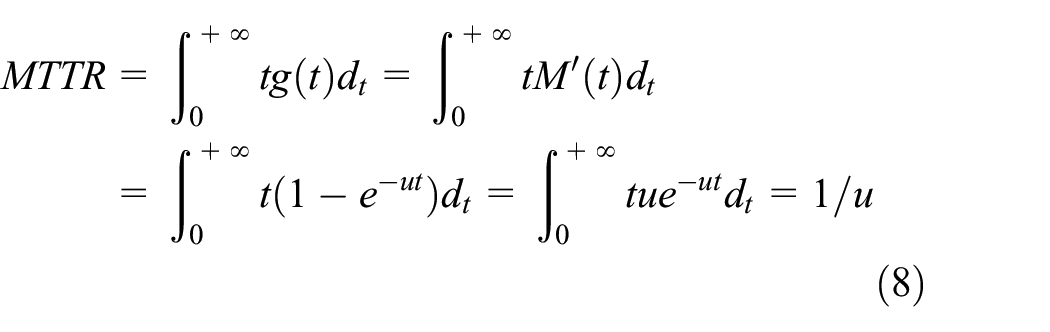
Mean time to repair (MTTR)
The mean time to repair (MTTR) is determined by the repair probability density and as follows:
A motor is a complex electromechanical energy conversion device made of many parts, each with varied failure mechanisms and life cycles, all of which impact the overall motor failure timelines. For example, the shaft, casing, and end cover of the motor are still in the accidental failure period while other parts, such as the winding insulation or bearings, are already in the loss failure period. Accurately studying the reliability of the motor therefore requires separately analyzing the failure of each part and then studying their impact on the overall failure rate of the motor.
Establishment of a reliability model of a motor in a fuzzy environment
For a variety of reasons, data collected under real-world and experimental conditions includes uncertainties, such as randomness, fuzziness, and roughness. These uncertainties may exist in the constraints of the problem and in the objective function to be optimized. As such, practical problems were studied via the traditional deterministic optimization, which contained too much uncertainty.10–13 To more accurately address these uncertainties, researchers have introduced methods of solving practical optimization problems. The theory of uncertainty has been applied to these practical problems more and more, the actual life of the motor is determined by the various components, and the running time of these components cannot be determined completely in advance. In order to study the reliability problems more closely and truly, the uncertainty theory is introduced into these problems to help us study these problems.
Fuzzy definition
As defining motor reliability in an uncertain environment requires functions containing uncertain parameters that are not easily compared, decision criteria must be first set according to the optimization requirements and are discussed in this section.
In fuzzy theory, Pos{A} describes the possibility of event A. Assuming Θ is a non-empty set, p(Θ) then indicates a power set of Θ and is as:
For any collection
Pos is a probability measure and a triple
Thus,
If
If
For any
The credibility of an event is defined as the average of the probability and necessity, and plays an important role in defining expectations. The credibility of event A can be defined as:

Its nature is summarized as follows:
If
Cr is self-dual, that is, for any
Cr is subadditive, that is, for any
Thus, if the probability of a fuzzy event is 1, the event may not be realized. Similarly, when the necessity of the event is 0, the event may be realized. However, if the credibility of the event is 1, then it must occur, and if the credibility is 0, then it does not occur. Thus, credibility, rather than possibility, provides the measure of probability in fuzzy theory and is therefore used to express the chance of fuzzy events.
Fuzzy variable
In the development of fuzzy mathematics, some scholars have given some definitions of fuzzy variables. We use the following definitions of fuzzy variables:
Assuming ξ is a function from the possibility space (Θ, p(Θ), Pos) to the real line ℜ, ξ is a fuzzy variable. Assuming ξ is a fuzzy variable on the possibility space (Θ, p(Θ), Pos), its membership function can be derived from the probability measure Pos and is shown as follows:

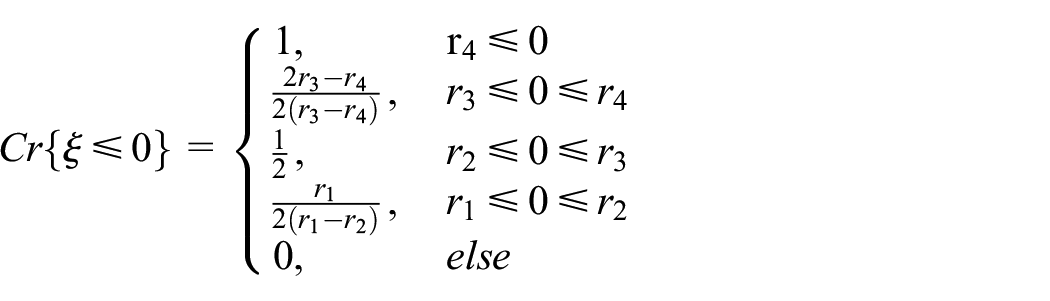
If a quaternion (r1,r2,r3,r4), where r1 < r2 ≤ r3 < r4, is defined as a trapezoidal fuzzy variable, its membership function is shown as follows:

When r2 = r3, trapezoidal fuzzy variables are triangular fuzzy variables. The possibility, necessity, and credibility of trapezoidal fuzzy variables were thus considered according to the definitions of possibility, necessity and credibility, and were shown as follows:


Here, the relevant variables of motor reliability are triangular fuzzy variables. If function
Assuming a triangular fuzzy variable is

Its dependability density function is:

Compared with random variables, different indicators are used to compare fuzzy variables. Optimism and pessimism are good indicators.
Assuming ξ represents a fuzzy variable and

Assuming ξ represents a fuzzy variable and

The expected value of a fuzzy variable can thus be defined as:
Assuming ξ represents a fuzzy variable, its expected value can be found via the following equation if at least one of the integrals is finite.

Therefore, the expected value of the triangular fuzzy variable
If, for two fuzzy variables ξ and η, ξ(θ) > η(θ) for any
If
If
Fuzzy simulation
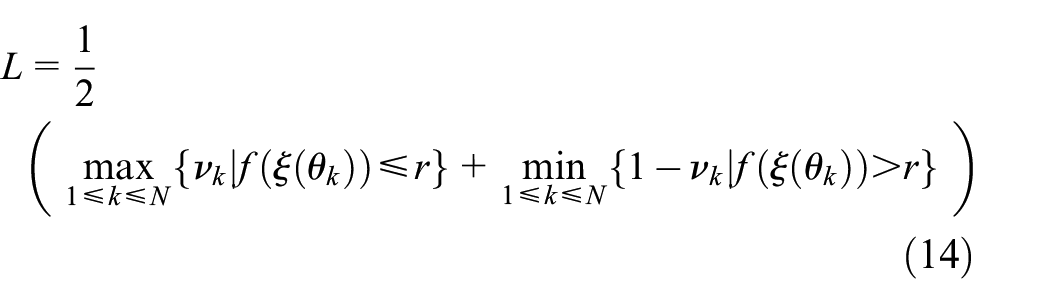
As the probability of occurrence of fuzzy events is more accurately represented by credibility measures, the credibility of fuzzy events calculated by fuzzy simulation is discussed in this section.
Assuming
Fuzzy net
Petri nets are mathematical representations of discrete parallel systems that were first introduced by Carl A. Petri nets developed in 1960 was used to describe asynchronous and concurrent computer system models. Petri nets are known for their strict mathematical expression, intuitive graphical expression, rich system descriptions, and system behavior analysis technology, and have the ability to provide a solid conceptual basis for computer science.14–17 Classical Petri nets are simple process models consisting of place and transition nodes, connections, and tokens, and as shown in Figure 1.
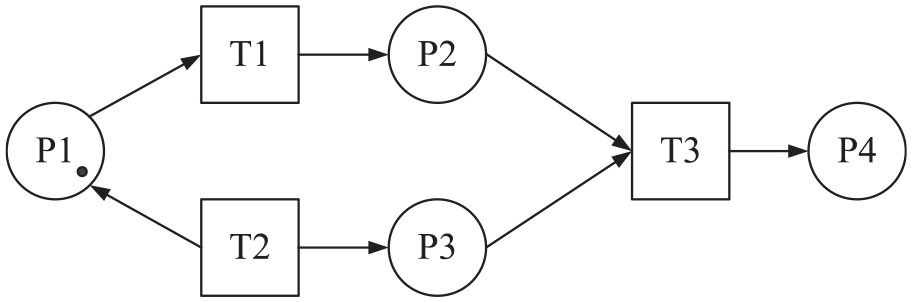
The structure of classical petri nets.
where a circular node represents a place, square nodes represent transitions, a directed arc represents a connection between a place and a transition, and a token is a dynamic object in a place that can be moved from one place to another. Based on the directed bipartite graph of the place and the transition node, the token distribution representing the state information is added, and the event-driven state evolution is made according to the initiation rules, so as to reflect the dynamic operation process of the system.
A six-tuple N = (P, T, I, O, M) is a Petri net if the following conditions are met.
Its element composition diagram is shown in Figure 2.

Element composition of a petri net.
The application of Petri net to analyze system faults is to take the events that the system does not want to happen as the top database, and find out all possible factors leading to this event step by step as the intermediate place and the bottom place. The set of logical relationships can then be expressed by the different connections of the basic elements of Petri net to establish a fault tree model that can then be diagnosed by using graph theory. The top, middle, and bottom events in the fault tree are represented by places, transitions, and connections in the Petri net, and as shown in Figure 3.
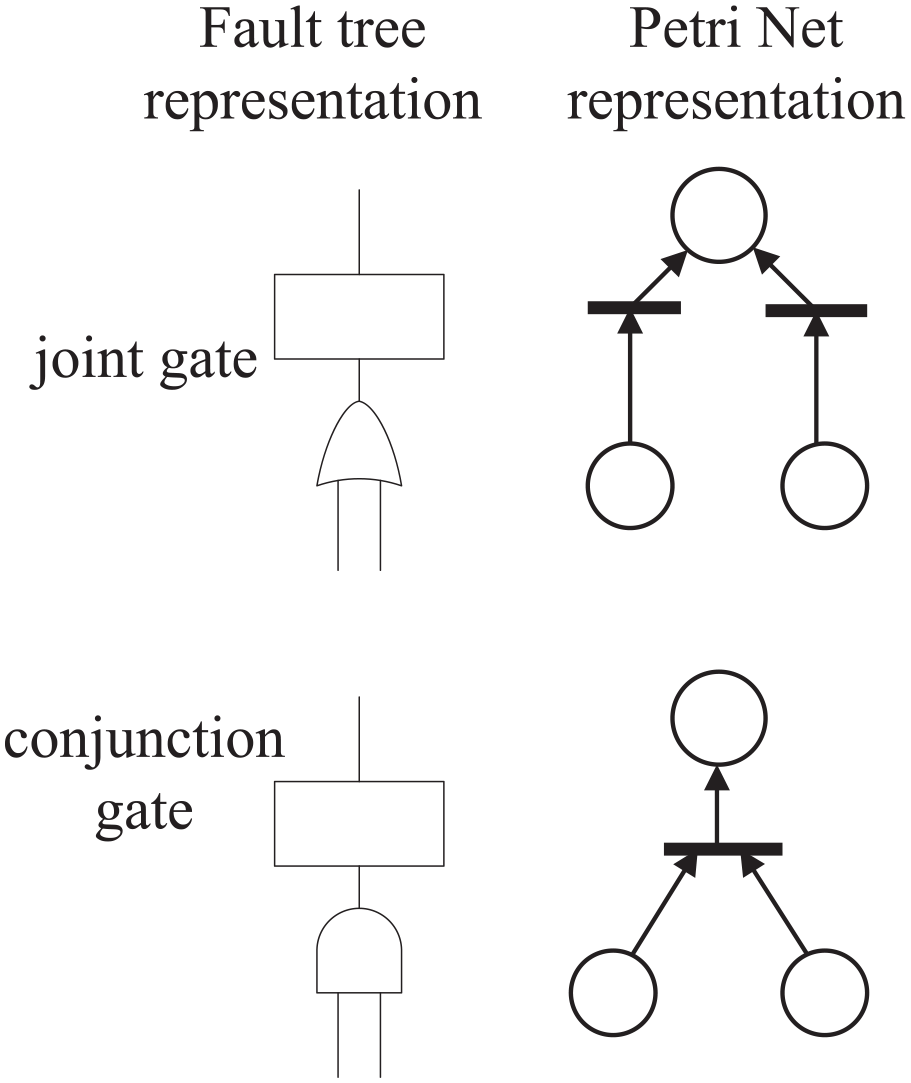
Fault tree logic gate and corresponding petri net model.
Reliability model of motor
The motor of an electric vehicle was shown schematically in Figure 4, which consists of a stator, rotor, and shaft.
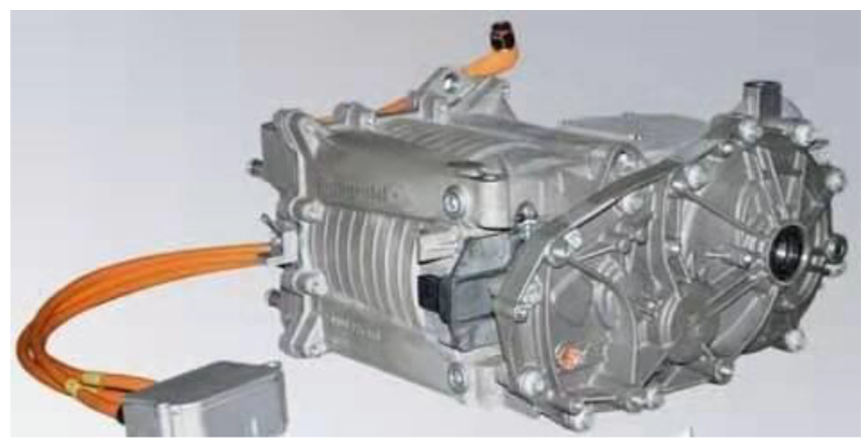
Electric vehicle motor.
Numerical calculation
The failure causes of each part in the reliability prediction of the motor of electric vehicles were listed in Table 1.
Failure analysis of motor.

In the associated sub-project run schedule, as shown in Table 2, the subproject runtime was assumed to be a fuzzy variable and the execution time of each subproject was assumed to be a triangular fuzzy variable, expressed in triples (r1, r2, r3), of which r1 < r2 < r3. Different optimal solutions were obtained by assigning different values to several key parameters of genetic algorithm, thus proving the effectiveness of the algorithm by comparison. In the hybrid intelligent algorithm for the next numerical example, there are several pre-given parameters: population size sizepop, crossover probability
Fuzzy failure life of motor.

As there are seven events at the bottom of the petri net model of the electric vehicle motor, the number of input and hidden layer neurons was set as u = 7 and b = 12, respectively. The value of the given error term was 0.000000004. Based on random simulation, 4000 input and output data points were generated and divided into two groups: 3000 points for training and 1000 points for testing. Note that the number of training data points is set to 4000 for two reasons. First, because there are too few data points, the neural network cannot be fully trained, resulting in inaccurate results. Second, too much data increases the training time and the response time of the solution model, which makes the neural network fitting difficult and affects the work progress. It should be noted that the neural network training data selection should be appropriate, and more data does not necessarily mean the acquisition a higher training accuracy.
In the analysis of fault mode and reliability, the fault mode, influencing factors, causes and harm degree of the motor are analyzed in depth, but there is no clear logic for the motor fault mode. By using the fault tree to analyze the reliability of the motor, we can clearly see the logical relationship between various fault modes and motor faults, and can analyze the probability of faults. The fault tree model, developed according to the components and their logical relationships, is shown in Figure 5.

Fault tree model of electric vehicle.
A permanent magnet synchronous motor (PMSM) is mainly composed of stator, rotor, permanent magnet, shaft, and frame cover. From each part of the motor, the logical relationship between the fault mode of each component and the motor fault is analyzed. Motor fault is the most undesirable fault, so motor fault is the top event, and the fault mode of each component is the bottom event.18–20 In this work, the causes of various faults are analyzed and a fault tree of a PMSM for an electric vehicle driving motor is established according to the classification of motor faults for electric vehicles in the national standard named “Classification and Judgment of Drive Motor System Faults for Electric Vehicle” and is as shown in the following figure.
Combined with the Petri net concept, the Petri model of the electric vehicle motor is shown in Figure 6.

Petri net model.
The minimum expected time model can then be established:

Motor reliability model
A BP neural network optimization algorithm based on a genetic algorithm was then used to solve the developed reliability statement of an electric vehicle motor.
Algorithm flow
A genetic algorithm was used to optimize the BP neural network algorithm flow, which was as shown in Figure 7:

Optimization of BP neural network process by GA.
The optimization of the BP neural network can be divided into three parts: The determination of the neural network structure, the optimization of the genetic algorithm, and the prediction of the BP neural network. The BP neural network structure is determined according to the number of input and output parameters of the fitting function, which then is used to determine the individual length of the genetic algorithm.21,22 The genetic algorithm then is used to optimize the weights and thresholds of the BP neural network. Each individual in the population contains a network ownership value and threshold, and has a fitness value, which is calculated by a fitness function. The genetic algorithm is used to find the optimal individual fitness through selection, crossover, and mutation. The prediction of BP neural network is to use the genetic algorithm to get the initial weight and threshold value assigned by the optimal individual to the network, and the network is trained to predict the output of the function.
The developed model requires seven input parameters and delivers two output parameters, so the BP neural network structure is 7−12−2, that is, to say that there are two nodes in the input layer, 12 nodes in the hidden layer and 2 nodes in the output layer, there are
BP neural network
A BP network is a multi-layer feedforward neural network that uses a backpropagation error learning algorithm. BP algorithm is Rumelhart because of its simple structure, adjustable parameters, training algorithms, and good operability, and have thus been widely used.23,24 According to statistics, 80%–90% of the neural network models are using BP network or its deformation, making it the most widely used algorithm in artificial neural network design. BP network is the core of forward network and the most essential and perfect part of neural network. Although BP neural network is the most widely used algorithm in artificial neural network, it also has some defects, such as slow learning convergence speed, hindering convergence to the global minimum, and a complex network structure that is, difficult to determine.
A BP neural network is used to first determine the number of neurons in the input, hidden, and output layers, which are expressed as follows:
The number of input-layer neurons of a neural network is based on the number of bits at the bottom of the Petri model, that is the number of basic events in the fault tree model. Thus, the number of input neurons can be represented by a life distribution function of all components of the system that can cause system failures.
The number of output neurons is 1:1 of the system lifetime function. In the aspect of neural network structure, the main problem is to determine the optimal number of hidden layer neurons. Although the number of hidden layers can theoretically be infinite, too many increase the required training and response time, whereas too few make the neural network lack generalization. It can generally be represented by
The back propagation method is then used to calculate the weights and bias conditions of the neural network model. In this method, all weights are adjusted according to the error terms calculated by using the gradient method. In the learning of the neural network, that is, the calculation of the weights of the connections, the errors between the output of several available training data points and the actual output are minimized. Here, the error term was controlled by the MATLAB function named net.trainParam.goal, which represents the square of the error between the output of the averaged neural network and the actual output of the available training data points.
BP neural networks are more mature than earlier neural network in both theory and performance and have the advantages of clear thinking, rigorous structure, and strong operability. The most outstanding is BP neural network has strong nonlinear mapping ability and flexible network structure.25,26 However, because the core of BP learning algorithm is the optimal gradient descent method, which is mainly used to guide the adjustment direction of network connection weight and threshold, BP neural network inevitably has the following defects:
The convergence rate of network learning is too slow. Because the learning complexity of BP algorithm is an exponential function of the sample size, if the network size is large or the number of learning samples is large, it often takes a long time to learn, or even the learning cannot be completed. Even a relatively simple problem requires hundreds or even thousands of studies to converge. The main reason is that the learning rate of the network is too small, which can be improved by changing the learning rate or adaptive learning rate
It is easy to fall into the local minimum problem. BP algorithm is a nonlinear optimization problem based on stochastic gradient descent method. It inevitably has local minimum problem and often gets local minimum point. This is because when the gradient descent method is used to train the network, the minimum value of the error is gradually reached along the slope of the error function from a certain starting point, but in fact, the local optimum is usually obtained
The network structure is difficult to determine. It is very difficult to select the number of layers and hidden nodes in the hidden layer of the network, and there is no theoretical basis so far. How many hidden nodes are chosen will affect the performance of the network, usually according to the network environment and experience or experiment in the learning process of the network, so the network has a great deal of redundancy.
The learning and memory of the network are unstable. A well-trained network, on the basis of the original to provide it with a new model, will make the original connection right all disrupted, and it must be retrained to continue to use the network, which undoubtedly increases the difficulty of network learning.
In addition, the selection of network structure, initial connection weights and threshold has great influence on the network training, but it cannot be accurately obtained. In view of these characteristics, a genetic algorithm can be used to optimize the neural network.
Genetic algorithm
A genetic algorithm is an evolutionary algorithm, the basic principle of which is to imitate the evolutionary theory of natural selection. Genetic algorithm is to encode the problem parameters as chromosomes, and then exchange the information of chromosomes in the population with the iterative crossover and mutation operations, and finally generate the chromosomes in line with the optimization goal.27–29 The simple genetic algorithm was proposed by Professor J. Holland of Michigan University in 1962 and published in the influential monograph named “Adaptation in Natural and Artificial Systems.” In optimization problems, if the objective function is multi-peak or the search space is irregular, it is likely that the algorithm will wander in the local optimal solution, and the advantage of genetic algorithm is just good at global search, and the analysis of mathematical problems does not need very deep, beginners will be very convenient to use.
In a genetic algorithm, chromosomes correspond to data or arrays, which are usually represented by one-dimensional string structure data. A genetic algorithm follows a basic procedure, in which N initial chromosomes are first randomly generated to form a population. Then an evaluation function is used for evaluating the quality of each chromosome to get the adaptability of chromosomes to the environment, which is called adaptability.30,31 A selection process is then carried out to select the best chromosomes from the current chromosomes to make them into a new generation of chromosomes. The better the fitness, the greater the chance of being selected. Generally, we choose chromosomes in a way similar to rotating roulette wheel in the selection process. After a new population is obtained through the selection process, we perform crossover and mutation operations. The purpose of crossover is to dig out the diversity of individuals in the population and prevent the genetic algorithm from falling into the “trap” of local optimal solution. Through these operations, we can get a new generation of chromosomes, a new population, which we call progeny. Next, we repeat the selection, crossover and mutation operations on the offspring. After a certain number of iterations, the best chromosomes obtained in the above steps are used as the optimal solution of the optimization problem. Through the above steps, it is not difficult to find that genetic algorithm has many advantages over traditional algorithms. For example, each generation of genetic algorithm studies the population of more than one point, while the traditional algorithm usually studies a single point at a time, which makes the genetic algorithm have more application scope than the traditional algorithm. The running process of genetic algorithm is time-consuming, and sometimes it is not suitable for the system that needs immediate feedback. In addition, the solution obtained by genetic algorithm has nothing to do with the selection of initial point, so it is more suitable to solve the problem of irregular space and multi-peak optimization, and is not easy to fall into the “trap” of local optimal solution. Of course, genetic algorithm has more advantages in computer applications, and is suitable for parallel computing.
Genetic algorithm has shown a very broad application prospect in solving global optimization problems, and has been successfully applied to practical problems such as optimal control, transportation problems, traveling salesman problems, mapping, equipment location, statistics, pattern recognition, vehicle scheduling, and network optimization.
Through the above analysis, the BP neural network optimized by genetic algorithm uses a genetic algorithm to optimize the initial weight and threshold of the BP neural network, so that the optimized BP neural network can better predict the function output. The elements of BP neural network optimized by genetic algorithm include population initialization, fitness function, selection operation, crossover operation, and mutation operation.
Population initialization
Each individual is a real string composed of four parts: the connection weight between the input layer and the hidden layer, the threshold value of the hidden layer, the connection weight between the hidden layer and the output layer, and the threshold value of the output layer. An individual contains all the weights and thresholds of the neural network. If the structure of the network is known, it can form a neural network whose structure, weights, and thresholds are determined.
In this paper, the individual coding length is:
Fitness function
According to the initial weights and thresholds of the BP neural network obtained by the individual, the output of the prediction system is trained with the training data. The individual fitness value F is calculated as the E of the absolute value of the error between the prediction output and the expected output:
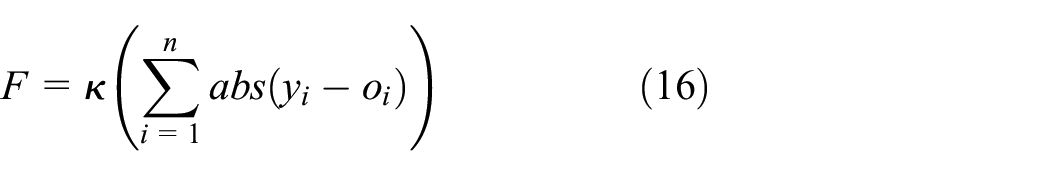
where n is the number of output nodes of the network, yi is the expected output of the i-th node of BP neural network, oi is the predicted output of the i-th node, and κ is the coefficient.
Selection process
Chromosomes were selected by rotating sizepop times to construct a new generation of chromosomes to update the chromosomes. First, the cumulative probability qi was calculated for each chromosome

A random number s was then generated in the interval (0,sizepop
Crossover operation
The parent chromosomes were then selected by first randomly generating a number v from


If the above two progeny chromosomes are feasible, they can then replace the two parent chromosomes. If one of the offspring chromosomes is feasible, the viable is retained, and the crossover operation is repeated to get another viable chromosome. Otherwise, crossover is repeated until two viable offspring chromosomes are generated.
Mutation operation
A parameter
For a chromosome

where di is randomly generated in intervals of
Hybrid intelligent algorithm
A hybrid intelligent algorithm was then developed to solve reliability problems. The steps are as follows:
Results of training the BP neural network
The developed stochastic algorithm based on a neural network was then implemented based on the established fault tree and corresponding petri net model. The resulting average life of the electric vehicle motor, E(x), was 8895.5 h.
The errors between the predicted output and the desired output of the BP neural network are shown in Figures 8 and 9.

Predictive output of BP network.
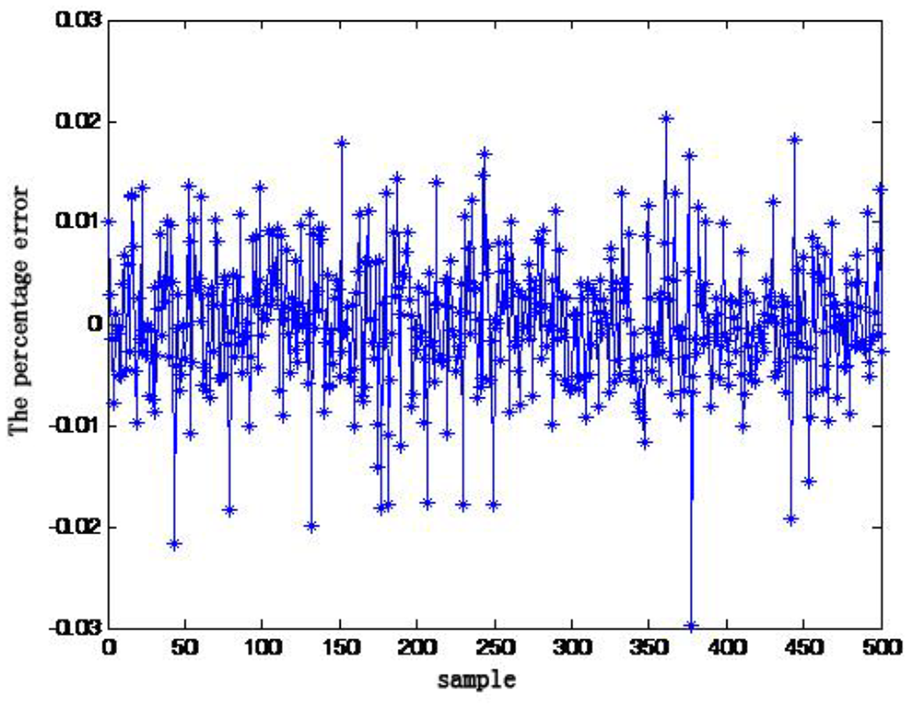
The percentage error of neural net prediction.
Analysis of BP neural network optimized by genetic algorithm
The MATLAB software was used to establish the neural network model and input the corresponding training data, the training process was as shown in Figure 10.
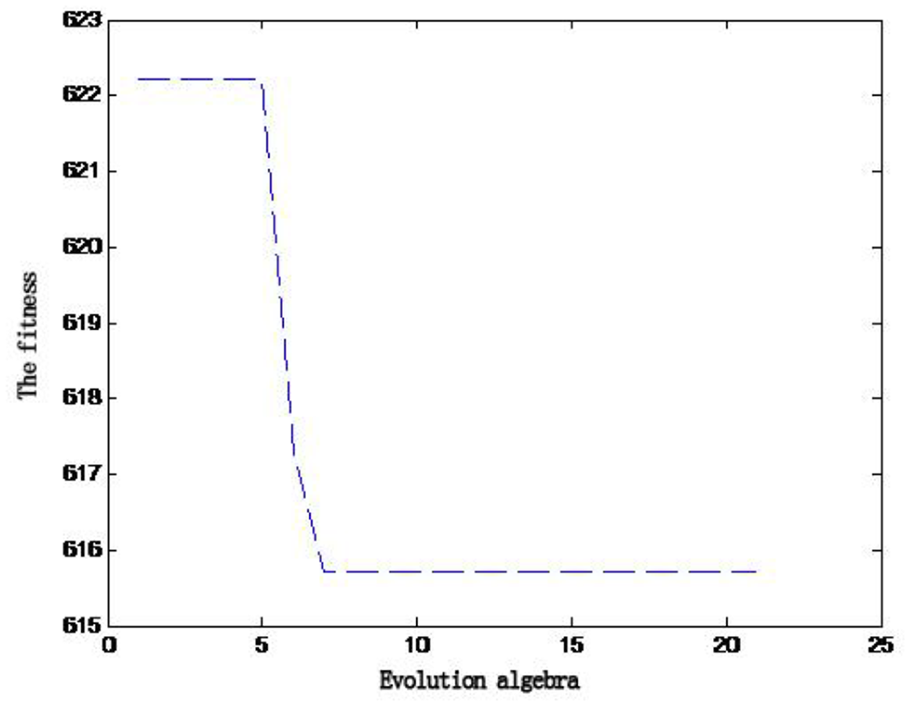
The fitness curve.
The optimal weights and thresholds of BP neural network optimized by genetic algorithm were then assigned to the neural network. The life of the motor was predicted training the network 100 times with the training data. The prediction error was shown in Figure 11.
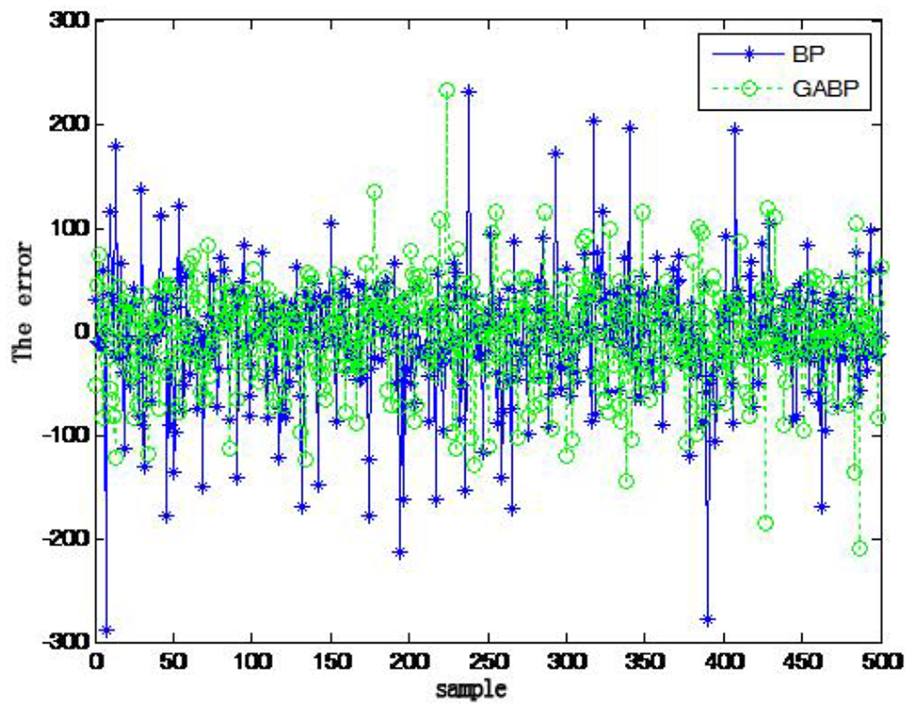
Prediction error of BP network optimized by GA.
It can be seen from the Figure 11 that the prediction error of BP neural network optimized by genetic algorithm was more accurate, and the mean square error of prediction of BP network optimized by genetic algorithm is
An ambiguous event whose probability is 1 may not be realized, and an ambiguous event whose necessity is 0 may be realized. If a fuzzy event has a credibility of 1, it must be implemented. If the trustworthiness of a fuzzy event is 0, it must not be implemented. Therefore, the role of the credibility of fuzzy events in fuzzy theory is equivalent to the role of probability in probability theory, and it is more scientific and realistic to use credibility measure to measure the probability of fuzzy event than possibility measure. The reliability results of electric vehicle motors are discussed in the next section.
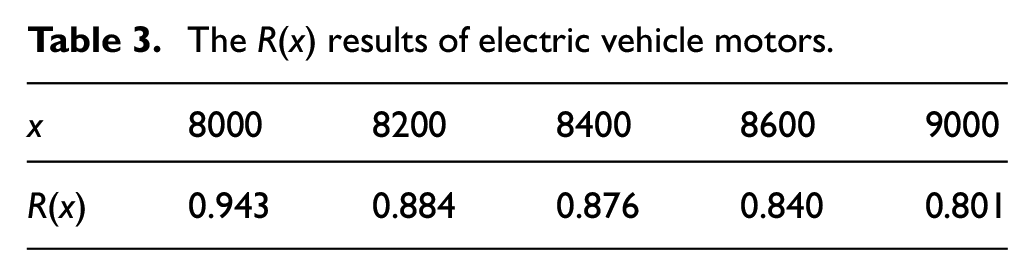
Resulting reliability R(x) model of electric vehicle motors
As shown in Table 3, it indicate, for example, the probability that the motor will not fail for 8200 h of safe operation is 0.884.
The R(x) results of electric vehicle motors.
Conclusion
The reliability of motor operation is the key factor for the safe operation of electric vehicles. In order to dynamically describe the reliability elements and fault tree modeling process, in this paper, based on the concept of fault tree and Petri net, a reliability model of electric vehicle motor was firstly established by combining the definition and transformation rules of fault tree elements, which could provide a new method for reliability analysis of mechanical system. A hybrid intelligent algorithm was designed by combining a genetic algorithm with neural network to create a genetic-algorithm-optimized neural network simulation. Finally, the hybrid intelligent algorithm is applied to the reliability calculation of an electric vehicle motor, and the feasibility of the proposed method is verified. In conclusion, the research work in this paper is of positive significance to improve the development and design decision-making process of electric vehicle motors in the future.
Footnotes
Handling Editor: Chenhui Liang
Declaration of conflicting interests
The author(s) declared no potential conflicts of interest with respect to the research, authorship, and/or publication of this article.
Funding
The author(s) disclosed receipt of the following financial support for the research, authorship, and/or publication of this article: The authors would like to thank University-level scientific research fund projects of ShanDong JiaoTong University (Nos. Z201636), the National Natural Science Foundation of China (Nos. 61803231) and Shandong Provincial Higher School Youth Innovation Technology Project of China (Nos. 2020KJB002) for the financial support of this research.