
Abstract
Rectifier transformers are key components of high-frequency power supplies; their waveforms play an important role in diagnosing faults of high-frequency power supplies. Typically, the integral value of the current waveform is analyzed to diagnose rectifier transformer faults. However, the waveforms of currents are greatly influenced by the load, which results in serious fault-coupling problems. Generally, conventional methods cannot accurately locate faults, and they have high error rates. In this study, primary and secondary waveform currents were analyzed to extract fault feature data. The extracted data were used to train least-square support vector machines to build fault classifiers, thus realizing the fault detection and isolating the rectifier transformer. The proposed method was applied to actual waveform data from the Baosteel power plant; it performed satisfactorily.
Introduction
In the electric power, metallurgy, petroleum, chemical, cement, and other industries, high-frequency power supplies are widely used for electro-static precipitators (ESPs) to improve dust removal efficiency. 1 The high-frequency power supply rectifies the three-phase industrial frequency input power into direct current, which is then converted by the inverter circuit into high-frequency alternating current at frequencies over 10 kHz. After the high-frequency transformer boosts the voltage and the output rectifier completes filtration, a high-frequency ripple current is supplied to the ESPs.
A high-frequency power supply consists of an input filtering rectifier, an inverter circuit, a high-frequency transformer, and a high-voltage rectifier circuit. As the key component, the high-frequency transformer’s performance directly affects the performance of the entire power system. Figure 1 illustrates the basic structure of a high-frequency power supply.
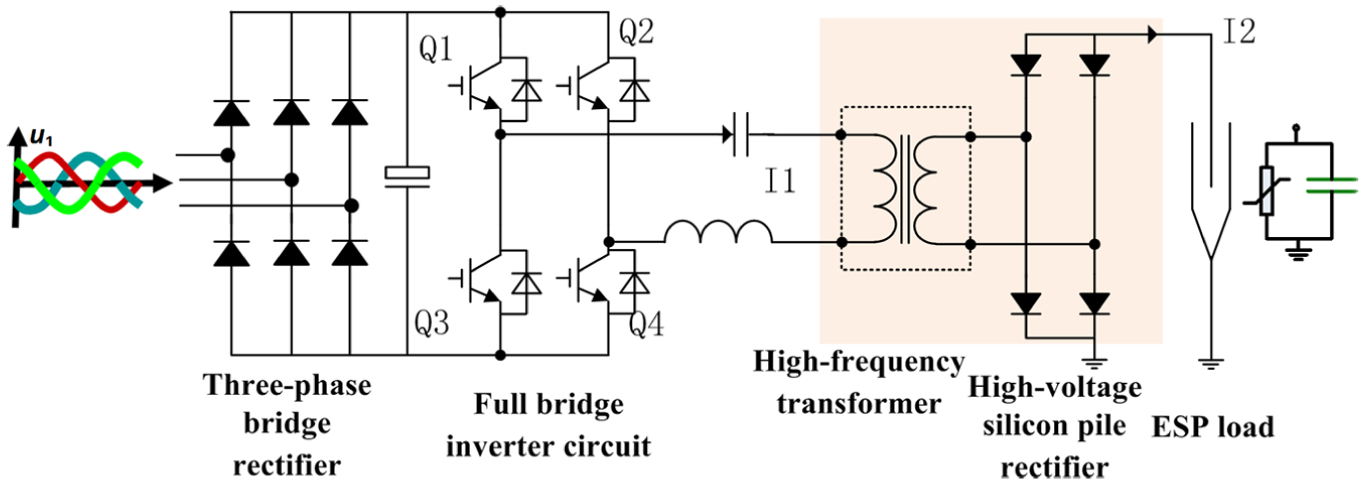
Basic structure of a high-frequency power supply.
High-frequency transformers are usually oil-immersed. Since the transformer and output rectifier are placed in the same immersion tank, the gas dissolved in oil cannot be measured in real time. Consequently, the International Electrotechnical Commission (IEC) 60599 three-ratio approach,2,3 which requires exact information about the dissolved gas and is the classical method for traditional transformer diagnosis, is not suitable for diagnosing this device. An alternative approach is thus required.
A natural way of solving this problem is to diagnose the faults with waveform analysis. In engineering applications, the waveform integral values of the transformer’s primary current and secondary current are usually employed to diagnose rectifier transformer faults.4–6 However, this indicator does not supply enough information to describe coupling faults, and it often results in poor diagnostics. To improve the diagnosing performance of high-frequency power supplies,7–10 a more effective way of extracting valid fault features is required.
In this article, an advanced approach is proposed to diagnose the faults for the rectifier transformers of high-frequency power supplies. It first extracts fault features from the system’s primary and secondary currents with a specifically designed feature extraction method, and then, it constructs least-square support vector machine (LS-SVM) classifiers using featured samples from different operating statuses. These classifiers are used to detect and locate rectifier transformer faults. Given a testing sample, these LS-SVM classifiers can identify which type the sample belongs to, and thus, the operating status of the system can be judged.
The major contributions of this article are as follows:
An improvement of diagnostic accuracy. As nonlinear classifiers are implemented in the diagnosis, some coupling cases that cannot be correctly diagnosed by the traditional integral value approach can be diagnosed correctly with the proposed approach.
A specifically designed method for extracting features from current waveforms. Compared with a formal integral value-based method, the proposed method offers much more information for diagnosis. Compared with a general feature-extracting method such as wavelet packet decomposition (WPD) and maximum correlated Kurtosis deconvolution (MCKD), the proposed method is more easily achieved and requires less computational overhead.
Description of problem
Overheating or discharge can cause insulating oil to produce different components of gas. Traditionally, faults of transformers can be diagnosed with dissolved gas analysis (DGA), like the three-ratio approach which was proposed by IEC in 1978 and revised in 2008. 2 But for high-frequency power supplies, since the transformer and output rectifier are placed in the same immersion tank, the DGA approaches are not suitable. There are two reasons. The first one is that overheating or discharge from different devices such as transformers or rectifiers may produce the same gas components. The second one is that the dissolved gas cannot be measured in real time.
Thus, in engineering applications, primary and secondary waveform currents of the system are monitored to analyze the rectifier transformer’s status. As shown in Figure 2, during normal operations, adjacent waveforms of the primary current are equal in magnitude and opposite in direction, whereas those of the secondary current are of the same magnitude and direction. Therefore, two adjacent waveforms’ integral values should have the same absolute value.

Normal waveform.
When a system component fails, the waveforms of the primary and the secondary currents are distorted. Adjacent waveforms are no longer strictly consistent. When two waveforms are not the same, their absolute integral values will be different in most cases. Therefore, the absolute integral values are usually applied to determine the existence of a system fault.
Given


where
First, equal absolute integral values of two adjacent waveforms do not necessarily indicate distortion non-occurrence. In the case shown in Figure 3(a), a significant distortion occurred to the primary current, but the absolute integral values of the two adjacent waveforms remained the same. In this case, the distortion cannot be detected.
Second, a variation of absolute integral values of adjacent waveforms does not necessarily indicate component faults. Waveforms are significantly affected by the load, and load faults would cause secondary current distortion. In Figure 3(b), the rectifier transformer is detected faulty in a system running with an abnormal load and normal components when using only absolute integral value for analysis.
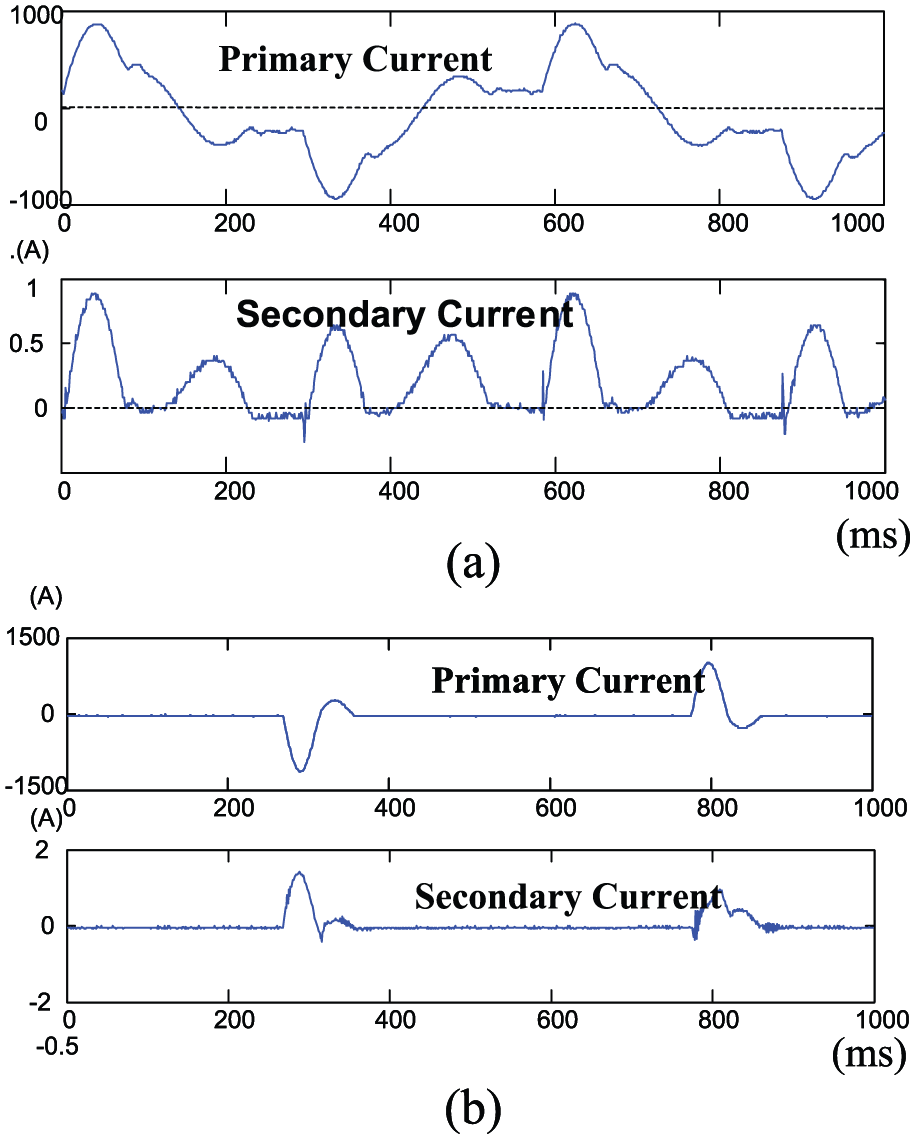
Common misjudgments with conventional methods: (a) rectifier bridge damage and (b) normal waveforms with abnormal load.
Comprehensively and scientifically analyzing current waveforms to extract waveform features that contain complete information makes it possible to accurately diagnose rectifier transformer component faults.
Although few works in the literature address this problem specifically, waveform analysis approaches used in fields such as switch power supply fault diagnosis and rotating machine fault diagnosis can be used for reference. In these fields, general feature-extracting methods like WPD 11 and MCKD 12 are commonly used.
These methods provide a general way of extracting informative features, and offer sufficient information for diagnosis. However, they usually require intensive computation and generate non-intuitive features.
Thus, a more intuitive method of feature extraction was proposed specifically for the diagnostic problem of the system described in this article.
Extraction of current waveform features
This approach takes the view that some time-domain characteristic variables, like the amplitude ratio of adjacent waveforms, 13 cycle time, before/after zero point time ratio, 14 absolute integral value ratio of adjacent waveforms, 6 and waveform complexity, 15 should be extracted to enable accurate, efficient descriptions of current waveforms.
Let
Physical illustrations are be given in section “Physical illustrations for the features.” And the calculations of these features are given as follows


here,

Thus, we have

The crossing zero point time for the second cycle of primary current can be calculated as

and the “Before/after zero point time ratio” for the second cycle of primary current is obtained as

Similarly, the sixth and seventh features can be obtained as follows
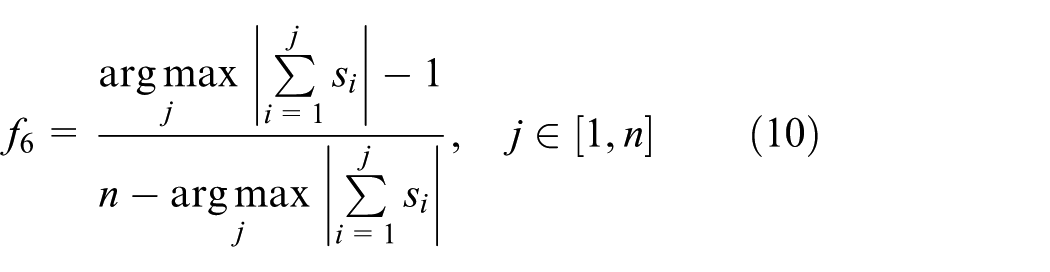
The two features

Physical illustrations for the features
Here, we provide some physical illustrations of our proposed current features. With these features, we can sufficiently describe current waveforms for diagnosing, while avoiding the large computational load for figure analysis.
Referring to Figure 4(a), let the amplitudes of two adjacent waveforms be

Illustrations of a few waveform features: (a) amplitude ratio and cycle time and (b) before/after zero point time ratio.
Cycle time. It is consistent for the same current signal regardless of whether the system is experiencing a component fault. But for different operating statuses, the cycle time
Before/after zero point time ratio. Assuming a waveform passes the zero point, as shown in Figure 4(b), then

where

Illustration of before/after zero point time ratio: (a) T1/T2 > 1 and (b) T1/T2 < 1.
Absolute integral value ratio of adjacent waveforms. This feature is a classic comprehensive indicator that helps identify most waveform distortions. In practical engineering, the feasibility of using this feature in fault diagnosis has been proven.
Waveform complexity. A complex waveform may have the same absolute integral value, amplitude, and cycle period as a simple waveform. Thus, the complexity of a waveform should be considered an important feature. 15 In this study, angle deviations between adjacent samples, as shown in Figure 6, are employed to measure the waveform complexity.
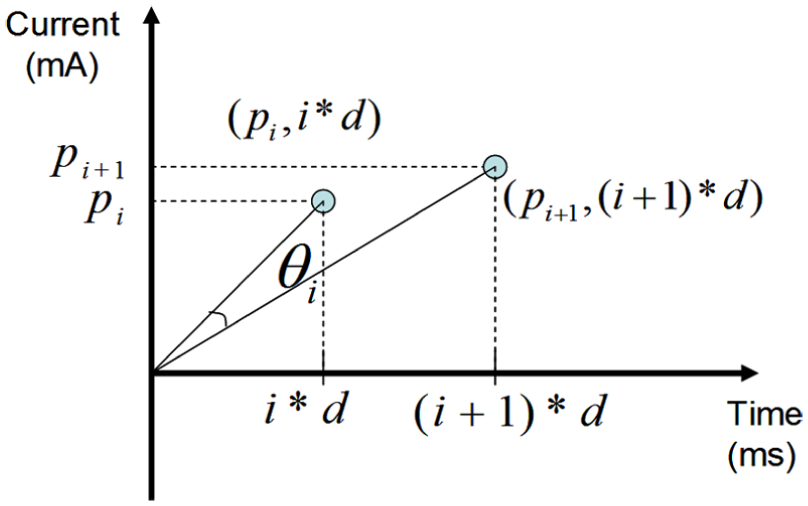
Waveform complexity calculation.
For instance, taking the primary current waveform
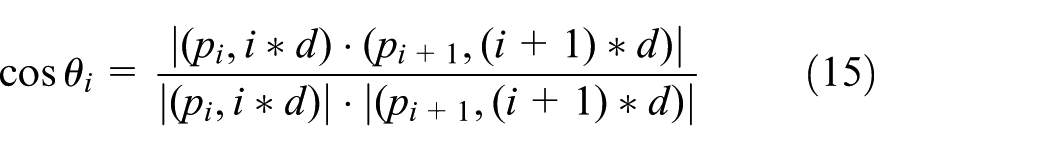
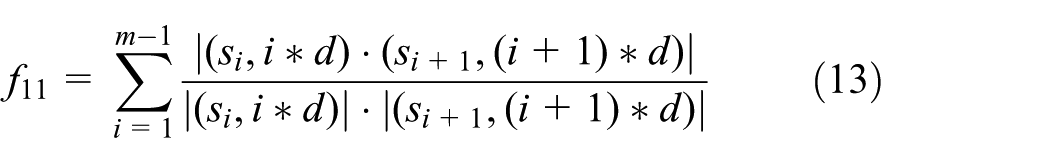
Then, the sum of all involved cosine values is used to indicate the waveform complexity. And we have

The
Fault detection and location for rectifier transformer of high-frequency power supplies
In this study, waveform samples were collected at different system operation states, including normal working conditions (T), working with a damaged rectifier bridge (F1), and working with a damaged rectifier bridge and transformer (F2). Both primary and secondary currents were sampled. The feature data of each sample were obtained via the feature extraction method mentioned above. The collected data were normalized to eliminate the influence of dimension on the diagnosis; Figure 7 illustrates this process. Multi-class SVM classifiers were then trained using the processed data.15,16 When a new sample was used, the classifiers automatically identified the class the sample most likely belonged to, thus diagnosing the fault.

Fault detection and location process for rectifier transformer of high-efficiency power supplies.
For fault classifier construction, multi-class expansion was done to the LS-SVM through the classic 1-v-1 method. Three classifiers were constructed to differentiate F1 from T, F2 from T, and F1 from F2. Each test sample was input to all three classifiers, whose decisions were combined to diagnose via voting.
Validation experiments
Experiment data and parameters
The experimental data were obtained from the high-frequency power supply adjustment tests of the Baosteel Power Plant. The data consisted of 24 waveform samples of three types: normal working samples (including two abnormal load samples), damaged rectifier with normal transformer samples, and damaged rectifier and transformer samples. Cases where the transformer was damaged but the rectifier was not damaged were not considered because transformer damage is usually accompanied by rectifier bridge damage. Four samples were used for testing, and the rest were used to train the fault classifiers. In each sample, two cycles of both primary and secondary current waveforms were investigated.
To train the LS-SVM classifier, the radial basis function (RBF) kernel, which is typical for most applications,
17
was used with parameter settings of
Experimental results
The fault classifiers were constructed by combining LS-SVM and 1-v-1 multi-class expansion. In the experiments, primary component analysis (PCA) was performed to reduce the dimension of the feature data. Figure 8 shows the fault clustering. As can be seen, the three sample types clearly fell in separate areas, indicating the classifiers’ effectively isolated faults.
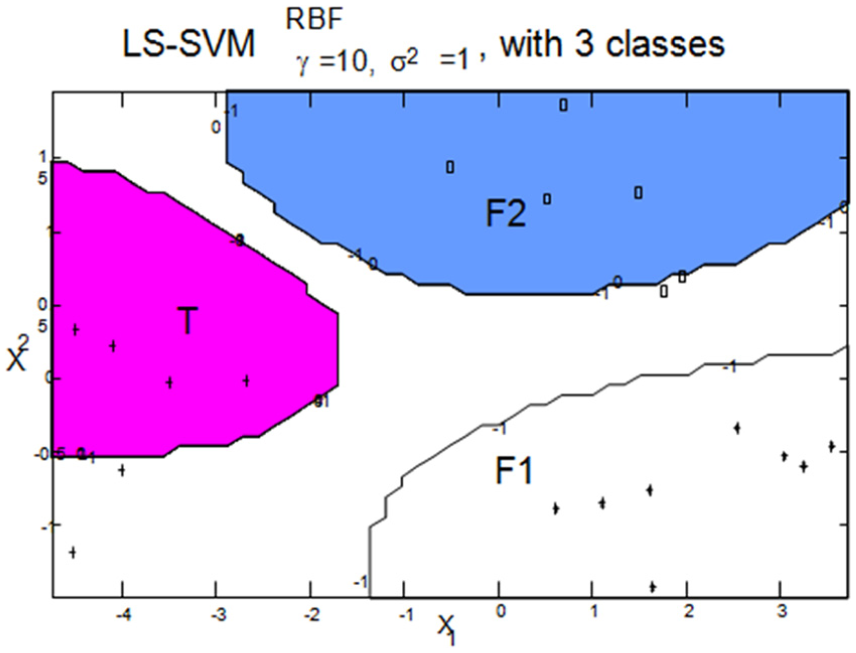
Visualization of fault clustering.
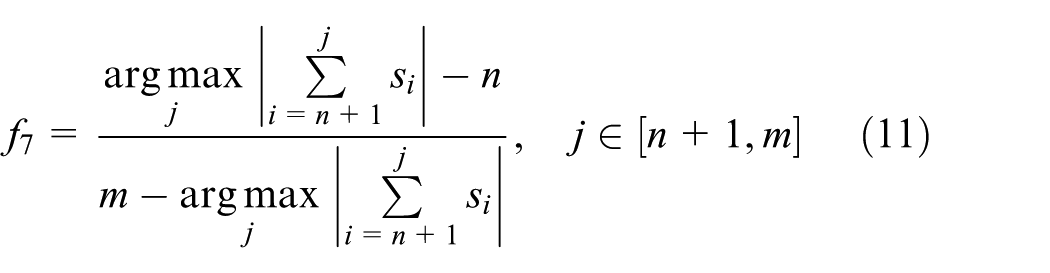
The four groups of waveforms shown in Figure 9 were used to test the classifiers. A comparison was done between the diagnosis of the conventional absolute integral value method and the proposed method.

Waveform sampling: (a) normal waveform, (b) normal waveform (with abnormal load), (c) damaged rectifier bridge with a normal transformer, and (d) damaged rectifier bridge and transformer.
As seen in Table 1, the conventional absolute integral value method is not effective at fault isolation. With waveforms similar to that in Figure 9(c), the fault can be detected but not accurately located. Meanwhile, the method has a strong coupling effect. As seen in Figure 9(d), there is an apparent distortion of the primary current, but the absolute integral value does not reflect this change, leading to misclassification. The feature extraction method proposed in this article avoids these problems. The trained classifiers effectively diagnosed faults. For the test samples, the diagnostic accuracy was significantly higher than that of the conventional method.
Diagnosing performance comparison.

Further comparisons
Additionally, two popular feature-extracting methods for analog circuit16,18 or rotating machine11,12 fault diagnosis, namely, WPD11,16 and MCKD, 12 were introduced in this article to construct feature sets and build the diagnosing classifiers. The performances of both the proposed method and these two methods were investigated with the aim of providing a more comprehensive comparison.
Comparison with the WPD method
Given an original signal

Wavelet packet decomposition of original signal X with hierarchical structures.
For a

here,


where
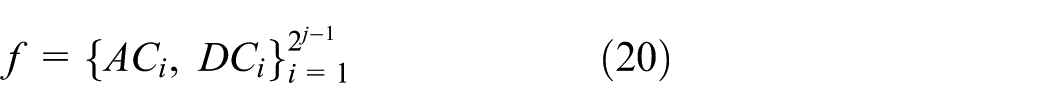
For the discussed diagnosing problems, where the primary and secondary current waveforms were monitored, formulas (18)–(20) are used to generate the diagnosing feature sets for the two waveforms. When the diagnosing feature set for primary current

Taking Figure 9(a) as an example, the primary and secondary currents can be, respectively, decomposed as Figure 11(a) and (b) using Haar-based WPD with a level of 2.

WPD for Figure 9(a) (wavelet basis: Haar; level: 2): (a) WPD for the primary currents in Figure 9(a) and (b) WPD for the secondary currents in Figure 9(a).
According to formulas (17)–(21), the feature sample for currents in Figure 9(a) can be generated as (0.4529, 0.0578, 0.0433, 0.0459, 4.0400, 0.2440, 0.1235, 0.0375). Similarly, all currents can be transferred into feature samples in such a way.
Remark 1
The dimension number of the feature samples equals
The optimal wavelet basis and decomposing levels are of great importance to WPD performance. In Figure 11, the two parameters were randomly selected. To give a fair comparison, grid search was implemented to find the optimal parameters in this comparison, as shown in Figure 12. WPD with db3 wavelet basis and a decomposing level of 3 was employed to extract features for the following LS-SVM based fault diagnosis.

Grid search for optimal WPD settings.
Whereas the two approaches could both accurately diagnose the testing samples (both achieved 100%), their computing performances were different; these were investigated and are shown in Table 2.
Comparisons of computing performance.
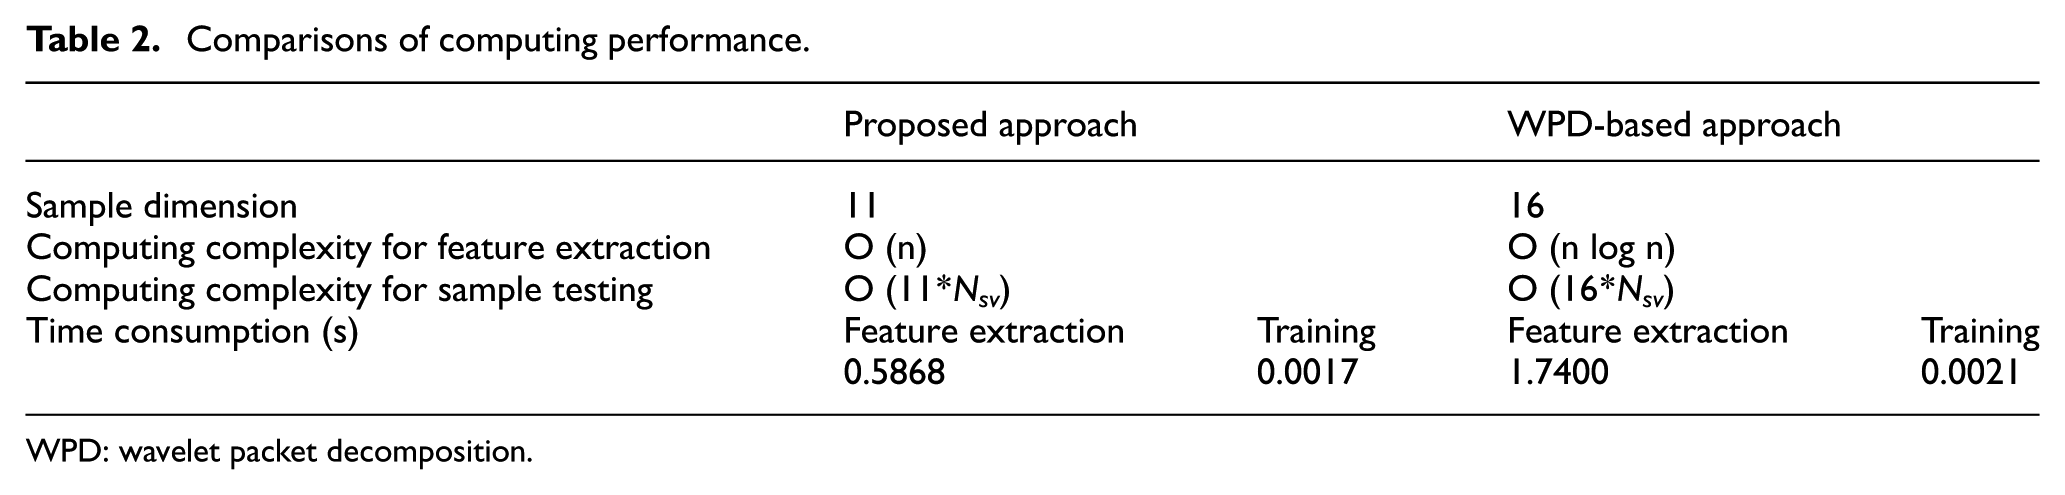
WPD: wavelet packet decomposition.
In Table 2,
Compared with the WPD-based approach, the proposed approach yields smaller sample sizes and much less computing complexity for feature extraction. Consequently, it spends less than 0.6 s in constructing fault classifiers, while the WPD-based approach consumes almost 1.75 s. It shows better computing performance.
The cases shown in Figure 5 are also discussed for comparison. Functions (22) and (23) were given to describe waveforms in Figure 5(a) and (b), respectively
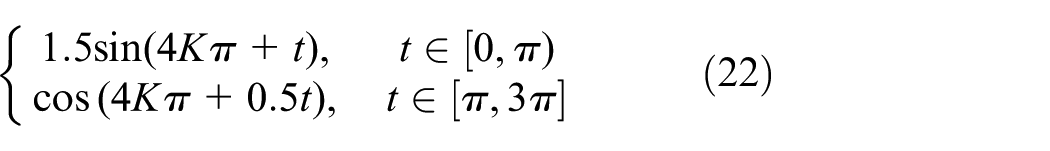
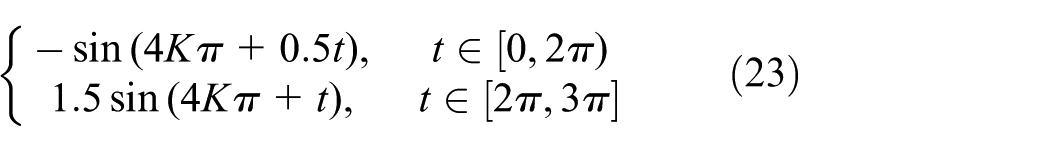
where
The proposed approach offered different before/after zero point time ratios (i.e. features 4–7) for the two simulated cases. But the WPD approach extracted the same “energy” at each node for the two cases, as shown in Figure 13. They yield the same feature sample (2.9335 0.2937 0.1465 0.0098). Thus, the proposed approach is superior to the classical WPD approach in identifying the cases shown in Figure 5.

WPD for Figure 5(a) and (b) with level of 2.
Comparison with MCKD method
As the WPD approach is a baseline of general feature extraction, an advanced approach, namely, MCKD, was also implemented to give a more objective comparison. This approach can extract fault features from waveforms and is often used in fault diagnosis for rotating machines like bearings and gearboxes. 12
Given an original signal

where
In the comparison, the parameters of MCKD were optimized with grid search and set as
Comparison with MCKD-based approach.
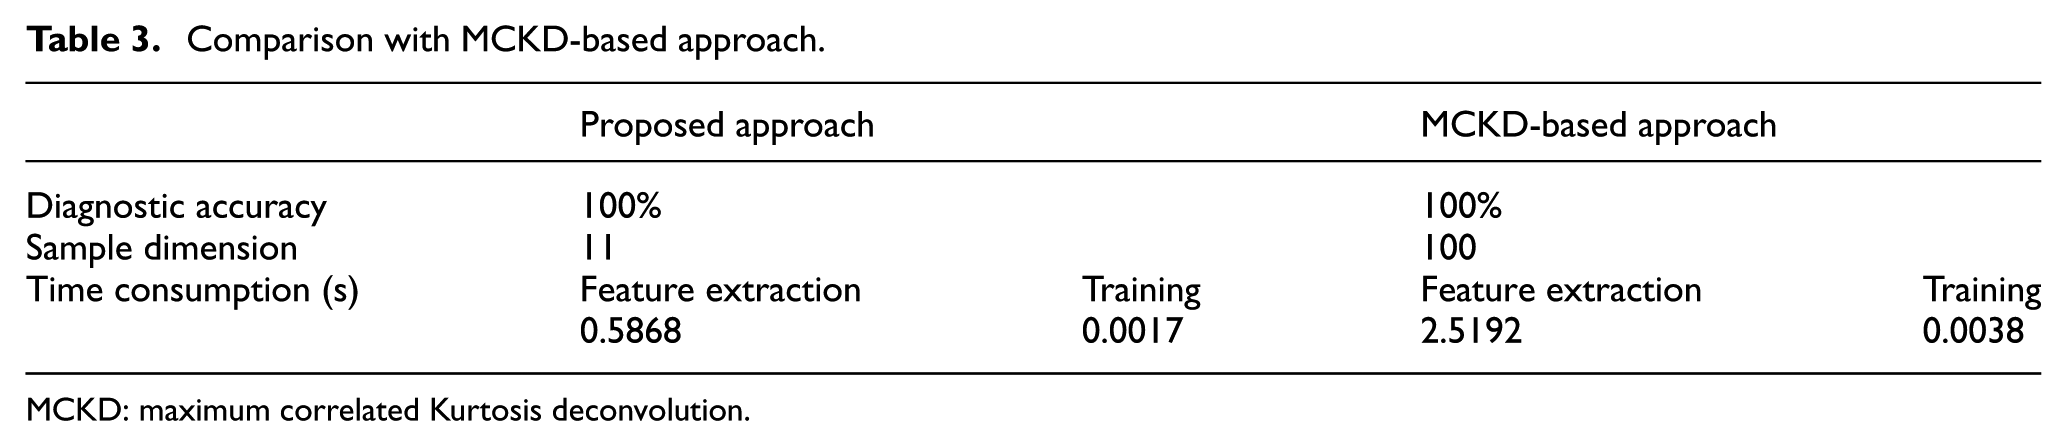
MCKD: maximum correlated Kurtosis deconvolution.
Then, the MCKD method was also implemented to the simulated cases from functions (22)–(23). The extracted features for the two cases are shown in Figure 14(a) and (b), respectively.

Feature extraction for simulated cases using MCKD.
In MCKD method, the FIRs of
The general diagnostic performances of the conventional approach, the proposed approach, and the two other investigated approaches are listed in Table 4. Generally, both the proposed approach and the other two approaches provide a much more accurate diagnosis than the conventional integral value–based approach, because more informative features are extracted from current waveforms. But when applied to simulated cases, the proposed approach together with the MCKD approach yields the best accuracy.
General performance of the four approaches.

WPD: wavelet packet decomposition; MCKD: maximum correlated Kurtosis deconvolution.
As the diagnostic problem is time crucial, the time consumptions for both classifier construction and fault detection of the four approaches are also investigated. The proposed approach spends 0.5885 s in constructing fault classifiers, which is fastest. And when implemented to diagnose a given waveform, the proposed approach together with the conventional approach shows significant superiority.
According to the experiments, the proposed method yields better diagnostic accuracy than the conventional method, while it requires less time than methods based on WPD and MCKD.
Conclusion
This article proposed an approach designed specifically for diagnosing the faults of rectifier transformers. The approach adopts 11 features to describe a system’s operational status and implements the LS-SVM to train fault classifiers. With these fault classifiers, faults can be detected and located. The effectiveness of the proposed approach was validated using practical problems and simulated cases.
The significant attributes of the proposed approach are as follows:
It yields higher diagnostic accuracy than the integral-based approach when used to deal with the system described in this article.
An easier selection method for extracting features from current waveforms is proposed.
In cases of feature extraction for current waveforms, the proposed approach costs less computation time than general feature-extracting methods like WPD and MCKD, while providing no less information for diagnosis. It is also promising for diagnosing time-critical problems in which current waveforms are implemented to monitor system status.
What needs to be investigated more thoroughly is application of the proposed approach to online diagnosis. Although it is significantly faster than general methods such as WPD or MCKD, still faster computation times are required for real-time diagnosis of high-speed systems. This will be a direction of future work.
Footnotes
Acknowledgements
Academic Editor: Dong Wang
Declaration of conflicting interests
The author(s) declared no potential conflicts of interest with respect to the research, authorship, and/or publication of this article.
Funding
The author(s) disclosed receipt of the following financial support for the research, authorship, and/or publication of this article: The work described in this paper was supported by grants from the National Science Foundation of China (project nos 61503181 and 61673205), the Fundamental Research Funds for the Central Universities (no. NE2014202), and the Science Foundation of Jiangsu Province (nos BK20140953 and BK20141416).