
Abstract
Quantifying the non-stationary properties of bridge under passing vehicle has been an important topic in structural health monitoring of bridge. There are many methods of time–frequency representation used for the study of dynamics of bridge under passing vehicle, including spectrogram, wavelet, Hilbert–Huang transform, and so on. This article uses adaptive optimal kernel time–frequency representation to quantify the non-stationary properties of the response of bridge under passing vehicle and illustrates and discusses its advantages over conventional time–frequency methods.
Keywords
Introduction
It is well known that bridge during vehicle crossing events is undertaking time-varying running conditions, thus giving rise to non-stationary vibration signals. Extracting fault information of bridge from such non-stationary signals is the key to the success in structural health monitoring (SHM).There are many researches dedicated to the testing and analysis of vibrations of bridge with vehicle loading.1–10 The existing researches are helpful to SHM, but the problem due to its significance still needs further investigation. For instance, the dynamic effect of vehicle–bridge interactions can be underestimated or overestimated without accurately characterizing non-stationary properties. 10
Time–frequency analysis has been effectively used to reveal the inherent frequency components of non-stationary response and their time-varying features, as well as random and transient events. Various time–frequency analysis methods have been used for bridge responses.11–15 Time–frequency techniques are very useful for non-stationary and transient signal analysis. Time–frequency analysis could be implemented using windowed fast Fourier transform (FFT) algorithms (spectrogram, Wigner–Ville, etc.) or wavelet analysis. However, the inherent drawbacks of these time–frequency analysis methods limit their effectiveness in analyzing the problem and there exist gaps between theoretical and analytical results. The well-known Hilbert–Huang transform has fine time–frequency resolution and is free of cross-term interferences, but it essentially relies on the empirical mode decomposition using spline interpolation. It is susceptible to singularities in signals and may produce pseudo-intrinsic mode functions, thus masking or interfering the time–frequency structure of true signal components. The local mean decomposition method has the same merits but also suffers from the same shortcomings as empirical mode decomposition. As a typical representative of bilinear time–frequency representations (TFRs), Wigner–Ville distribution has the best time–frequency resolution, but it has the inevitable cross-term interferences for multiple component signals. Such cross-term interferences complicate the interpretation of signal features in the time–frequency domain and make it unsuitable to analyzing the complex non-stationary vibration signals with uncertainty. Various modified bilinear time–frequency distributions including Cohen and affine class distributions may suppress the negative effect of cross-terms but compromise time–frequency resolution and auto-term integrity.16–20 The problems associated with the selection of a best-performance TFR for bridge structural damage detection have remained open. Typically, the multi-criteria measures for an objective and user-independent selection of appropriate TFR need extensive research. For example, within the subdomain of wavelet transform method, the wavelet orthogonal basis has many options. To obtain the maximum benefit of wavelet transform method, it is important to select the most suitable basis for each particular problem as indicated in a study by Cantero and O’Brien. 15 However, to select a proper basis for efficient analysis, many possibilities have to be analyzed. In the study by Cantero and O’Brien, 15 the modified Littlewood–Paley (MLP) is finally selected to study the frequency evolution of vibration–bridge interaction problems, after comparing with some other alternative wavelet bases, including a variety of bases such as Haar, Morlet, Mexican hat, and Littlewood–Paley.
Generally, the evaluation indexes for ideal TFR include the following properties: higher clarity to make it easier to be analyzed and interpreted, less cross-term to avoid confusing real components from artifacts or noise, many desirable mathematical properties to ensure such methods benefit real-life application, and lower computational complexity for implementations.
In principle, the adaptive optimal kernel time–frequency representation (AOKTFR) method had been proved to be of advantages of higher time–frequency resolution than conventional time–frequency methods.21–23 When compared with the other time–frequency methods, AOKTFR has been widely proved to be able to suppress the cross-terms more effectively with better time–frequency resolution, which can offer new insights into the nature of complex multi-component non-stationary signals.21–27 AOKTFR can achieve high energy concentration and cross-term suppression and has been widely used in time-varying frequency signal analysis for many systems to extract local attributes due to good resolution in time–frequency for multi-component signals.21–26 The advantages of AOKTFR over conventional time–frequency methods have been illustrated in various applications.21–29 In the field of non-stationary signal analysis for machine learning, 24 AOKTFR was comprehensively demonstrated to be advantageous by numerically comparing with variety of TFRs including Wigner distribution, Choi–Williams distribution, spectrogram, page distribution, and Rihaczek distribution. In the field of non-stationary signal analysis in earthquake engineering, 27 AOKTFR was demonstrated to have a good resolution in time–frequency in case of multi-component signals, compared with Spectrogram, Wigner–Ville, Choi–Williams, and reduced interference distribution.
In this article, the non-stationary property of bridge under passing vehicle is characterized by conventional time–frequency spectrogram. A brief overview on the principle of the AOKTFR method is given, and it is demonstrated that the AOKTFR method can be successfully applied to vehicle–bridge response problem, and distinguished results compared with conventional spectrogram can be attained. The advantages of AOKTFR over traditional analysis methods are discussed.
Testing of bridge under passing vehicle
Vehicle load tests were conducted on Chulitna River Bridge (Figure 1(a)), which is a steel girder bridge located at Trapper Creek, AK, USA. The total length of bridge is 800 ft, and it is a five-span bridge with two traffic lanes. A portable accelerometer system (Figure 1(b)) was set on the bridge deck to monitor vibration in the vertical direction. Figure 1(c) shows a crossing truck used to excite the bridge vibration.

(a) Chulitna River Bridge, (b) portable accelerometer, and (c) test truck.
Time–frequency analysis
Figure 2 shows the recorded acceleration on the bridge at a representative location when the vehicle traverses over the bridge. Figure 3 shows the FFT spectrum exhibiting multiple peaks, clusters, and bands, particularly with two spikes below 5 Hz. To correlate the FFT of the testing, the results of the finite element method (FEM) of the bridge are shown in Table 1. Table 1 is from eigenvalue analysis of bridge without vehicle excitation.

Response of accelerometer on the bridge with vehicle traveling across the bridge.

FFT spectrum of the response in Figure 2.
FEM results of bridge modeling.

FEM: finite element method.
Obviously, the spikes below 5 Hz in FFT are correlated with the natural modes of the bridge, whereas the significant narrowband centered at about 12 Hz in FFT spectrum could be attributed to the specific vibrations due to strong vehicle–bridge interactions. To characterize the vehicle–bridge interactions, time–frequency analysis of spectrogram is used. Figure 4 shows the spectrogram of the acceleration signal in Figure 2 using standard spectrogram in MATLAB Toolbox.
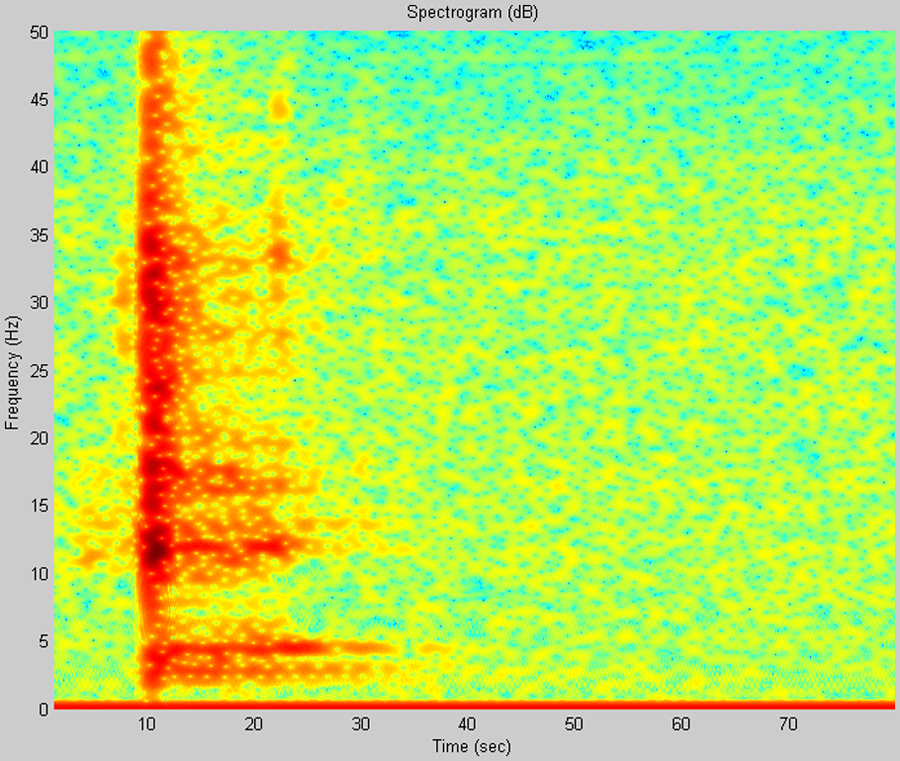
Spectrogram of the response in Figure 2.
By comparing the above-obtained spectrogram with typical benchmark results from theoretical model of vehicle–bridge interaction, such as the time-varying spectrum from accurate theoretical results, 15 Figure 4 shows strong scatter and does not exhibit distinct zebra pattern with stripes evolving with time as documented in the study by Cantero and O’Brien. 15 Therefore, the resolution of the spectrogram is not sufficient to quantify this non-stationary response. Many researches have demonstrated the limitation of spectrogram. The cross-terms in spectrogram could be the artificial results.
AOKTFR
To overcome the limitations of conventional TFR, previous studies21,22 have proposed the method of AOKTFR to optimize signal-dependent kernel functions, which are attained by the separation property of auto-terms and cross-terms in the ambiguity domain; that is, the auto-terms concentrate at the origin, whereas the cross-terms lie away from the origin.22–26 The basic procedures of AOKTFR is summarized as follows:21–23 if P(t, ω) is a conventional bilinear TFR that measures a local time–frequency energy

in which
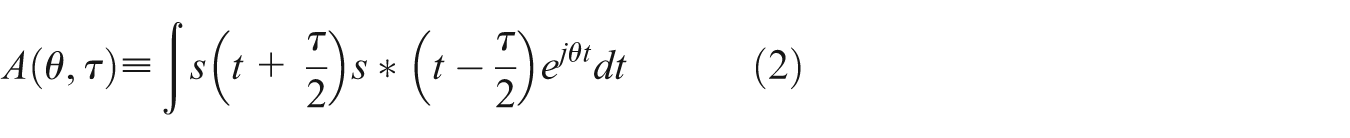
Consider the kernel with Gaussian radial cross sections

The function

The radial Gaussian kernels is adapted to signal by solving the following optimization problem

subject to

which is equation (3) in polar coordinates, and

the short time ambiguity function is given as follows

Once the optimal kernel is determined, the AOKTFR is given as follows

Figure 5 shows the results of AOKTFR of the recorded acceleration of the bridge during vehicle passing. Obviously, Figure 5 exhibits distinct stripes evolving with time, which is consistent with the standard benchmark results from accurate vehicle–bridge interaction model. 15 Figure 6 shows the ridges of AOKTFR. The ridge is defined as the largest amplitude frequency features of the spectrum, which can be considered as a high-resolution spectrum.

AOKTFR of the response in Figure 2.

Plot of ridges of AOKTFR of the response in Figure 2.
Discussion
In the non-stationary analysis of vehicle–bridge interactions, the spectrogram analysis has been widely applied. However, the method of spectrogram analysis has been proved to have limitations. It is seriously impaired by the cross-term problem, which limits the effectiveness of its sharp localization in the vehicle–bridge interactions problem with multi-mode participations. The spectrogram shows strong cross-term signal interference and energy scattering, which is one of the limitations of spectrogram for non-stationary signal identification. In comparison with the spectrograms, AOKTFR method has been theoretically proved to be able to suppress the cross-terms more effectively with better time–frequency resolution,24–30 which can offer new insights into the nature of complex multi-component non-stationary signals. AOKTFR can achieve high energy concentration and cross-term suppression. It is noted that spectrogram and wavelet transform are subject to Heisenberg’s uncertainty principle; that is, the best time localization and highest frequency resolution cannot be attained simultaneously. One of them can only be enhanced at the expense of the other, and hence, the time–frequency resolutions of linear transforms are limited. Moreover, the basis in either the Fourier or wavelet transform is fixed. Therefore, they lack adaptability in simultaneously matching the complicated multiple components due to random and impact excitation of bridge surface. There is no research reported before about the application of AOKTFR on bridge response analysis. In principle, AOKTFR is superior to the other TFR methods. The above results illustrated that AOKTFR results are better than that of the spectrogram in terms of resolution. AOKTFR offers footprints of frequency evolution with high resolution when structured under dynamical loading. As existing researches indicated, the patterns of frequency evolution of vibration–bridge interaction could be used to develop SHM index. The damage or degradation in the structure might be associated with the changes in dynamic properties of a bridge under a passing vehicle. Damage in the structure could be reflected by a permanent shift of the pre-event frequency evolution pattern. Therefore, the establishment of pre-event (the event such as a period of operation, an earthquake, a collision, or other accidents), event, and post-event frequency evolution pattern of the structure might be needed for damage detection in SHM.
Conclusion
This article uses AOKTFR to quantify the non-stationary properties of the response of bridge under passing vehicle. The conventional spectrogram is illustrated to give rise to low-resolution spectrum for vibration of bridge under passing vehicle due to cross-term drawbacks, which may mislead the results, whereas the AOKTFR gives high-resolution spectrum for the identification of non-stationarity. The general inherent advantages of AOKTFR over the other time–frequency methods for the non-stationary vibration analysis are also discussed.
Footnotes
Academic Editor: Yonghui An
Declaration of conflicting interests
The author(s) declared no potential conflicts of interest with respect to the research, authorship, and/or publication of this article.
Funding
The author(s) received no financial support for the research, authorship, and/or publication of this article.