
Abstract
This article proposes a method for continuous bridge displacement monitoring combining the dynamic triangulation scanning and load estimation by vehicle image recognition. The vehicle–bridge interaction is a non-stationary dynamic process parameter of high relevance to understanding the static instability behavior of bridges. The knowledge of the load on a bridge in the specific time when its structural spatial coordinates are measured allows correlating the bridge displacement with the effect of vehicle–bridge interaction. The evaluation of such correlation is mandatory in order to verify if the observed bridge displacement is due to the nature of its operation or due to it is presenting structural damage. The proposed method is continuous structural health monitoring method, based on the combination of three approaches evaluated at laboratory environment: (1) a three-dimensional optical scanning system for displacement measurement, (2) a load measurement system for vehicle–bridge interaction assessment, and (3) a two-measurement systems data correlation; to be implemented in bridges at a real environment to collect their historical behavior. Overall, for each approach, the measurement systems’ principles, the laboratory experimental methodology followed, and results obtained are presented.
Keywords
Introduction
Continuous structural health monitoring (SHM) of bridges is indispensable to seeking information about their health. This is essential to understand their behaviors, to figure out if they are operating under healthy conditions, are overstressed, and/or are under a low-/medium-/or high-degradation process.
As the cities grow and modernize, the vehicle traffic increases, and the design of bridges is every time more sophisticated, coupled with this, the smart cities, sustainability concepts and intelligent technology emergence, guide to the substitution of conventional SHM methods to non-contact, continuous SHM methods.
By other side, SHM has always been a challenging task. A wide range of technologies have emerged, given place to different SHM systems, according to the structure characteristics under monitoring; the different SHM systems adapt their application and implementation methodology.
The measurement of 3D points over the surface of a structure enables to evaluate if it is presenting displacement. Several approaches can be found in the literature to obtain the 3D points in order to calculate their displacement, although they can be classified in two big branches, the methods based on computer vision and the methods based on interferometry and structured light laser scanning. Methods based on computer vision can be based on one camera, but it requires the camera to move around the structure to apply the algorithm Structure from Motion (SfM) in order to obtain the structure coordinates. Stereovision is a more used method; it refers to the correspondence between image pairs (matching points) according to their extracted features, one to one correspondence of imaging points of the same physical scene of a structure, and one disadvantage of stereo vision is the lack of accuracy in the depth measurements.
By other side, interferometry and structured light laser scanning are methods based on an active sensing, and their measurements are defined by the response of the surface to the light applied over it, their principle of working can be classified on those based on the time of fly (ToF), also called light detection and ranging (LiDAR), and those based on triangulation and surface reflectance, as well as some of them with the emission of structured light.
All technologies based on optoelectronics are sensitive to the environment light, both camera and photo sensors used in laser scanning vary its accuracy depending on the environment illumination. Some of the advantages of laser scanning are that they work with high accuracy and efficiency in dark environments and have fast acquisition. Besides that, it is relative easy to post-process to eliminate undesired dots.
The big difference between interferometry and structured light laser scanner versus computer vision is that in the first, their output is three-dimensional (3D) coordinates to directly calculate displacement, while in the last, the output are the images that require the extraction of features to calculate the 3D coordinates and posteriorly calculate displacement.1–4
Such is the case of 3D optical scanning systems (OSSs), a non-contact system used to measure selected spatial coordinates over a structure for displacement calculation through continuous-time. The SHM of static structures like buildings, dams, and mines using OSSs has demonstrated to be an advantageous method to evaluate the structures through the analysis of their displacement measurements. 4 However, in the application of OSSs for bridge SHM tasks, it is required to analyze vehicle–bridge interaction (VBI) to correlate the traffic load with the bridge structure displacement.
The traffic load can be estimated by the presence of vehicles, existing several vehicle detection approaches based on different technologies and their combinations, such as the flexible pressure sensor, which is based on changes in capacitance due to variation in the distance between two electrodes at an applied external pressure; 5 the inductive loop sensors that consist of two to three turns of insulated wire embedded in pavement to measure the change of the inductance of the system as the vehicle is passing over the loops; 6 the microwave radar based on frequency-modulated continuous waves transmitted to be reflected back from vehicles surface, which signal echoes directions are estimated by signals processing to detect vehicles and their speed; 7 the radar technology in synergy with infrared sensors by data fusion algorithms; 8 the monocular vision in infrared images, based on the analysis of the cues provided by the heat levels at exhaust pipes and tires of vehicles on the road through classification algorithms; 9 the LiDAR sensor based on a principle similar to the radar, it fires rapid pulses of laser light at the vehicle surface, to measure the amount of time it takes for each pulse to bounce back, by this way, it determines the distance of objects surrounding it, providing a point cloud; 10 the ultrasonic sensor which uses the basic principle of sound propagation and reflection through material in the ultrasonic frequency range, this sensor has a transmitter which transmit ultrasonic waves, when waves hitting a vehicle part of their energy is reflected back to a receiver of the sensor as echo signal for determining its position and velocity; 11 the passive acoustic sensor that records the vehicle’s drive-by noise to estimate the acoustic wave pattern from received signals generated by the engine, the tires, the exhaust system, aerodynamic effects, and mechanical effects (e.g. axle rotation, brake pads, and suspension) in order to determine the vehicles profile; 12 the systems with a principle of operation based on two modulated infrared emitters and a photodiode with an optical filter as receiver, both mounted above the plane of detection, every time their communication is disturbed the system count it as a vehicle occupancy; 13 the wireless anisotropic magneto resistive sensor used to detect geomagnetic disturbances around the Earth’s equator in real-time due to ferromagnetic material, combining with the ultrasonic distance–measuring sensor to determine the position of vehicles,14,15 the ones based on mono- or stereo-camera systems, for example, in Han et al., 16 a monocular camera is used to estimate vehicles distance by the detected lane information and a pinhole camera model, which consists of a mathematical relationship between the coordinates of a point in 3D space and its projection onto the vehicle image plane of an ideal pinhole camera, where the camera aperture is described as a point and no lenses are used to focus light, while in Li et al., 17 a combination of both methods are fusion, a monocular camera and a binocular stereo camera are combined to optimize the estimation of an obstacle frame of the target vehicle. Most of the methods based on computer vision are video feed and mainly rely on digital image processing, artificial intelligence, and data mining–related technologies. 18 For the development of this article, a VBI assessment based on the processing of vehicle traffic images has been selected. The decision was taken considering that nowadays the tendency of modern cities that contain bridges in their transportation systems is adopting smart city concepts. 19 That involves the installation of video surveillance on bridges for vehicle detection and tracking for several purposes. Since surveillance video is an undervalued source of traffic information, already installed and available in most of the bridges, image processing has been selected to extract a bridge load indicator to correlate with displacement measurements, 20 which gives place to the proposed novel method described in this work, because never before bridges displacement measurements by OSSs have been correlated with bridge occupancy estimated from surveillance video. With this context, a VBI assessment through bridge traffic load calculation is proposed, a bridge load classifier (BLC) based on image processing from vehicle traffic monitoring is used for bridge displacement and load measurements correlation. This article is structured as follows: first, an introduction has been done to describe the global purpose of this article. Section “Bridges continuous SHM and VBI-related work” presents bridge’s continuous SHM and VBI-related work. The 3D OSSs for displacement measurement are described in section “3D optical scanning system for displacement measurement,” while the load measurement system approaches for VBI assessment are presented in section “Computational models as BLCs for VBI assessment.” The correlation experimental methodology evaluation is shown in section “Experimental methodology.” Finally, section “Conclusion” concludes.
Bridges continuous SHM and VBI-related work
Bridges are subjected to diverse types of deterioration mechanisms such as corrosion, fatigue, carbonation, or alkali-aggregate reactions, due to aging, environmental conditions, and overload. For centuries, the SHM has been performed through visual inspection by experts to identify defects, deterioration, and damage. Nowadays, SHM strategies use sensors and information technology for continuous data collection to develop methods of providing more accurate knowledge of the performance of the structures than traditional strategies. The advantages of continuous monitoring methods are that they allow monitoring of the structures while they are in service. They also allow knowing the historical global behavior of the bridges to evidence degradation tendencies, instead of only detect the effects of extreme events, such as collisions or environmental attacks (strong-motion earthquakes or hurricanes). 21 The SHM of bridges evaluates their integrity, and also includes the analysis of remaining life and its load-carrying capacity. Data collected are used to optimize the operation, maintenance, and repair of bridges. In the state of the art of continuous SHM strategies are the vibration-based for guided-wave propagation frequencies modes analysis,22,23 the wireless sensor networks triggered by strain, acceleration, and time-based, 24 computer vision–based for digital image and laser signal processing through traditional and machine learning algorithms, 25 as well as the optical scanning–based structured light. 26
SHM magnitudes’ measurements are not universal; they depend on the technology and method approach used, besides the characteristics of the bridge. Displacement magnitude is particularly important for bridge state estimation, due to it indicates the bridge deviations from the original design performance, but it is difficult to measure because it requires a motionless reference point 27 or a correlation method between displacement measurements and motion as proposed in this article. Different sensors have been used to calculate displacement, accelerometers, strain gauges, inclinometers, and fiber optical Bragg grating strain; 28 however, the acquired information is limited by the number of points equipped with sensors. As a solution, to expand the measurements is proposed the use of 3D optical scanning system, which continually and contactless can monitor a big number of points over a determined structure, like bridges, with only one system.
Some bridge damages can be inferred from data analysis obtained from VBI events, such as in the use of the acceleration response, where the analysis of frequency and amplitude of vibration data are used to detect local crack beam damages. 29 But in other cases, the VBI events data are correlated with other bridge measurements, such as in Szafrański, 30 where the wedge method is used to measure the VBI impulse excitation to be correlated with the bridge acceleration response. Or like in Melo et al. 31 and Eshkevari et al., 32 where the positions of the traffic loads and the loading history are taken into account during the correlation process with the vertical movement of the bridge. Since the traffic loading on bridges is an important parameter in SHM tasks, Shokravi et al. 33 conducted a review and classification of papers dedicated to vehicle-based health monitoring methods used for bridges, from where it is identified the vision-based classification. Vision-based methods are considered as an application of the smart sensing technology in SHM. These are supported by smart and robotic sensors, digital cameras, smartphones, unmanned aerial vehicles (drones), and computer algorithms. The load could be detected through a fixed sensor, through the monitoring area, by a global vision, or a hybrid of these methods. The most related previous works with the development in this article are found in Catbas et al., 34 where an SHM method for bridges is proposed, based on the correlation of two vision-based systems (cameras), one for vehicle load detection and the other for bridge displacement, and Hou et al. 35 integrated measurement of vehicular loads that create the responses measured during the SHM task (For a detailed review on vision-based systems for bridge monitoring, see Sony et al. 36 ).
3D optical scanning system for displacement measurement
The proposed optical scanning system 37 for displacement measurement performs spatial coordinate measurements to evaluate biases in the coordinate’s measurement values and determine if a spatial displacement has occurred in structural elements under monitoring. Its operating principle is mainly based on the optical scanning aperture shown in Figure 1 and a dynamic triangulation method.

Optical scanning aperture principle.
The system can be set up to perform three-dimensional (2D) or 3D spatial coordinate measurements. Even in its basic shape, it can be set up to only perform angle measurements. The optical scanning system can be configured to work with incoherent light sources or with a coherent light source such as a laser. Usually, incoherent light is used for long-distance measurements (5–20 m long away), while the laser is used for short and medium distances (1–5 m long away).
The optical scanning aperture operating principle and its fundamental parts are described as followed. It contains a direct current (DC) motor that is continuously rotating in a specific frequency between an approximate range of 20–60 Hz. In the motor axis is mounted a reference disk plate with a notch to measure the motor rotation frequency. When the disk notch position coincides with the opto switch position, the receiver can sense the signal sent by the emitter, producing a pulse in every revolution as shown in Figure 2, where

Scanning frequency reference system.
The optical path is formed by a 45° mirror (which rotates with the motor rotation), during the scanning process to find light emissions and according to the law of reflection, reflects them 90° through lenses that collimate the light emissions to an optoelectronic sensor that transduce the light signal to an optoelectronic signal, as illustrated in Figure 2, where
For short away distance, the optical scanning system configuration also called technical vision system (TVS) has proved to be a reliable option on SHM tasks, presenting a balance between precision and operating ranges at short away distances (between 1 and 5 m long away). However, it presents limitations in measuring 3D coordinates at wider angles; due to the capability of the laser reflection intensity that can be received by the photoelectric sensor depends on the distance and the angle of the laser beam emission. For short away distance, the limitations can be adjusted by the implementation of machine learning strategies through measurement correction methods, but for long distances, it is not possible with this configuration due to the photoelectric sensor capacity to perceive the reflected laser signal. 38
It is structured with laser positioning and an optical scanning aperture, to obtain 3D coordinates through laser dynamic triangulation principles, as shown in Figure 3(a), where the


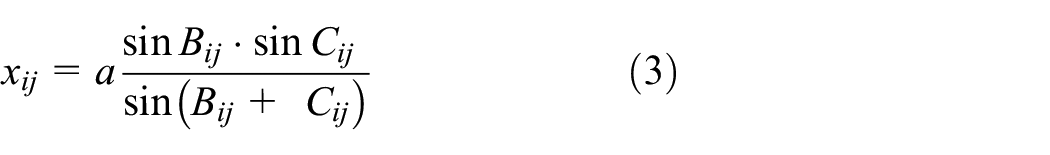


(a) Optical scanning system based on coherent light emission for SHM and (b) optical scanning system based on incoherent light emission for SHM.
For long away distance, the configuration has also proved to be a reliable option on SHM tasks, presenting a balance between precision and operating ranges at long away distances (between 5 and 20 m long away). 4 However, its default design based on the use of photodiode presented limitations at measuring 3D coordinates in environments with optical noise; especially in outdoor environments with a high concentration of sunlight, resulting in the saturation of the photoelectric sensor in the approximate range of daytime between 10:00 and 18:00 h (at Mexicali, Baja California, Mexico, where the experiments were performed, a place worldwide known as the city that captured the sun). 41 After a comparison of the different kind of photoelectric sensors such as photodiodes, phototransistors, light-emitting diode (LED) as a receiver, infrared LED’s as a receiver, and inclusive the light-dependent resistor (LDR), it has been observed that the use of an LED as a photoelectric sensor, in special those working at the wavelength range of blue light (∼427–476 nm),39,42 it is possible to discriminate the sunlight noise with the support of digital filters, such as finite impulse response (FIR), and the Savitzky–Golay filter, enabling the system to work in hostile environments with lighting contamination. 43 Besides the use of computational techniques based on pattern classification, like linear discriminant analysis (LDA) and linear regression (LR), it is possible to classify the different light sources detected to discriminate those that are not of interest. 44
In a difference to the TVS, this OSS is structured with two optical scanning apertures, instead of one laser positioning and one optical scanning aperture. Light emitter sources are used as markers. The light emitter sources are placed in different points of interest over the structure, and then both optical scanning apertures scan the field of view providing the angular measurements values
One or more OSS systems can be focused to monitor structures on any of the described configurations but in both of them, to be applied for bridge SHM monitoring they require to be complemented with a system to know the load on the bridge in the specific time when its structural spatial coordinates are measured to correlate the bridge displacement with the effect of VBI.
Computational models as BLCs for VBI assessment
Different methods for vehicle detection on the video data from outdoor surveillance cameras have been developed, most of them to evaluate the velocity distribution and density of vehicles, while some others to tracking vehicle passing. In the development of the proposed vision-based system, for the correlation with the bridge 3D coordinate displacements, different approaches have been researched to select an adequate method to develop a BLC.
Bridge load classification by image processing from traffic video data requires computer vision algorithms to extract vehicles information detected from video frames, besides the process of selecting the best camera position configuration for the different scenarios is related to the selection of the image processing approach for such data set build for a specific monitoring application. For applications where real-time information is required, efficient and low-cost image processing techniques are constantly under development, robust performance under varied environmental conditions is desired, 42 is an example of an approach focused on the digital processing of the effects of tire contact with road to estimate its load.
In search of a robust algorithm with performance under varied environmental conditions, two approaches have been selected to perform this task. One approach based on self-learning, through machine learning by an algorithm that makes use of big data and is in the state of the art, deep neuronal network learning, and a second classical and simple approach based on image registration, with a not-machine learning approach, and definitely with a very low computational cost.
Deep learning for bridge load classification
An increasing number of researchers attempt to leverage deep learning techniques into diverse applications. Each day, novelty deep learning neural network (NN) models are developed to improve the knowledge of the relationship of multidimensional non-linear features in images, mainly for classification purposes. All this development provides a potentially useful tool that can automate bridge load classification.43,45–47 Neuronal network is a mathematical model inspired by the neurophysiological patterns that describe human brain functions through billions of neurons arranged into a hierarchical structure of six different layers in the human cortex, connected with other neurons transmitting, processing, and storage by synapse connections in constant neuron plasticity processes for learning. The coding of synapse and neuron plasticity oversimplified processes are the base for the formulation of the mathematical model of the neuronal network, as expressed by equations (6) and (7) for each neuron, where


The appropriate selection of σ determines the neuronal network convergence abilities to reach accuracy and efficiency. The most common activate functions are, the binary step governed by a hard-limited


The NN architecture is defined by the number of neurons and their interconnection (input, hidden, and output layers). In the hidden layers, signals propagate, establishing neurons state and interconnections weight that define the neuronal network configuration. The more popular is the feedforward NN, where the outputs of a layer are used as the inputs of the next layer; the recurrent neural networks (RNNs), where the outputs of a layer are feedback in a cycled way, this process can create a “short-term memory” or “long-short-term memory,” also known as backpropagation; the convolutional neural network (CNN), where three layers perform three different tasks, convolutional (inputs are analyzed by filters to output a feature map), pooling (reduce the size of the feature map), and the fully connected (flatten the maps together and compare the probabilities of each feature occurring in conjunction with the others, until the best classification is determined). All these configurations with multiple layers, deep neural networks (DNNs), are defined as models of deep learning, expressed by hyperparameters, the number of hidden layers, the activation function, and how many times (epochs) training should be repeated.
A DNN commonly has between two and eight additional layers of neurons. The different types of neuronal networks are the core of deep learning, an NN increases accuracy with the number of hidden layers, such process converts the neuronal network into a deep neuronal network, also identified as a deep learning approach. A comparison between traditional neuronal networks versus novelty neuronal networks in special for the postulated task in this article which consists of image classification is related to the efficiency of processes, correlation, and understanding of a large amount of data in high-resolution images for their simplification, feature extraction, and classification. Novelty neuronal networks everyday evolution in order to solve issues presented in traditional neuronal networks such as parameters overfitting which produces complex models that are difficult to debug, and tune, due to the intensive computation requirements. The main difference between traditional neuronal networks is that they are based on a fully connected architecture, while in novelty neuronal networks, the neurons in one layer do not connect to all the neurons in the next layer.
Image registration process
Image registration is a classical method 48 that continues in the state of the art, used for diverse applications based on image processing approaches, 49 some examples are as follows: image processing for body analysis and medical diagnosis, 50 images background removal, 51 2D and 3D model reconstruction, 52 and moving object detection and tracking, 53 as in the proposed work. Every time, two or more images from different sources, times, or viewpoints require to be compared, image registration methods can be applied. Sometimes to remove image variations, others to identify a target on an image, or to compare two images of a fixed scene.
Several image registration methods have been developed in the search of a strategy to obtain satisfactory results, most of the time each method has been developed for a specific application. However, most of the methods include feature detection, feature matching, a transform model estimation, and image resampling and transformation. When two images need to be compared, they require to be aligned to identify their differences, so a transformation is mandatory to relate the points of the first image with their corresponding points in the second image. Usually, these images are multitemporal, and the aim is to find and evaluate changes in the scene between the two images. The variations are identified by the difference in values (intensity) and the location of pixels. Image registration can be defined as a transformation process to align images to a specific coordinate system. Resulting in a mapping between the two images to relate their spatial and intensity differences. Images are expressed as 2D arrays denoted by


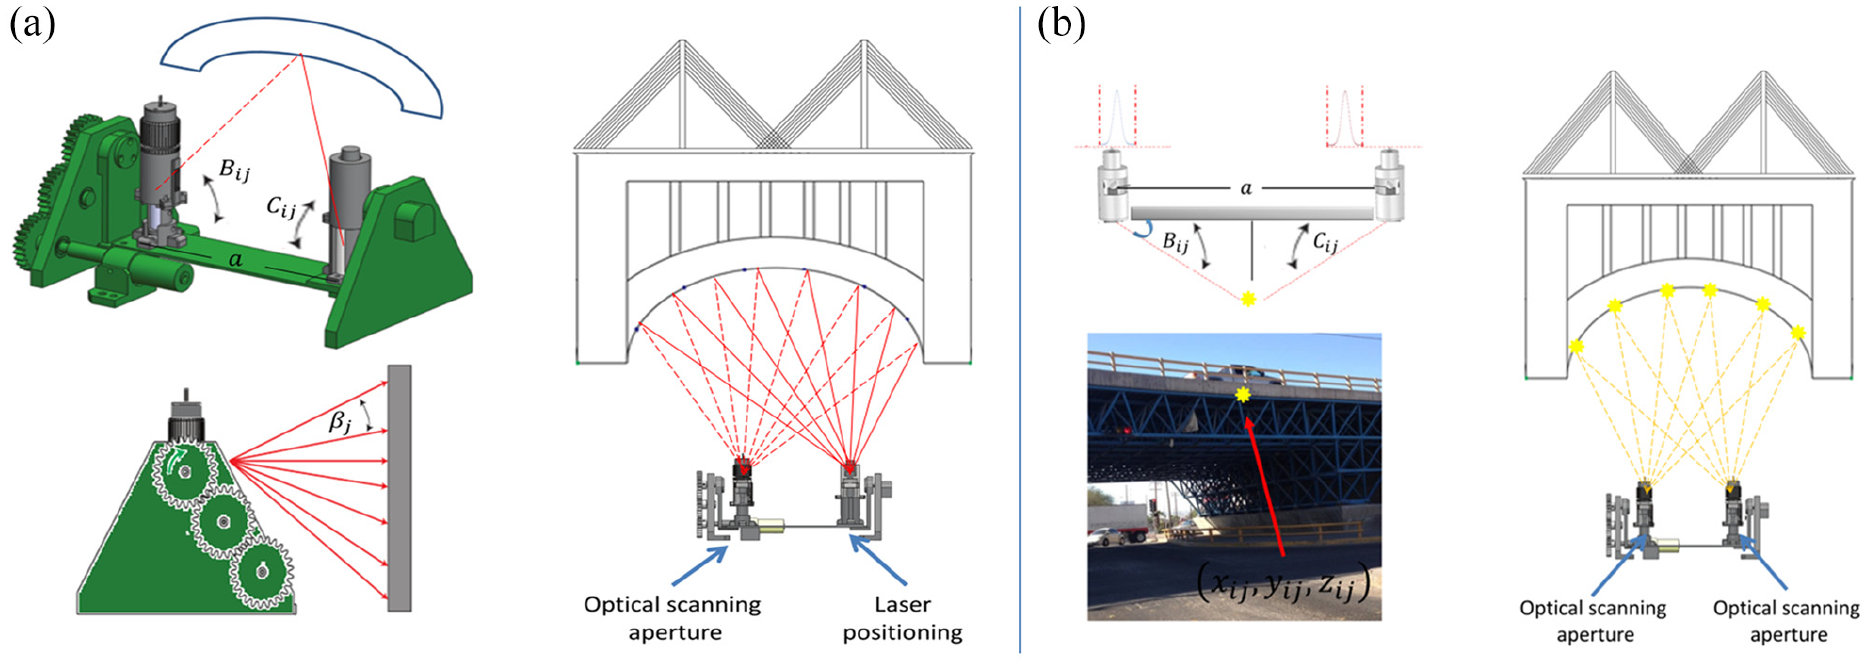
So the affine transformation can be expressed by equation (17), where

is the rotation matrix, and

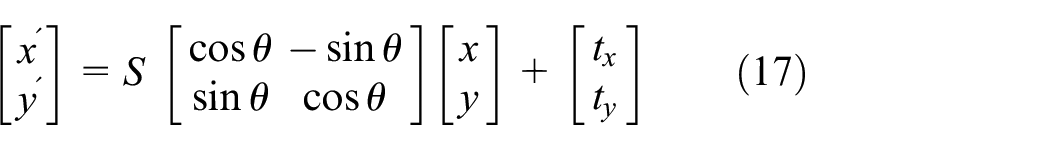
is the translation vector. Also, can be expressed by equation (18) as the general 2D form, or in the form of equation (19) by the use of homogeneous coordinates, were considering the geometric transformations: translation, rotation, scaling, stretching, and shearing; the affine transform has six parameters,

Experimental methodology
This section describes the methodology followed in the development of the three approaches proposed to be combined to integrate a continuous SHM method to be implemented in bridges in a real environment to collect their historical behavior. As well as the evaluation of measurement results obtained in laboratory experimental environment.
A 3D optical scanning system for displacement measurement
To evaluate the ability to measure coordinates by the 3D optical scanning system, an experiment was designed, where 15 light emitter sources were mounted on a structure, arranged in three rows and five columns with a distance of 30 cm between each light emitter on both axes, and 400 cm from the system. The 3D optical scanning system was set up with two optical scanning apertures distanced by a known value
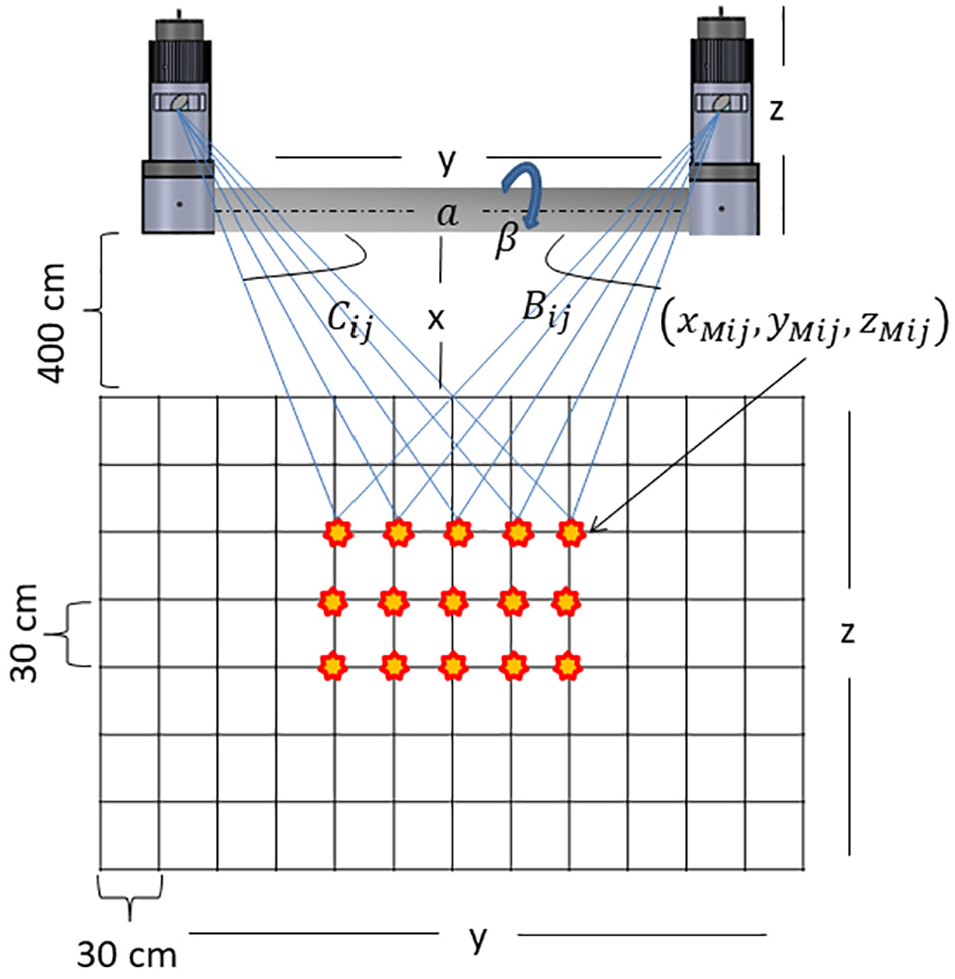
Experimental set up (objects not scaled are just representative).
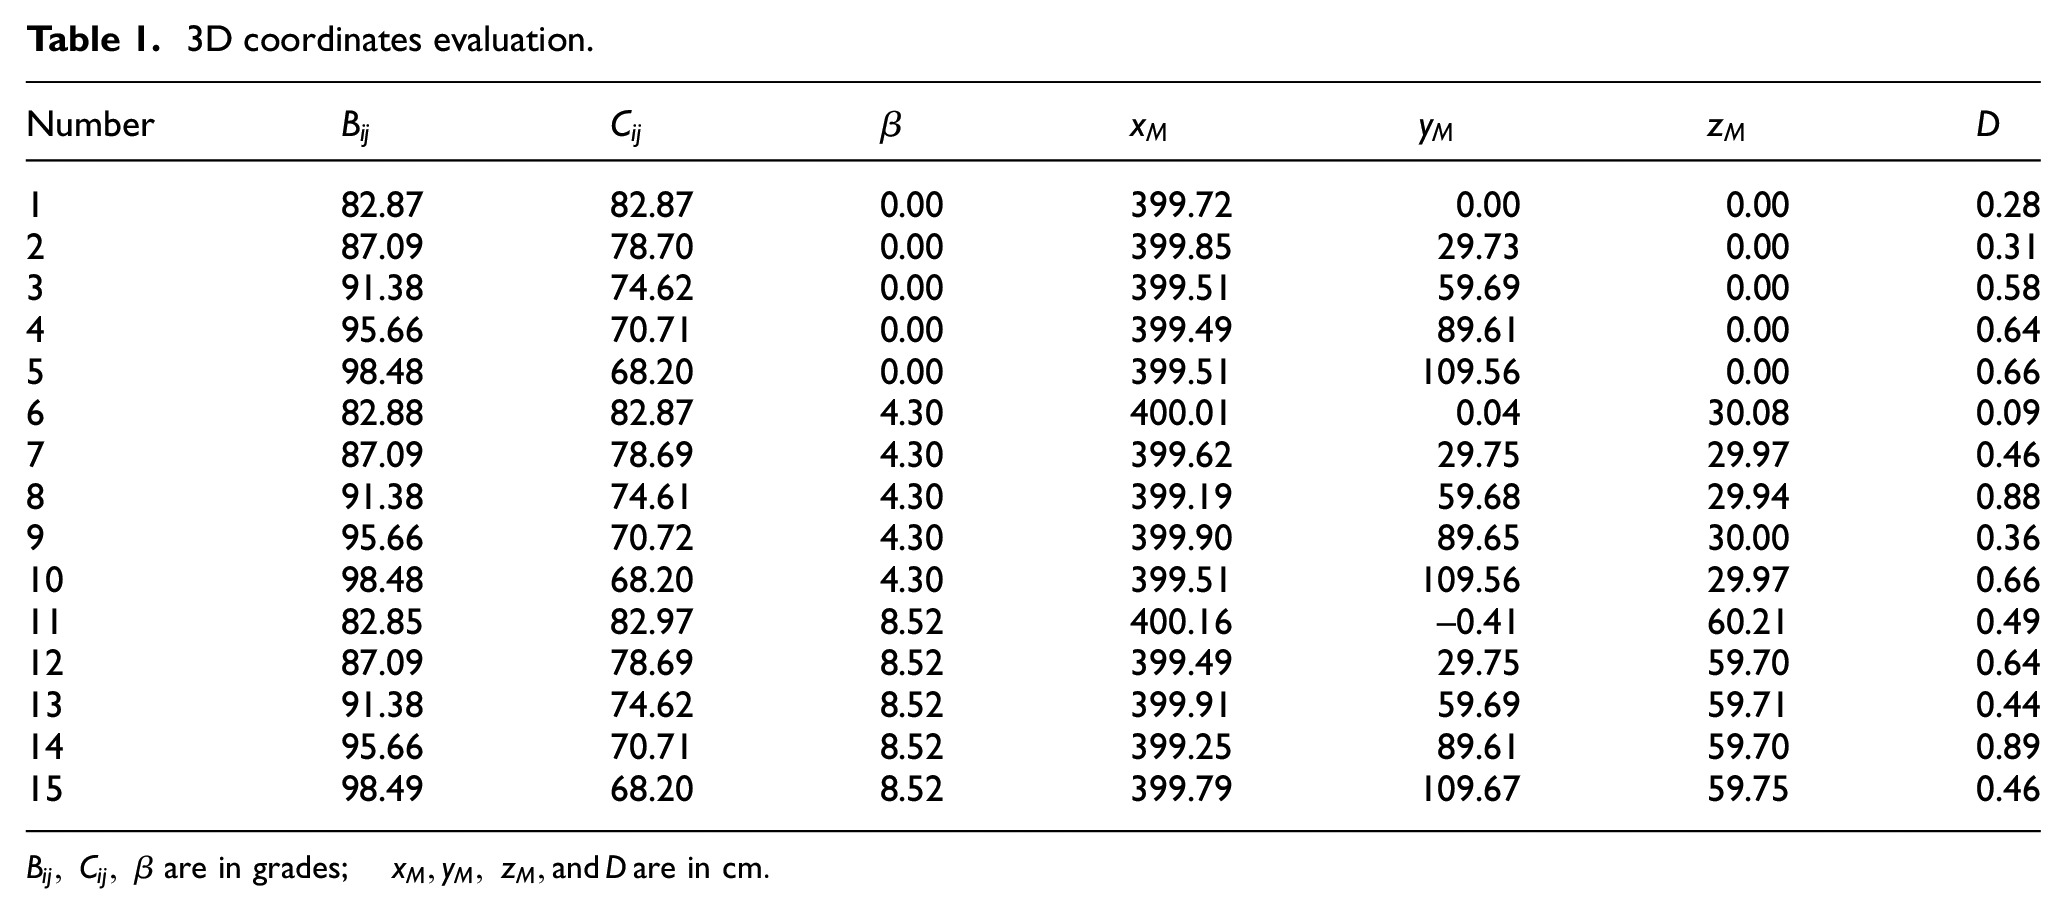
The optoelectronics signals from both optical scanning apertures were acquired; signal processed to calculate their energetic center and system measurement non-linearity nature corrected to efficiently execute the dynamic triangulation to obtain light emitter coordinates by equations (1)–(5), and accuracy was evaluated by the distance between real-known coordinates

3D coordinates evaluation.
For displacement evaluation, the structure was pushed 5 mm

Displacement evaluation.

A load measurement system for VBI assessment
Two successfully computational models have been developed and compared: one based on deep learning and one based on a non-machine learning approach, an image registration process, to compare them and select one of them that better match video surveillance already installed in each bridge structure under monitoring.
For the described purpose, a BLC is proposed to assign a prelaminar load class according to the kind of vehicle identified (car, pick up, van, truck, trailer, etc). Vehicle classification capacity by neuronal networks’ algorithms has been previously approached and proved as described at Sanchez-Castro et al.,
55
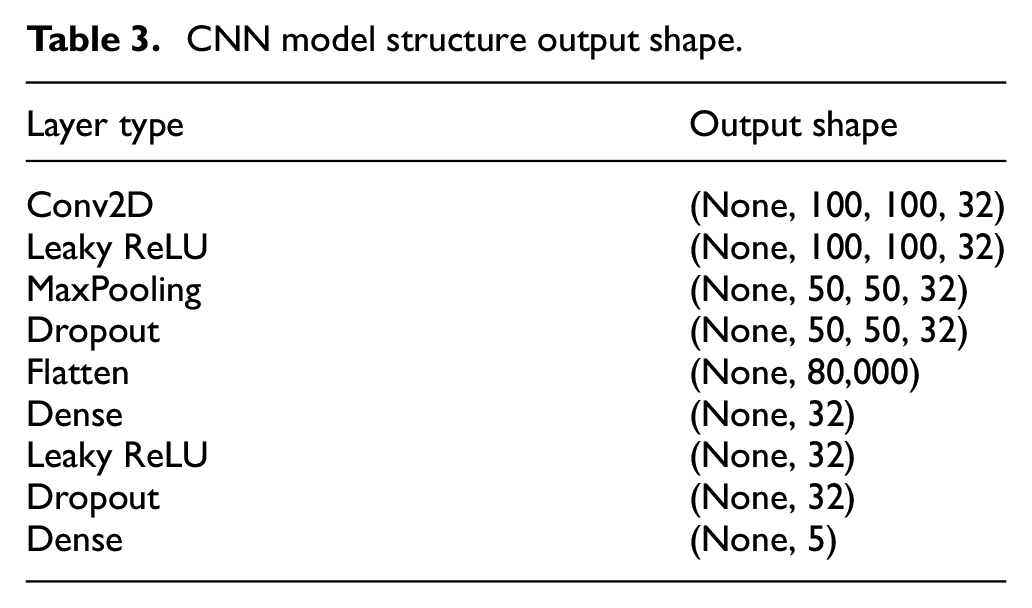
where a lean convolutional NN that with a smaller number of parameters maintain the best accuracy possible on vehicle classification is proposed. In this article, the first approach is to evaluate the best set up of surveillance cameras poses. It was developed based on a deep learning approach, with the architecture described in Table 3, configured with 200 epochs, a batch size of 64, and with an initial learning rate of 1e−3, the used data set has been split in 80% for training procedure and 20% test, while the training has been re-split in 80% training and 20% for validation between epochs. Initially, it has been evaluated the best set up of surveillance cameras poses by the use of the Stanford CARS data set,
56
which provides images of diverse kind of vehicles in different environments, with multiples orientations; from where four classes have been identified—front view, rearview, side view, and tilt view—from this initial evaluation with four classes, it has been observed that the larger the area covered by the vehicle, better the accuracy results.54,57 In consequence, a fifth class with a top view was added with customized images acquired at the city of Mexicali, Baja California, Mexico. The Stanford CARS data set originally contains: 16,185 images of 196 classes of vehicles. The data is split into 8,144 training images and 8,041 testing images, where each class has been split roughly in a 50–50 split. Classes are typically at the level of Make, Model, Year, for example 2012 Tesla Model S or 2012 BMW M3 coupe.
However, for this experimentation, it has been reclassified according to the vehicle’s class view (front view, rear view, side view, and tilt view) and completed with a new class view with a larger area covered (top view), as shown in Table 4. Note that 15,935 images were recovered from the Stanford CARS data set while 250 images were discriminated against, due to do not fit in any classes.
CNN model structure output shape.
Data set description.

As images correspond to different environments, each image presented different aspect ratios, which require a pre-processing to resize to 100 px width by 100 px height, with a normal crop mode (middle gravity focus to crop). The deep learning algorithm architecture has been developed on Python, through the Keras library running on TensorFlow. For the classifier model obtaining, libraries were imported, data set loaded, classes labels were created, data set was split into training, test, and validation, classes labels were submitted to one-hot encoding, CNN model was configured, the model was compiled and trained to obtain and save the model weights.
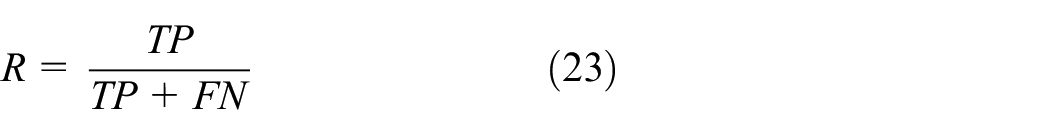
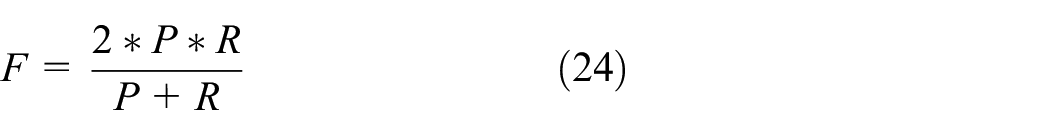
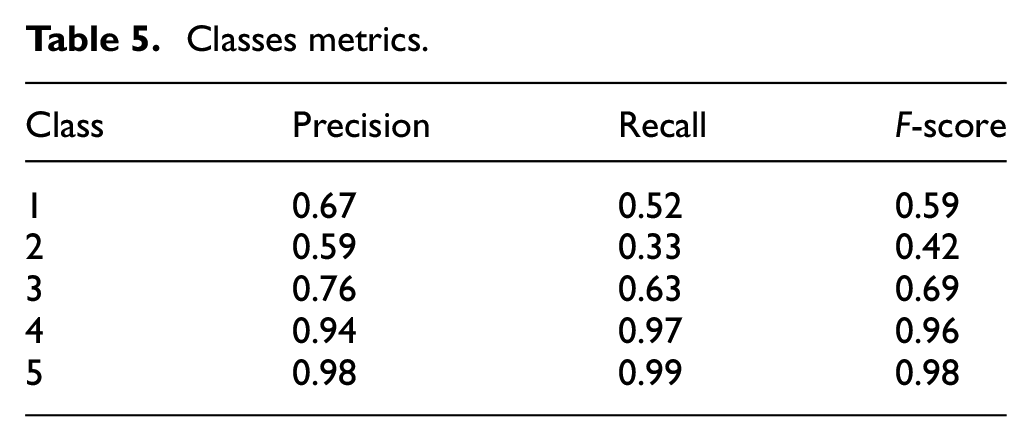
To proceed with the evaluation, images were loaded into the classifier, model weights were invoked, to finally obtain result according to the general flow diagram shown in Figure 5. The training, validation, and test accuracy reached have been of 95.49%, 93.02%, and 92.25% correspondingly, while the classes metrics are shown in Table 5, where precision


Deep learning general flow diagram.
Classes metrics.

Accuracy and loss curves.
For the proposed computer vision approach, the model designed can classify the images from video data according to the bridge highway lane vehicle occupancy percentage. It assumes that the camera is stationary. It focuses on detecting the vehicle as an object and to calculate the occupancy percentage of a determined section of the lane by the detected vehicle. An initial frame without moving objects to show the fixed background is selected, to posteriorly image register with a moving frame to identify their differences and calculate the number of pixels that changed from the fixed frame to the moving frame, as described in Figure 7. Image registration parameters were configured as (1) phase correlation with rigid transformation, (2) maximally stable extremal regions feature detection with affine transformation, and (3) speeded up robust features with affine transformation. Forty-eight images from the trajectory of a vehicle through the highway lane section of interest were evaluated with 100% or accuracy from where two images of each class were extracted to show results in Table 6.

Image registration general flow diagram.
Image registration results.

For the self-integration of the developed model to any environment, as future work should be developed an algorithm to automatically analyze a segment of a video to extract from its frames the moving objects to be segmented from the background in order to define the fixed image to be selected to run the developed model.
A two-measurement systems data correlation
The two systems synchronizing and correlation is proposed for the use of a timestamp every second with the individual measurement average from both systems, since the optical scanning systems measure the coordinates
Once the measures from both systems have been paired, the first step is to verify if the data follow a normal distribution, if it follows a normal distribution, Pearson’s correlation coefficient is used, instead if the data do not follow a normal distribution, Spearman’s correlation coefficient is used, defined by equations (25) and (26), respectively
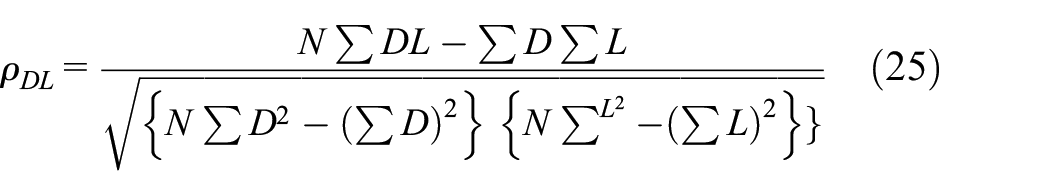

where
Conclusion
With the purpose of performing SHM tasks in bridges, understanding the static instability behavior of bridges due to VBI is mandatory; bridge load is a parameter of high relevance to be correlated with bridge point’s displacement measurements. The evaluation of such correlation is required in order to verify if the observed bridge displacement is due to the nature of its operation or due to it is presenting structural damage. A continuous SHM method for bridges, based on a non-contact optical scanning system used to measure the selected spatial coordinates over a structure to calculate the displacement of the selected structural coordinates through a continuous-time, and a bridge load calculation have been proposed. Two BLC methods were developed, one based on deep learning for the classification of diverse vehicles from diverse surveillances set up, with the inconvenience related to deep learning approach related with the big data required to train the model, and a simple model based on image registration for a top view fixed camera to classify the occupancy percentage of a defined highway lane section. Both approaches have been developed to compare them and select one of them that better match video surveillance in each bridge structure under monitoring. Methods do not depend on traffic parameters such as weight, axle load, a configuration of axles, direction, or vehicle speed; they only depend on the position of the vehicle on the bridge. Future work should focus on the search for more efficient and less costly image processing techniques with robust performance under heavy traffic loads and varied environmental conditions, as well as the correlation analysis methodology development with the historical data obtained with the proposed systems.
Footnotes
Handling Editor: Francesc Pozo
Declaration of conflicting interests
The author(s) declared no potential conflicts of interest with respect to the research, authorship, and/or publication of this article.
Funding
The author(s) received no financial support for the research, authorship, and/or publication of this article.