
Abstract
The brushless DC motor experiences operating safety problems due to the deterioration of its components following long-term operations, which are easily overlooked. To resolve these problems, failure mode, effects, and criticality analysis is utilized to characterize potential hazards in the motors. Hilbert–Huang transform is then employed to obtain the frequency-domain energy values of the vibration signals, which is defined as characteristic values that represent the performance degradation state. Second, gray model is selected to analyze the frequency-domain energy values and establish differential equations to predict the future vibration status, thereby achieving the vibration-based fault prediction. Furthermore, a gray safety assessment model is proposed to implement the safety assessment for the motor. The fault prediction and gray safety assessment are carried out based on historical data obtained from the brushless DC motor vibration experiment. The accuracy level of the gray model predictions is classified as Wonderful, thereby demonstrating the efficiency of gray model for the fault prediction. In addition, as low as reasonably practicable law is chosen to classify risk levels and formulate safety strategies in accordance with the results of safety assessment. Finally, the proposed safety effects of the methods and strategies are evaluated for microscopic and macroscopic levels.
Keywords
Introduction
The brushless DC (BLDC) motor is widely applied in various industrial fields such as in oil/water pump driving motors, robots, and electrical vehicles due to its attractive features, namely, its energy efficiency, high torque, high rotational speed, and low noise level.1–3 However, a growing number of applications rely on BLDC motors, which has increased concerns over its reliability and safety. Long-term BLDC motor operation generally degrades structure and component performance and sets off a series of chain reactions, which result in safety hazards in the motors and their application systems. Undetected and neglected safety risks may lead to malfunctions, emergency shutdowns, and the disastrous collapse of systems, thereby resulting in irretrievable economic losses and casualties.4,5 For example, a coal chemical company compensated RMB 200m to repair >1300 burned-out motors between 1987 and 2002; 6 a cooling fan motor burned following chemical processing in 2008, which resulted in the shutdown of the entire company’s production system and a direct economic loss of around RMB 1m. 7 Therefore, it is necessary to ensure the secure and efficient operation of BLDC motors and their application systems to avoid such accidents from occurring.
Researchers have presented methods for failure analysis, detection, and prediction to achieve this goal such as the implementation of vibration analysis, wear debris analysis, and temperature monitoring. Among these methods, vibration analysis is the most popular among mechanical engineering applications. For example, Deng and Zhao 8 used vibration analysis to obtain a fault diagnosis of the rotating machinery by combining the local mean decomposition and Fourier transform techniques. Soleimani and Khadem 9 integrated the phase space reconstruction and vibration analysis methods to recognize the different rotating machinery fault types by quantifying the chaotic vibrations. Williams et al. 10 combined the time-domain techniques, high-frequency techniques, and the adaptive line enhancer method to analyze the bearing’s vibration signals and detect any bearing damage. Yu et al. 11 also successfully implemented a fault diagnosis on the roller bearings by adopting the empirical mode decomposition (EMD) energy entropy and artificial neural network (ANN) methods to analyze the original acceleration vibration signals. Therefore, vibration analysis is an efficient method for the fault detection and prediction of the BLDC motor.
However, it is difficult to complete a quick and precise fault prediction of deficient historical data and thus requires an additional method to maintain the prediction accuracy of small sample sizes. Gray model (GM) is a popular forecasting technique for small datasets and has been successfully adopted in many forecasting techniques. Yao et al. 12 used GM to predict electric power demands with minimal data inputs. Tian et al. 13 completed a rapid and in-depth fault prediction for chemical processing by adopting GM to forecast the future trend of measurement values based on historical data. Zhang et al. 14 combined GM and the fuzzy set theory to forecast the fault characteristics of mechanical rotating parts. In addition, GM has been successfully used for safety analysis, particularly in the safety assessment of roads 15 and underground transportation systems. 16 However, there is currently a lack of research on the reliability and safety analysis of the BLDC motor based on the comprehensive application of the vibration signal analysis and gray-prediction model. If this objective is fully realized, performance degradation faults in motor processes can be more accurately predicted to rapidly and quantitatively execute safety impact assessments. Consequently, scientific and reasonable safety strategies must be formulated to reduce the occurrence probability of accidents, economic losses, and casualties. Therefore, this study proposed GM-based methods to obtain quick and precise fault predictions and safety assessments for the BLDC motor with a small sample size.
The reminder of this article is organized as follows: In section “Degradation characteristic analysis for the BLDC motor,” the failure modes and potential hazards of the BLDC motor are analyzed and the fault characteristic parameter is determined. In section “The GM for the BLDC motor,” a single variable first-order GM is established, and the level of prediction accuracy is classified. Section “GSAM for the BLDC motor” builds the quantitative relationship among the fault characteristic parameter, the occurrence possibility, and the severity of the accidents to propose the gray safety assessment model (GSAM) for the BLDC motor. In section “Case study,” a case study is provided to analyze and verify the prediction accuracy of GM. In addition, risk classification and elimination strategies for the BLDC motor and its application system are given based on the as low as reasonably practicable (ALARP) principle and the outcome of the safety assessment. In section “Effect evaluation,” the expected safety effects of the proposed fault prediction and safety assessment techniques are evaluated for the proposed fault prediction and safety assessment techniques. Finally, conclusions are outlined in section “Conclusion.”
Degradation characteristic analysis for the BLDC motor
The BLDC motor is generally composed of three major parts, that is, a stator, a rotor, and bearings. The rotor is generally composed of a permanent magnet material, the stator consists of an armature winding and a frame, and the bearings are largely composed of deep groove ball bearings, which are lubricated by solid preparation. The structure of the BLDC motor presented in this article is illustrated in Figure 1.

Structure of the BLDC motor.
Failure mode, effects, and criticality analysis of the BLDC motor
The failure mode, effects, and criticality analysis (FMECA), which is an efficient reliability analysis method, was initially executed to determine the BLDC motor’s fault modes and failure mechanisms. FMECA was first developed for determining failure modes and systematically analyzing their subsequent effects. It has evolved into a significantly essential technique for identifying and eliminating potential failures, thereby enhancing the reliability and safety of certain products or complicated systems.17,18 FMECA is composed of two parts, that is, the failure mode and effects analysis (FMEA) and criticality analysis (CA). In FMEA, all possible failure modes and their potential effects are listed to characterize comprehensive influences based on failure mode possibilities and the severity of its effects in the CA.
The occurrence probabilities and severity classifications of failure modes must be determined to conduct the FMECA. According to previous statistics, 19 the roller bearing faults account for about 40% of motor failures, followed by the figures of stators and rotors, which are at 38% and 10%, respectively. The remaining 12% classifies other supplemental failures. An indicator was proposed—namely, the relative incidence (RI), the occurrence probability percentage of a failure mode in the total probability of given products, or their application systems—to classify the occurrence probability of BLDC motor’s failure modes. The RI definitions and levels are presented in Table 1. In addition, the severity classification of BLDC motor failure modes was obtained based on failure data analysis acquired from practical tests and users, which is presented in Table 2. Finally, the FMECA of the BLDC motor is provided in Table 3.
Classification of occurrence probability.

RI: relative incidence.
Classification of severity.

The FMECA of the BLDC.

F11–F33 are the codes of the failure models; Ft represents high temperature; Fn indicates increasing noise; Fv represents aggravated vibration; Fs represents motor stuck; Fb represents motor burned; and C* for criticality, such that criticality = occurrence × severity.
The criticality matrix of the BLDC motor failure modes is obtained based on FMECA, as illustrated in Figure 2. Based on Figure 2, the occurrence probability and the severity of rolling bearings’ faults are both higher; thus, the roller bearing not only weakens the BLDC motor but also affects the safe operation of the critical component. Therefore, based on the roller bearings faults in the BLDC motor, this study will evaluate the BLDC motor performance degradation using fault predictions and safety assessments.

The criticality matrix of the BLDC motor’s failure modes.
Selection of the degradation characteristic parameter
A characteristic parameter was chosen to present the BLDC motor degradation status given that the rolling bearing was established as the motor’s weakness. The influence of the bearing’s performance degradation on the BLDC motor was primarily presented in three aspects according to Table 3, that is, the aggravated vibration, increased noise level, and high temperature. The noise level and temperature values in the practical experiment were susceptibly impacted by surrounding factors such as human activities and room temperature. Therefore, this study applied the vibration analysis method to relatively decrease any unexpected influences on the motors and allow a more scientific analysis on the degradation process of the BLDC motor. The conventional vibration signal processing techniques can be divided into three branches, that is, the time-domain, frequency-domain, and time–frequency-domain methods. 9 This study adopted the time–frequency-domain method because the vibration characteristics of the BLDC motor depended on multiple factors such as the rotational speed, mechanical looseness, and load. The performance degradation of the BLDC motor resulted in the presence of different phenomena such as the decrease in lubrication performance, aggravated abrasion, and increased mechanical looseness, which exhibited a gradual increase in the energy contained in the vibration signals. Thus, the time–frequency-domain method was adopted to assess the energy of the vibration signals and algorithm structure for vibration signal processing, as illustrated in Figure 3. 20

Algorithm for vibration signal processing.
The Hilbert–Huang transform is a nonstationary signal processing technique that produces a series of intrinsic mode functions (IMFs), denoted as


Vibration signal processing for (a) IMF, (b) time–frequency spectrum, and (c) Hilbert spectrum.
Subsequently, the Hilbert spectrum, marked as
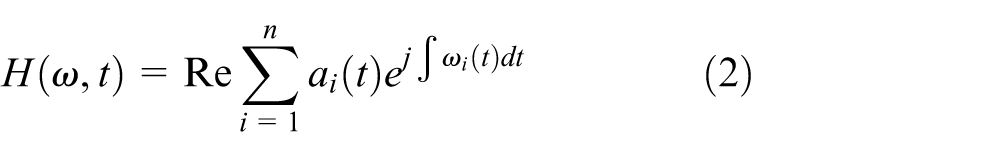
where j is the unit of the imaginary number, and
The energy density of the vibration signal,

where T represents the length of the sampling time. Eventually, the characteristic parameter of the BLDC motor performance degradation is obtained by extracting the frequency-domain energy features, which presents the tendency of the BLDC motor’s performance degradation process as follows

where
The degradation characteristic parameters of the BLDC motor were obtained following vibration signals processing using the above-mentioned methods. The vibration-based fault prediction based on the GM is achieved in the succeeding sections using the obtained data.
The GM for the BLDC motor
GM (1, 1)
The gray system theory was originally proposed to implement predictions from minimal and insufficient information. 21 The single variable first-order GM (GM (1, 1)) is the most significant gray system theory model because of its simple operation process, low data distribution requirements, and computing conditions. Thus, GM (1, 1) is widely applied for the prediction of products or systems such as in generator systems, energy consumption analyses, and environmental vulnerability assessments.22–24 Therefore, this study adopted GM (1, 1) for the BLDC motor failure prediction. The modeling principle and process of the GM (1, 1) is presented in the following sections.
The
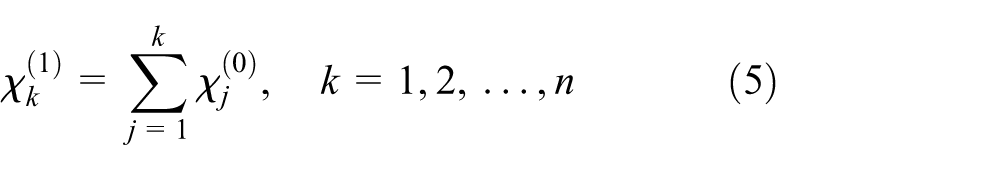
This generated a new data sequence
Second, the written differential equation of the data sequence
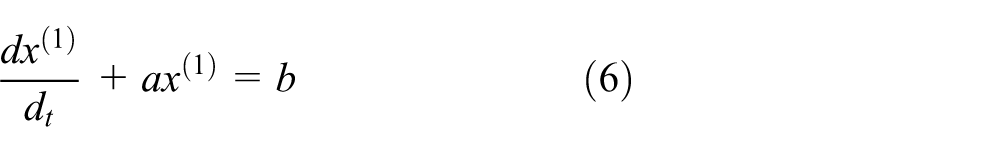
where a is the development coefficient and b is the gray action. Equation (6) is called as the first-order gray differential equation or GM (1, 1). According to the least squares principle, the values of a and b can be evaluated by the following equation as follows

where

The solution for equation (6) can be obtained as follows
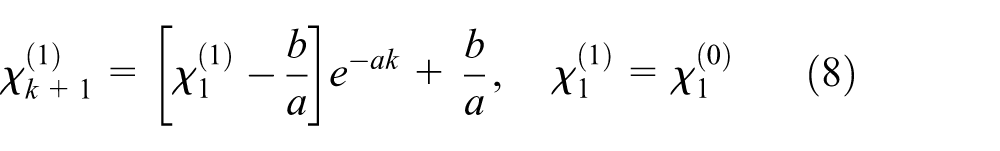
Finally, the regressive reduction operation for the value of

Future vibration data can be forecasted based on historical data and the above-mentioned prediction process of GM (1, 1).
Estimation of the predicted results
This study adopted the posterior test method to estimate the accuracy of the predicted results that were acquired from GM (1, 1). The zero-order residual was first determined as

Based on equation (10), the criteria of posterior test can then be attained.
The posterior error ratio is defined by
Classification of accuracy level.

GSAM for the BLDC motor
The safety status of the BLDC motor was estimated based on BLDC motor vibration conditions following the attainment of predicted vibration data. The safety accident mechanisms of the BLDC motor were first characterized. A variety of theories supported the safety accident mechanisms such as the domino theory, energy transfer theory, track-cross theory, and safety rheology-mutation theory.26–30 The energy transfer theory suggests that accidents are caused by abnormal or unexpected energy transfer. Therefore, the motor accident safety mechanism may be linked to abnormal or unexpected energy transfer (vibrational energy) during operation, thereby resulting in accidents in motors and their application systems. A suitable method was then selected to conduct the safety assessment of the BLDC motor. Two types of safety assessments are presently available among the various engineering fields, namely, the qualitative and quantitative methods. For instance, a quantitative risk assessment was introduced in the aluminum extrusion industry by Marhavilas and Koulouriotis. 31 And Jafari et al. 32 implemented the proportional and decision matrix techniques for a hydrogen generation unit. Al-Anbari et al. 33 recently applied the risk assessment matrix to evaluate the safety condition of building structures. Therefore, this study applied the quantitative safety analysis to generate precise assessment results for the safety decision-making process.
Quantitative safety assessment method
Previous reports have defined the safety risk as a combination of the likelihood and severity of accidents, which is shown as follows

where R is risk value, L is the likelihood of accidents, and S is the severity of the accidents. Equation (11) quantifies the degree of risk. The values of R are classified according to the particular system and safety levels such as safe, abnormal, dangerous, and calamity.
This study characterized the relationship between the GM-based vibration prediction method and the quantitative safety analysis method to generate the GSAM.
Modeling the GSAM
Determination of the severity ratio
Severity is the extent of adverse effects, economic losses, or casualties that are exerted by faults on the products, their application systems, and the surrounding environment. Severe safety accidents can generate a variety of dramatic effects on different systems, though it is difficult to stipulate a fixed value. For example, the severity of BLDC motor accidents in aircrafts is relatively higher than BLDC motor accidents in automobiles. To solve this problem, this study proposed the severity ratio
Quantification criteria of severity.

The number set of severity in Table 5 is
Calculation of the likelihood
Based on the analysis in section “Degradation characteristic analysis for the BLDC motor,” the deviation of the vibration signals represents the principal phenomenon of the proposed BLDC motor performance degradation. Therefore, a relational formula between the occurrence likelihood of the accidents and the performance degradation condition of the BLDC motor was established to quantify the likelihood of accidents. According to the vibration analysis, the vibration energy gradually increased during the BLDC motor degradation process, which thereby increased the occurrence possibility and the severity of accidents correspondingly. In other words, a positive correlation is evinced between the occurrence probability,
According to the bathtub curve theory, a product’s life cycle can be divided into three stages, that is, infant mortality, random failures, and wear-out, which have corresponding failure rates, namely, digressive, relatively constant, and upward, respectively. Failures that occur during BLDC motor’s performance degradation belong to the wear-out stage and exhibit a gradually increasing failure rate. Previous reports have verified the failure rates of many typical motors and rolling bearings that are subject to the two-parameter Weibull distribution.34,35 This study assumed the BLDC motor degradation process to obey the Weibull distribution given that the rolling bearing has been analyzed as a critical component of the BLDC motor. The cumulative failure probability function can then be obtained as follows

where β is the shape parameter and η is the scale parameter. Subsequently, the expression equation of the instantaneous occurrence probability,

Determination of the GSAM
To establish the relationship between the vibration signal,
The first-order derivatives of
Both

Based on equations (11) and (14), the risk value,

This equation is named GSAM, where A and B are unknown parameters. The curves of
Case study
A BLDC motor experiment was executed to collect vibration data and verify the proposed methods. The experiment utilized a computer-controlled signal generator to produce the pulse width modulation (PWM) wave and control the rotation of the BLDC motor by quantitatively regulating the DC. The vibration signals were collected with acceleration sensors and transmitted onto the computer using a data acquisition card. The process of the experiment is illustrated in Figure 5.

Experimental process diagram.
The collected data were processed by first instantaneously extracting a vibration acceleration value (VAV) every 45 min for analysis. A total of 2048 VAVs were taken as the data sampling points to acquire a total of 574 data points. The Hilbert–Huang transform was then executed for each data point to obtain the corresponding frequency-domain energy,

Frequency-domain energy spectrum for the BLDC motor.
In order to shorten the test time, the chosen experimental BLDC motors were run for some time before the test, thereby requiring minimal operation status analysis for a certain period of time. Figure 6 illustrates abnormal BLDC motor vibration phenomena as the sampling point arrives at the roughly 200th point, that is, the ascending energy amplitude and increasing instability. The average value and variation amplitude of the vibration energy gradually rose upon reaching the 400th point (about 300 h into the test). Moreover, the rate exhibited a dramatic increase with time, and the vibration energy value exhibited increasing instability. The degradation of the BLDC motor was initially assumed to enter the wear-out phase of the bathtub curve at the 400th point. Therefore, this study implemented the failure prognosis and safety assessment on the vibration data after the 400th point.
Fault prediction for the BLDC motor
The vibration data were first processed prior to implementing the prediction due to the significant randomness in the vibration data. Convergence processing was first conducted to mitigate the unavoidable experimental errors and reduce random vibration data. The original data exhibited nonlinear curve fitting, which allowed data tendency characteristic values (noted as

Raw data convergence processing.
The former 87 points of the 174 total data points after the 400th point were taken as the original sequence,
Comparison of the converged data,

According to Table 6, the accuracy evaluation of predicted values is performed as follows:
Posterior error ratio
Small error possibility
In addition, a comparison analysis was conducted to highlight the GM attributes for small sample sizes using the support vector machine (SVM) and the back propagation artificial neural network (BP-ANN), which are commonly used in the vibration-based fault prediction technique.11,35,36 The assessment results of the three methods were obtained based on the same prediction means and experimental data (Table 7).
Prediction accuracy levels of GM, SVM, and BP-ANN.

GM: gray model; SVM: support vector machine; BP-ANN: back propagation artificial neural network.
As can be seen, the prediction accuracy of GM is much better than that of the others under the condition of few historical data, that is, only 87 input samples. And the accuracy level of GM can be classified as Wonderful according to Table 4, so GM can be used to implement extrapolation prediction for the future data with small sample size. As a result, when the predicted value
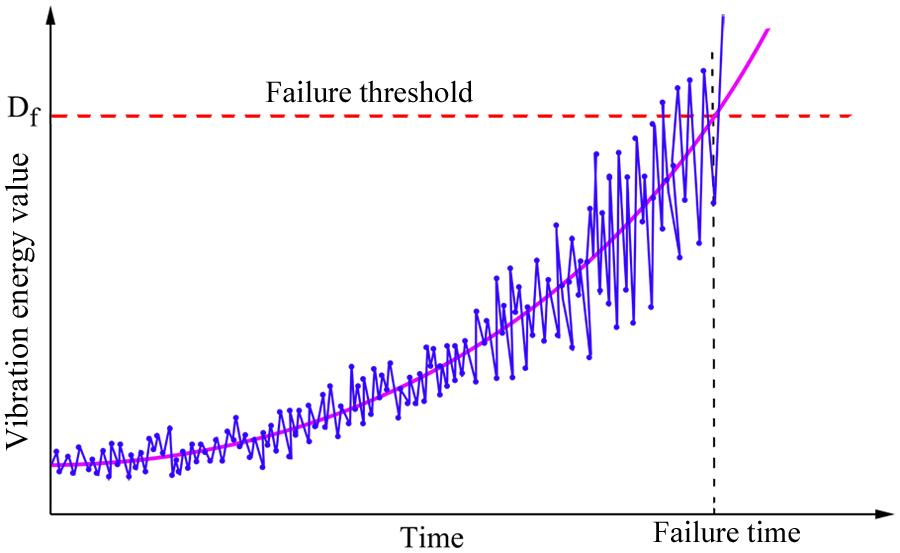
Failure prediction diagram.
Gray safety assessment for the BLDC motor
The distribution function for the degradation process of the motors was first generated to conduct the safety assessment on the BLDC motor. A two-parameter Weibull function was applied to obtain the following parameter values:
where i is the ordinal of the sampling points. The distribution of the CPF is presented in Figure 9(a).

(a) CPF distribution of the BLDC motor and (b) fitting curves of
Figure 9(a) illustrates the accidental failure stage, wherein the failure rate of the BLDC motor is basically a constant value. As the sampling point approximately reached the 400th point, the occurrence possibility of the failure gradually increased, where we assumed that the parameter values of the Weibull function fell in line with the experimental data results. Therefore, the values of
Based on

The scatter diagram of the values of

(a) Distribution diagrams of
The risk value,
As the drive devices of their application systems, motors are usually kept as key components. However, as faults such as cracks or lubrication leakages occur during high-speed operations, chain-reaction accidents occur and often result in an emergence shutdowns or catastrophic collapses in the whole system. Take the electric vehicle (EV) as an example. Cracks in the driving motor would result in vibration aggravation, and temperature increases during running time. For same-level systems, the breakage or overreaction of EV batteries may be triggered by the fault, thereby resulting in fire or explosion. Higher system-level faults may lead to sudden EV power control loss and may result in terrible traffic accidents. Therefore, the risks of different severity levels in motors may correspondingly present problems in their application systems given that the motor is a subsystem of its application system. In other words, safety strategies for the motor itself and its application systems can be formulated correspondingly by implementing safety assessments for motors in real time.
Safety strategies
According to the ALARP principle, the BLDC motor’s probable risk can be divided into one to seven regions based on the distribution of risk value,
Risk classification and safety strategies.

ALARP: as low as reasonably practicable.
Effect evaluation
According to previous statistics,39,40 about 250 million accidents occur per year on a global scale, of which a third of the accidents were caused by mechanical equipment failure. China has about 5–6 times more mechanical accidents than developed countries and is confronted with a more serious situation that has resulted in an economic loss of about RMB 200 billion per year and maintenance costs of up to RMB 800 billion per year. Therefore, it is necessary to execute more comprehensive, in-depth fault predictions and safety assessments on mechanical equipment, especially in China.
Motors are important driving devices and are principal parts of various mechanical equipment. An effective fault prediction approach and safety assessment can greatly reduce maintenance costs and accident losses. Some studies have verified that after adopting vibration monitoring technology, maintenance costs can be reduced by 25%, accident incidences can be reduced by 75%, and the safety assessment technique can contribute about 1.58% toward the economic growth rate. 41 Therefore, the effects of fault prediction and safety assessment techniques on the BLDC motor were evaluated from both the macroscopic and microscopic aspects, respectively.
Macroscopic effect
According to the statistics of the National Bureau of Statistics of the People’s Republic of China, the growth rate of the average gross domestic product (GDP) is approximately 7.8% with the average GDP value of about RMB 583,775m in China over the past 5 years. The equation of safety economy effect (SEE) is proposed as follows

where MC is the maintenance cost per year, DR is the decreased rate of maintenance costs benefited from fault prediction technique,
In terms of reducing casualties, 27 million accidents in 2015 caused 26,000 deaths in China. The number is anticipated to decrease by about 1000 deaths in China based on the total number of machinery accidents and the execution effectiveness of the fault prediction and safety assessments on mechanical equipment. In addition, immeasurable indirect economic losses may occur given that accidents can damage a company’s reputation.
Each year, China produces a great number of BLDC motors, up to a billion or more. Therefore, economic contributions based on the proposed fault prediction and safety assessment methods are expected to account for a significant proportion in the overall SEE. At the same time, the proposed methods can also greatly reduce the number of casualties and other indirect economic losses caused by BLDC motor accidents.
Microscopic effect
The BLDC motor has been widely used in many products, particularly in automobiles. Given that automobiles are an important means of transport, this study analyzed the microscopic effects of the proposed methods on the automobile. According to statistics, over 70 BLDC motors are employed in cars such as the starter motor, the electronic steering motor, the electronic handbrake motor, electronic parking brake motor, and the electric windows motor. Automobile failure sources and risk indicators can be determined using the statistics from the State Administration of Work Safety of China if human factors are excluded. In addition, the BLDC motor executes different roles in the subsystems of an automobile. Therefore, the influence weights were allocated based on the impact degree of the BLDC motor on various failure causes, as presented in Table 9.
Automobile failure sources and risk indicators.

Based on Table 9, the effects of the fault prediction and safety assessment techniques of the BLDC motor can be quantified as follows:
Falling rate of failure

Falling rate of economic loss

Falling rate of mortality (assuming no casualties, if the fault elimination rate is 100%)
Based on the proposed methods, we can then conclude that car accident incidents are expected to decrease by 41.65%, death rates by 21.77%, and economic loss rates by 4.55%, respectively. Therefore, the implementation of fault predictions and safety assessment techniques for the BLDC motor can greatly reduce the fault incidence, mortality, and economic losses of automobile accidents.
Conclusion
This study adopted a vibration analysis method to analyze the performance degradation of the BLDC motor and determine the VFDE as the fault characteristic of the presented degradation process. GM (1, 1) was then utilized to forecast future data based on the VFDE, which was taken as the original sequence to implement the fault prediction for the BLDC motor. In addition, the GSAM was proposed to achieve a fast and dynamic safety assessment by monitoring BLDC motor vibration signals. Safety strategies were provided based on the outcome of the safety assessment. The conclusions are presented as follows:
The VFDE was deemed the characteristic value in the presented degradation process. The GM was adopted to predict faults with a satisfactory prediction accuracy, thereby allowing the wide application of the fault prediction technique for the BLDC motor and other rotating machinery.
The proposed GSAM was effectively used in the dynamic quantitative safety assessment and monitoring of the motor’s vibration signals to formulate safety strategies, which can better solve difficulties in real-time motor safety assessments in engineering.
The proposed techniques and strategies can generate remarkable safety effects such as decreasing failure incidence, mortality, and economic losses on both the microscopic and the macroscopic levels.
Footnotes
Academic Editor: Yangmin Li
Declaration of conflicting interests
The author(s) declared no potential conflicts of interest with respect to the research, authorship, and/or publication of this article.
Funding
The author(s) disclosed receipt of the following financial support for the research, authorship, and/or publication of this article: This work was supported by the Fundamental Research Funds for the Central Universities (grant number YWF-14-WRJS-002) and Aero-Science Fund (grant numbers 2014ZC51031 and 2015ZD51044).