
Abstract
The mechanism of surface topography formation of Inconel 718 in low-speed wire electrical discharge machining was studied, and its on-line prediction based on acoustic emission detection technology is carried out. An optimized truncated cone-shaped thermal conduction model considering the scattering velocity difference between electrons and ions was put forward. Based on this model, discharge craters and temperature variation at different discharge energy conditions were systematically discussed in finite element analysis. Experimentally, five machining regimes that are reduced in accordance with the discharge energy were conducted with acoustic emission detection technology in low-speed wire electrical discharge machining. A novel denoising method has been proposed, which combines filtering analysis and Fast Fourier Transform. The experimental results indicate that acoustic emission testing technique provides great technical support in researching the discharge energy variation rule in low-speed wire electrical discharge machining. It is also concluded that the change trends of the theoretically calculated temperature in the discharge channel and acoustic emission signal root mean square and the surface roughness value and the acoustic emission signal root mean square show a similar exponential growth law. A regression equation about the arithmetic mean roughness (Ra) values and root mean square values of acoustic emission is established to predict surface roughness value Ra whose error is less than 1%.
Keywords
Introduction
MF Huang et al. 1 described that surface topography is of great significance to assess the surface quality of parts because it is closely related to wear resistance, corrosion resistance, fatigue strength, and so on. B Izquierdo et al. 2 learned that for nickel-based alloys, it will be more meaningful to research the surface topography due to the demanding requirements of its industrial application areas, such as turbine blades, aircraft, liquid fuel rocket motor, nuclear reactors, and pumps. Its poor thermal conductivity, high-strength values, and self-hardening behavior lead to many tough challenges such as severe plastic deformation, tool wear, high cutting force, and temperature. Hence, YB Guo and colleagues3,4 found that nickel-based alloys such as Inconel 718 are difficult to be machined by conventional manufacturing techniques such as turning, milling, and grinding.
Unlike traditional technique, namely, mechanical cutting, the advantages of low-speed wire electrical discharge machining (WEDM-LS) are non-contact and low force characteristics, making it an alternative competitive method to manufacture nickel-based alloys and many other hard or brittle conductive materials, such as quenched steels, titanium alloys, cemented carbide, conductive ceramics, and many other hard or brittle conductive materials, as described by A Klink et al., 5 F Klocke et al., 6 X Cheng et al., 7 and B Lauwers et al. 8 The wire electrode with the feed motion is used to cut the workpiece through the spark discharge between the workpiece in WEDM, as shown in Figure 1. The speed of copper wire along single direction in WEDM-LS is lower than 0.2 m/s, eliminating the effects of electrode wire wears on machining accuracy. Therefore, WEDM-LS can achieve much better surface quality than high-speed wire electrical discharge machining (WEDM-HS), whose wire is reciprocating with a speed range of 8–10 m/s.

Schematic diagram of WEDM-LS.
In WEDM-LS, the plasma channels always generate along with the appearance of sparks and the temperature may be higher than 10,000°C. Because of the minor diameter of the copper wire electrode (0.2 mm), WEDM-LS can cut micro corner and narrow kerfs. A Aliasa and B Abdullaha 9 found that as the machine feed rate increases, the kerf width decreases. The experimental results showed that the kerf width is 0.3335, 0.3320, and 0.3317 mm with different machine feed rates of 2, 4, and 6 mm/min, respectively.
However, high-temperature phenomena and narrow kerfs cutting cause two problems. One is the formation of a heat-affected zone with upper thin discontinuous white layer subjected to a tensile stress, micro-crack, porosity, partial surface hardening, grain coarsening, and alloying. The other is the on-line monitoring problem of WEDM-LS process because of its narrow kerfs and pretty high temperature.
A Hascalik and U Caydas 10 and L Li et al. 11 summarized that the thickness of white layer in main cut can be diminished or minimized through subsequent multiple trim cuts at reduced discharge energy by controlling the main impact parameters, such as pulse on time, pulse off time, and peak current. Since there are great difficulties in on-line testing, numerical simulation has become an important method to research the discharge process of WEDM-LS; besides, B Izquierdo et al. 12 found that by analyzing the temperature distribution, the size and shape of discharge crater can be estimated. ZG Huang and ZN Guo, 13 PT Eubank et al., 14 H Xia et al., 15 L Jian et al., 16 and LL Yu et al. 17 have done much work to study the thermal process, but in most of them the shape of the plasma channel is regarded as a cylinder. Through considering the formation mechanism of the plasma channel, a novel truncated cone-shaped thermal conduction model more closer to the truth is put forward in this article.
Acoustic emission (AE) testing technology is insensitive to structure dimension; 18 therefore, it overcomes two problems mentioned above in WEDM-LS. AEs are defined as transient elastic waves generated from a rapid release of strain energy caused by deformation of damage within or on the surface of the workpiece. This mechanical process can be produced by different sources such as cracks, plastic deformation, rubbing, cavitations, and leakage. 19 These surface and inner displacement can be detected by AE sensor, and then the mechanical signals can be transformed into the electrical ones which are amplified and processed, as described by SJ Li and D Cui. 20 However, ST Jilani and PC Pandey 21 found that there are many other factors that can cause AEs during the machining process in WEDM-LS, such as the surge pressure when there is a dielectric breakdown, pressure variation because of the appearance of bubbles in the plasma channel or caused by the vibration of plasma, and pressure waves given out during the workpiece material removal process. All these influence factors are closely related to discharge intensity. Considering the decisive effect that discharge energy impacts the machined surface topography, it is obvious that there are some internal relation between surface topography and AE phenomenon. The relevant literatures at home and abroad show that the surface morphology and the thickness of the white layer are important indicators to evaluate the quality of the machined surface, but there is no theoretical relation model between them. The measurements of both surface topography and white layer thickness consume a lot of time. Therefore, AE testing technology employed in the on-line testing of surface topography and white layer thickness can significantly improve testing efficiency. Up to date, AE technology has not been applied in on-line testing during WEDM-LS process. So it is necessary to establish a compelling theory to solve the uncertainty about AE signal features coming from machining process. And high scattered data in the literature also indicate that further study is necessary for a better understanding of WEDM-LS process.
Therefore, the aim of this study is to investigate the mechanism of surface topography formation of Inconel 718 in WEDM-LS and its on-line prediction based on the relation with some characterization parameters of AE signals. At the same time, cone-shaped thermal conduction model could show the influence of discharge energy on surface topography theoretically by considering the formation mechanism of plasma channel. Both finite element analysis based on this conduction model and the experiment employing AE technology in WEDM-LS are conducted under five different discharge energy levels. The results presented in this study show that discharge energy has crucial effects on both surface topography and intensity of AE signals. It is an effective method to predict surface roughness value according to the regression equation between surface roughness values and the root mean square (RMS) values of AE signals.
Truncated cone-shaped thermal conduction model
It is well known that WEDM-LS process is much complicated when combined with numerous phenomena, but it can be considered as a thermal dominant process, which is summarized by A Singh and A Ghosh 19 and ST Jilani and PC Pandey. 21 Numerical simulation has become an effective method in researching temperature distribution, and it is essential to build a heat conduction model that considers the most possible influence factors in simulation study. The input heat in this model represents discharge energy transferred to electrode materials. Whatever the model is, the next three factors need to be defined: they are partition coefficient of discharge energy, size shape of the conduction model, and criterion for material removal.
Partition coefficient of discharge energy
The energy distribution in WEDM-LS can be shown as the following equation

where

Energy distribution in WEDM-LS.
Scholars worldwide have done a lot of research; A Ramamurthy et al. 22 conducted a measurement by energy dispersive X-ray spectroscopy analysis, which could observe the effect of discharge energy directly on brass wire electrode and workpiece. PT Eubank et al. 14 regard this coefficient as constant and their theoretically calculated values are 40% for anode and 20% for cathode in WEDM process. 15 The results both theoretically and experimentally show that the ratio of energy absorbed by the anode and cathode is approximately 2:1.15,23,24 In this research, the adopted energy partition coefficient is 40% for anode and 20% for cathode.
The size and shape of thermal conduction model
In WEDM-LS, the discharge channel forms immediately after the breakdown of dielectric fluid. High speed electrons, ions and particles collide with each other to produce a large amount of energy on the surface of the electrode, therefore the surface temperature of the workpiece electrode rises rapidly, reaching the melting point of the electrode material. The charged particles accelerated under the effect of electric field head for the cathode and anode during the pulse on time. Due to the narrow pulse width of WEDM-LS, the workpiece is connected to the anode of pulse power supply to acquire a higher material remove rate; this is because the electron is so light that it is much easier to be accelerated in such a short period of time.
In most of the literatures, a cylindrical heat source is well accepted. B Perez et al. 25 concluded an exponential function which is adopted to describe the relationship between the pulse width and the cathode radius in this cylindrical heat source

where Rp is the radius of the discharge channel and t is the pulse on time. The parameters obtained in calorimetric experiment analysis (
LW Qi et al. 26 found that as a matter of fact, the plasma channel is not in the shape of a standard cylinder technically. The motion of charged particles is driven by electric force, meanwhile constrained by electromagnetic force. During one pulse on time, the electrons move to the anode, and the positively charged particles to the cathode with extremely high speed. Scattering happens when there are fierce collisions between those high-speed particles, whose density gradient, mass, and velocity are the main influence factors. In contrast, electron scattering is more intense. The results demonstrate that diffusion occurs on both sides of the discharge channel while dominated by anode scattering. Therefore, as shown in Figure 3, the horn shape can vividly describe the plasma at equilibrium.

Shape of discharge channel.
Hence, it is inaccurate to regard the plasma shape as a cylinder; a truncated cone model closer to the reality in this article is put forward based on the formation mechanism of the plasma channel, and its longitudinal plane is shown in Figure 4, where g is the discharge gap,


Longitudinal section of discharge channel.
However, in this research, it is the temperature distribution of the workpiece anode material that is investigated in WEDM-LS. Therefore, the anode radius of the plasma channel needs to be determined first. According to the ratio of energy conducted to the anode and cathode (2:1) and the hypothesis that energy distribution function is the same in every cross section of the plasma channel, the following equation can be obtained

where q is the energy distribution function, A is the cross-sectional area, and R is the radius of plasma channel.
According to equation (4), to determine the anode radius (

Gaussian heat source model.
If the maximum axial heat flux
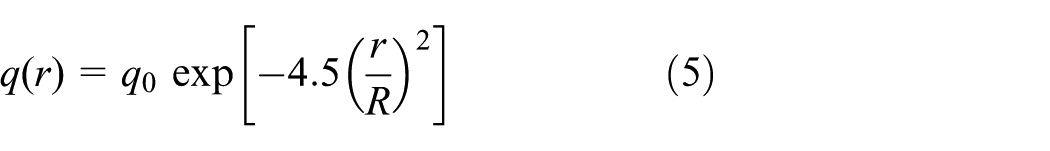
According to the hypothesis that a single pulse only generates one spark charge, equation (5) could be rewritten as
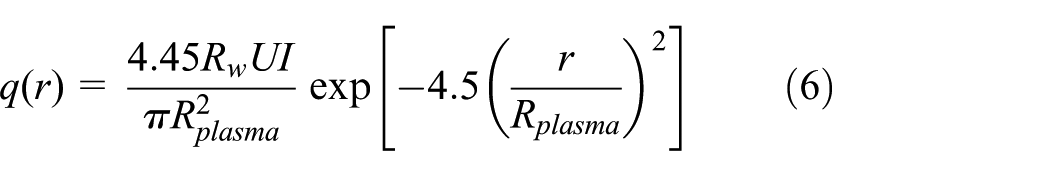
where U is the discharge voltage, I is the discharge current, Rw is the partition coefficient of energy, and
Criterion for material removal
The material removal criterion that leads to crater formation is another important factor to be studied. Some researchers believe that all the molten and vaporized material will be removed. Another so-called overheating theory is put forward to explain the removal process, that is, the overpressure of plasma prevents the material from boiling during pulse on time. When the end of the discharge, due to the inertia of the liquid medium, the bubble continues to expand resulting in a sharp reduction in the pressure inside the bubble, the formation of a local vacuum, so that the molten metal material from the crater splash and was thrown. An equivalent temperature Teq is adopted by B Izquierdo et al. 2 to describe the removal criterion that materials with temperature higher than Teq will be removed. In this research, the workpiece material with a temperature above its melting point will be removed during the machining process.
Finite element analysis based on the thermal conduction model
Analytical model of finite element analysis
In WEDM-LS, it is more significant to study the workpiece than the wire electrode as it moves with low-speed unidirectional; thus, the finite element model proposed by FZ Han et al. 28 is suitable for analysis of the workpiece as shown in Figure 6. The parameters of the discharge channel are based on the assumption of longitudinal shape as shown in Figure 4. For each micro element inside the workpiece, whose center locates in point P, a differential equation about thermal equilibrium can be written as follows

where r,

where rw is the radius of the wire. In area 2, there is energy exchange between the workpiece and dielectric fluid. However, in area 1, there is the heat input of discharge energy besides heat convection. As for the workpiece itself, heat transfers from high to low temperature, and the thermal equilibrium equations can be written as follows:
If
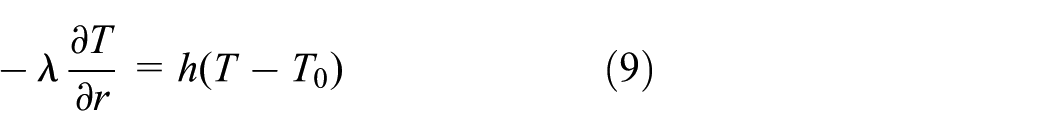
If

where T0 is the environment temperature and h is the convective heat transfer coefficient.

Thermal analysis model for WEDM-LS.
According to Figure 6, the boundary condition equations can be written as follows with the assumption that the original point locates at the discharging channel center

Modeling and loading by ANSYS thermal analysis
It is impossible to obtain the analytical solution of the nonlinear differential equation under such complicated boundary conditions. Therefore, based on the above model, transient thermal analysis is carried out by ANSYS software and the assumptions are listed as follows: 29
The working area is considered circular symmetric.
The workpiece material is homogeneous and isotropous.
Latent heat is not taken into consideration for it has little effect on the simulation results.
Thermal energy is transferred into workpiece through heat conduction.
The material over the critical temperature (Teq) will be removed during WEDM-LS process.
The discharge current and voltage remain constant during pulse on time.
This simulation does not consider the effect of short circuit and arc.
The movement or jumping of the discharge channel is not taken into account, although they may have influence on surface qualities.
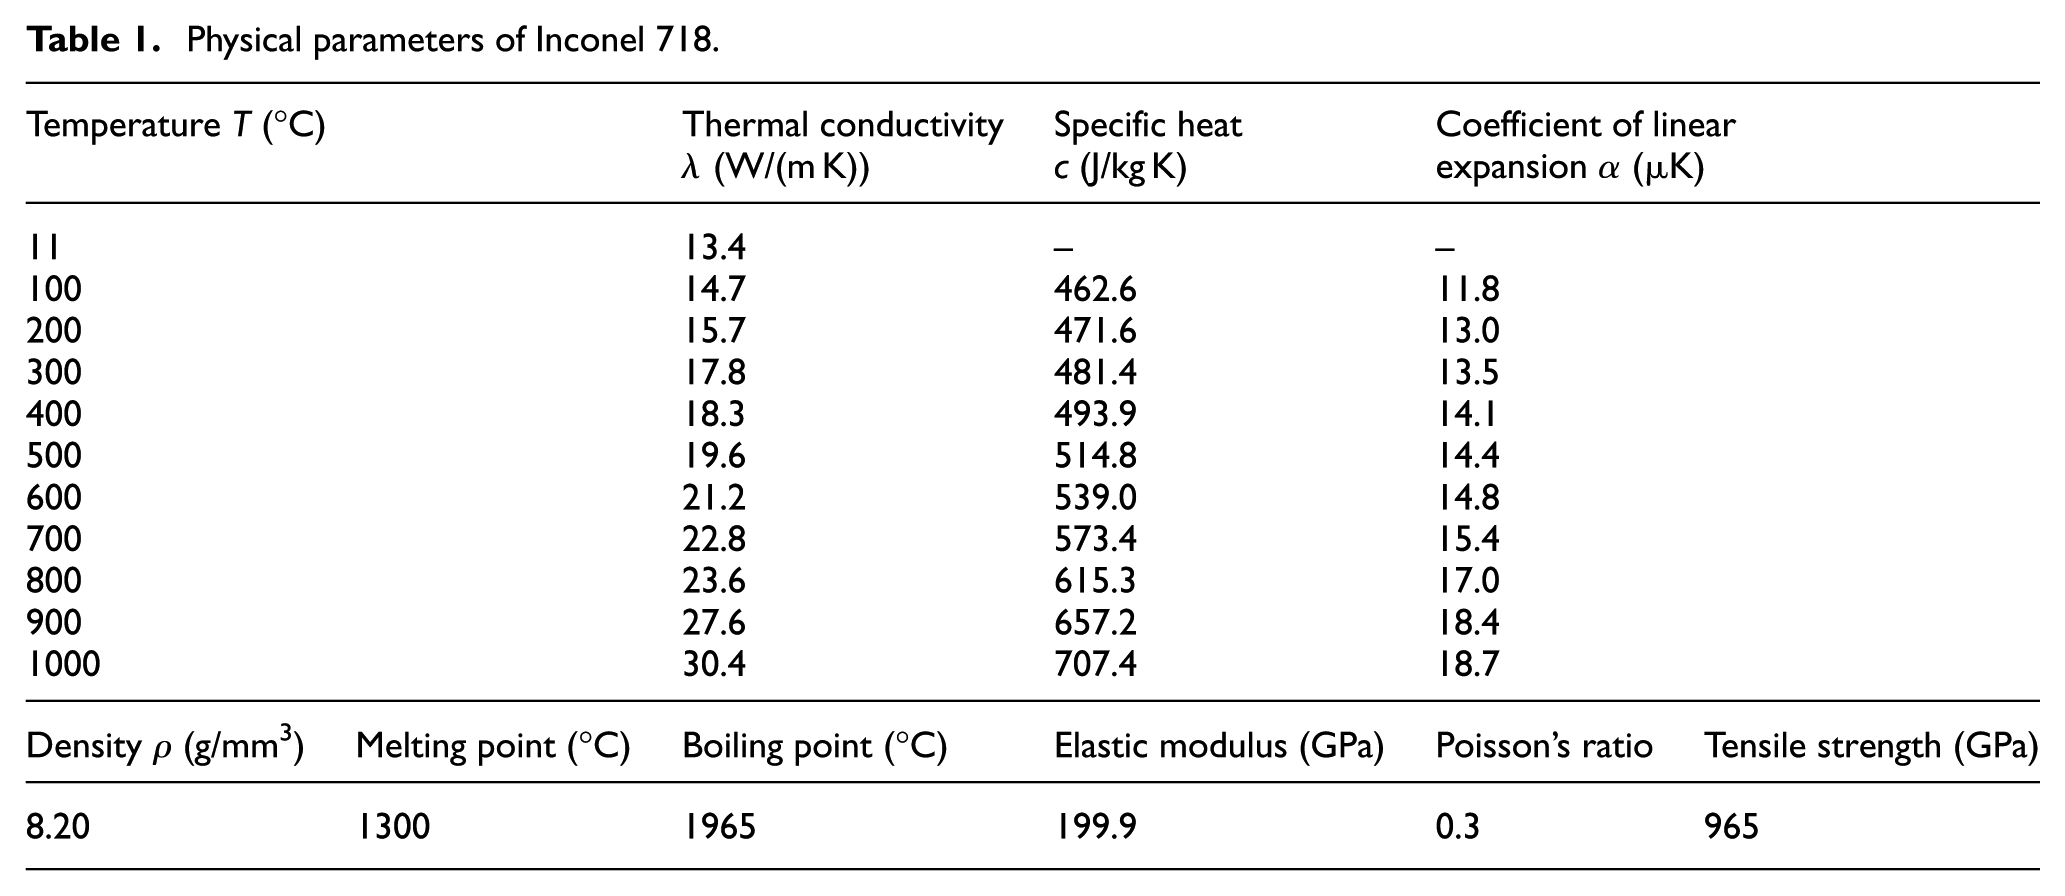
A cylinder with a diameter of 3 mm and height of 1.5 mm is created in ANSYS software representing part of the workpiece. According to above assumptions 1 and 2, this model can be simplified to a square with 1.5 mm length because of its rotational symmetry to save a lot of solution time and memory space in computer. There is large temperature gradient in the discharge channel during WEDM-LS process, so some parameters of Inconel 718 at different temperatures are needed to acquire higher analysis precision. A continuous function curve can be obtained by only inputting a few discrete function values in ANSYS, as shown in Table 1.
Physical parameters of Inconel 718.
There are four kinds of thermal loads in ANSYS software including heat flux, convection, conduction, and radiation. Thermal radiation, which has little effect on the simulation process, can be ignored. According to above assumptions 3, 4, and 6, heat flux and convection are applied on the surface in the discharge channel while there is only heat convection outside the channel. However, according to the research of FZ Han et al., 28 the convection coefficient inside the plasma differs from the outside, as listed in Table 2. In addition, the heat flux at different locations in the channel as well as along the radius of the discharge channel near the anode can be acquired using equations (1)–(6). It is the heat flux function load applied in the plasma area that represents the energy transferred into the anode. Four identical process parameters considered in the different machining process are shown in Table 3.
Convective coefficient at different positions.

Simulation parameters.

Analysis of simulation results
Different conditions are simulated in ANSYS software and the temperature nephogram is depicted, as shown in Figure 7. It can be concluded that the maximum temperature in the plasma channel can reach to 10,000°C and it drops when pulse on time decreases. The highest temperature drops dramatically when pulse on time ranges from 20 to 15 µs, but it drops slowly when pulse on time ranges from 15 to 5 µs. Hence, when duty cycle of pulse signal keeps constant, the maximum temperature is closely related to pulse on time. Because longer pulse width means more electrons will strike on the workpiece surface, releasing more thermal energy.
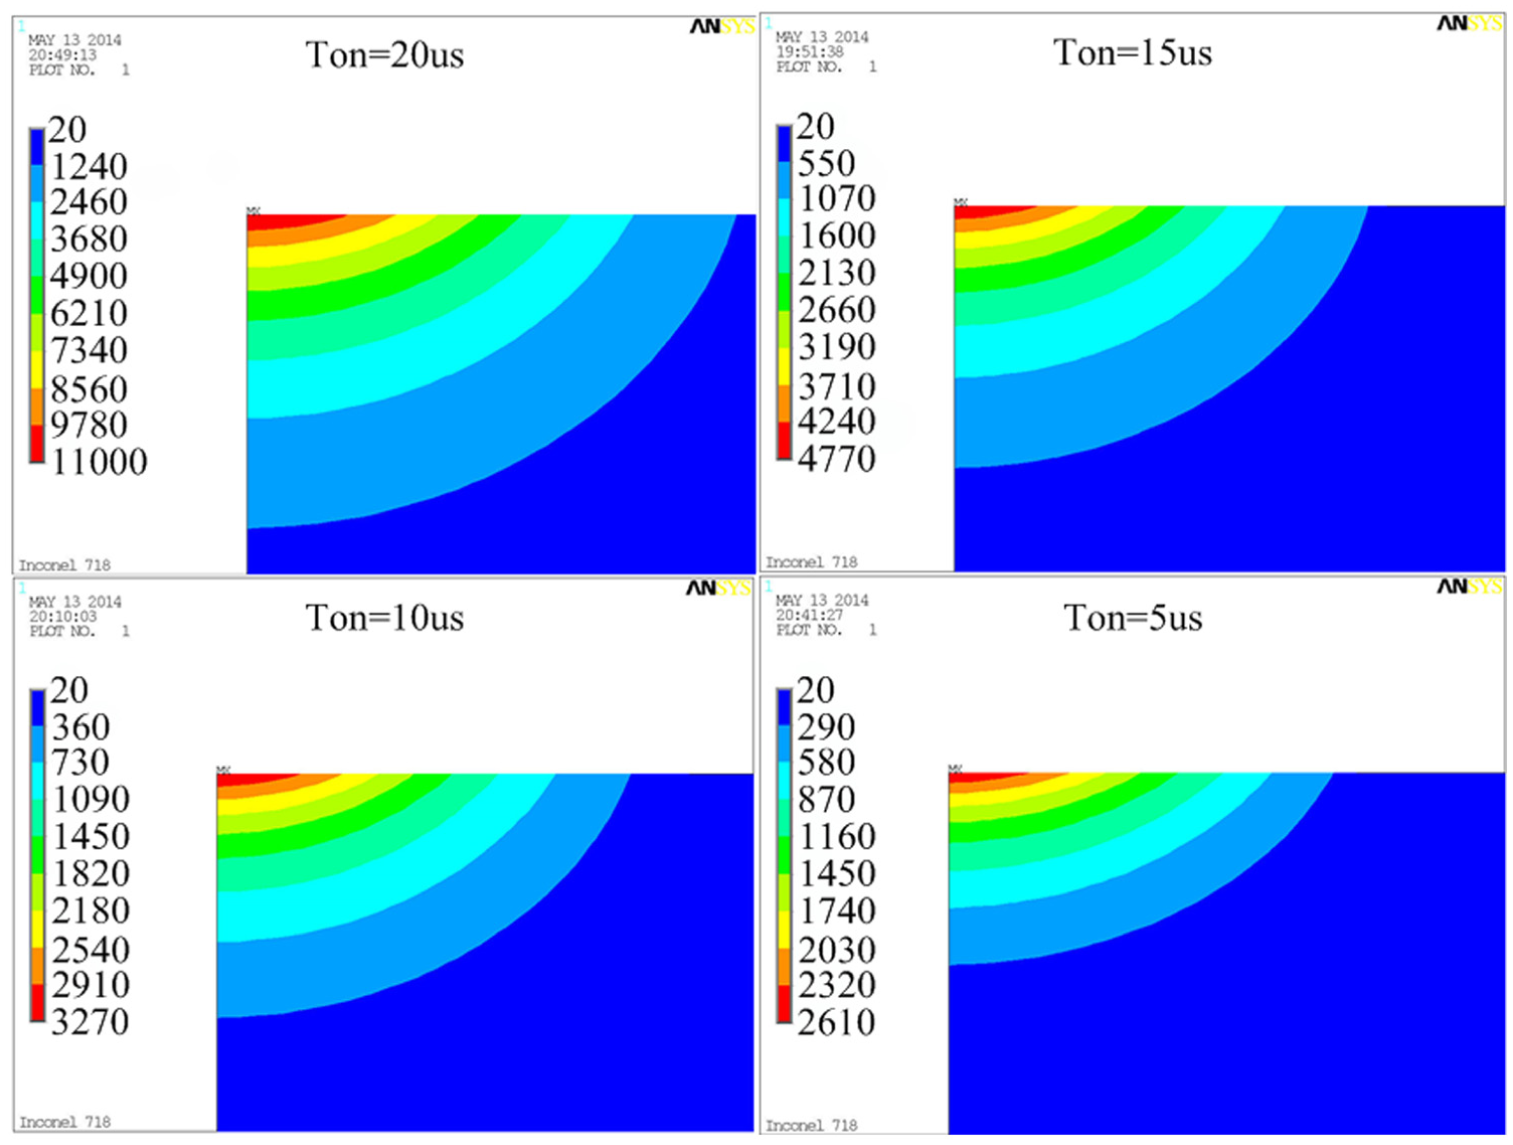
Temperature distributions of different conditions.
According to the above criterion of material removal of assumption 5, Inconel 718 will be removed when the temperature is higher than the melting point (1300°C) during the discharge machining process in Figure 8. The discharge crater appears like a flat sphere and the crater depth is smaller than the pithead’s radius, which means energy transfers faster on the surface of the workpiece than inside. During the post-processing in ANSYS software, the measured crater depth is 14.50, 9.85, 8.82 and 4.38 µm respectively when pulse on time ranges from 20 to 15 µs. These simulated discharge craters can be used to estimate the topography of machining surface by combining its overlapping mechanism and machining feed rate.
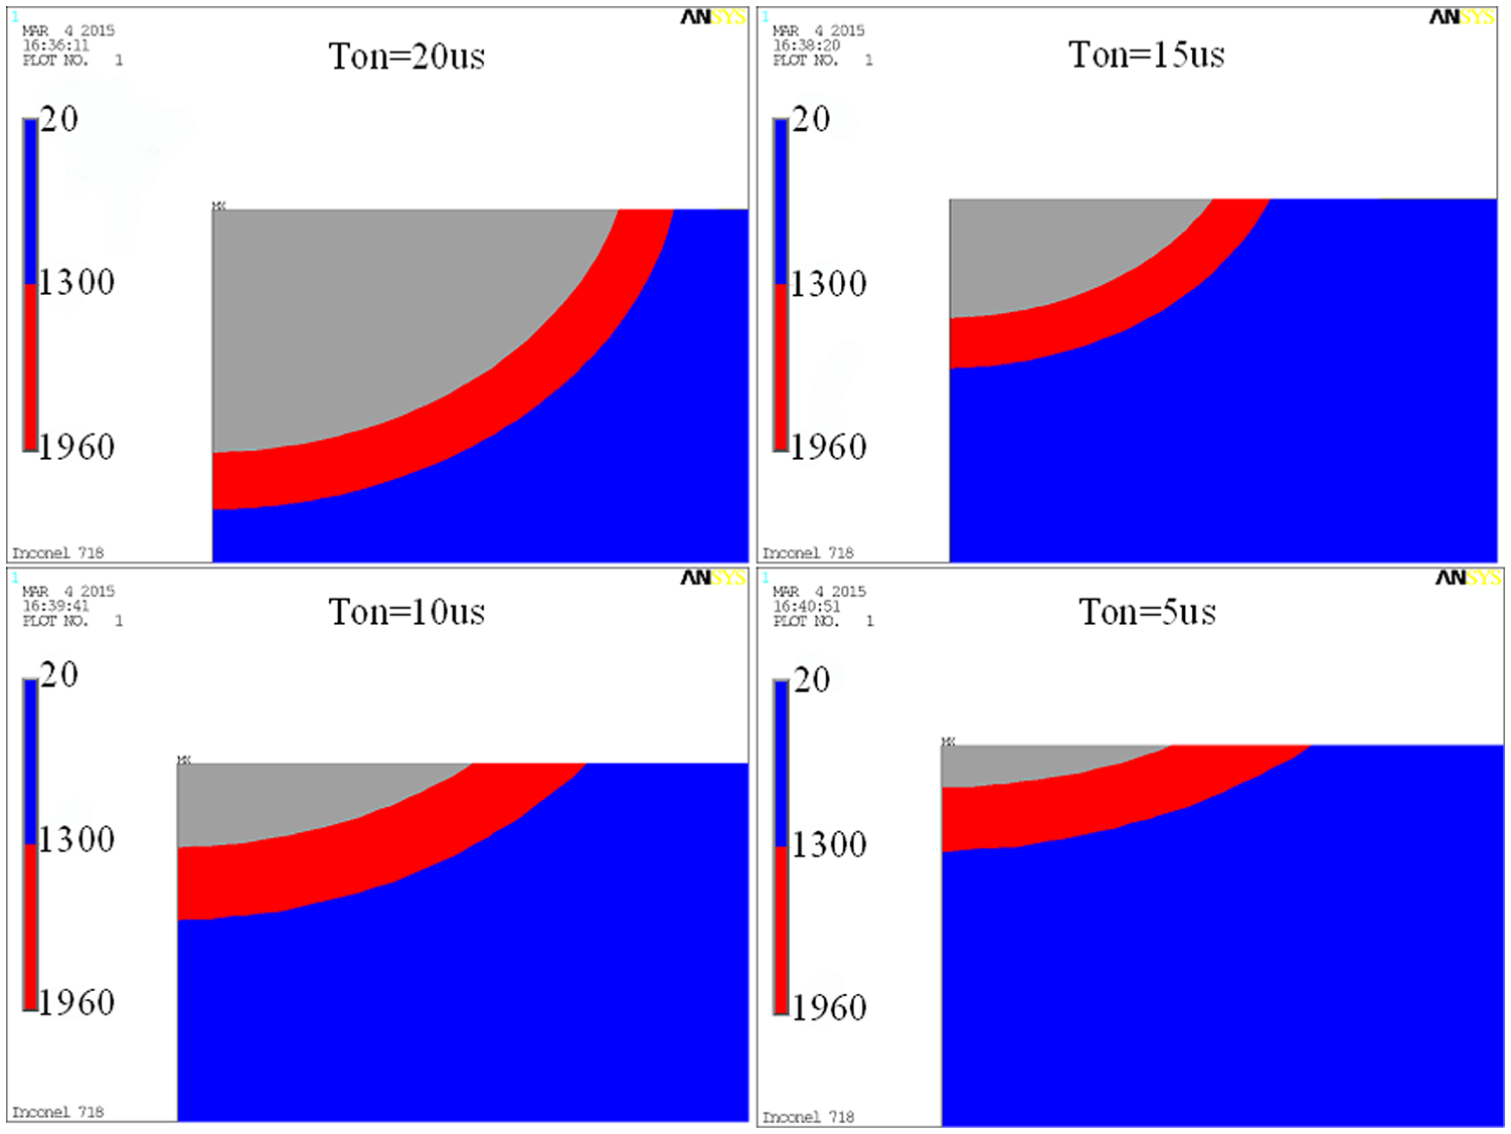
Isothermal diagram of melting and boiling points.
In Figure 8, it can be easily seen from the isothermal that most of the removed materials are vaporized by the ultra-high discharge energy when pulse on time is 20 µs, while the materials are mainly melt when pulse on time ranges from 15 to 5 µs. Therefore, 20 µs can be regarded as a threshold of distinction between a vaporization and fusion dominant machining process.
Figure 9 depicts the temperature variation during 20 µs pulse on time, which shows that the temperature of the plasma channel at the beginning has a larger change rate, and the temperature of plasma reaches its maximum value at the end of pulse on time. This phenomenon can be used to analyze the intensity of AE signal collected in the experiment. Besides, the simulated temperature at different times is relevant to AE signals as described in section “Experimental verification of the theoretical calculation of the discharge channel temperature.” According to the ratio of depth to diameter equation (ration of depth to diameter equals to the ration of pit depth to diameter), the ratio’s variation trend indicates that a sharper hole is obtained as the discharge energy increases as shown in Figure 10.

Temperature curve of discharge channel center.

The relation between ratio of pit depth and diameter and pulse on time.
Experiment setup
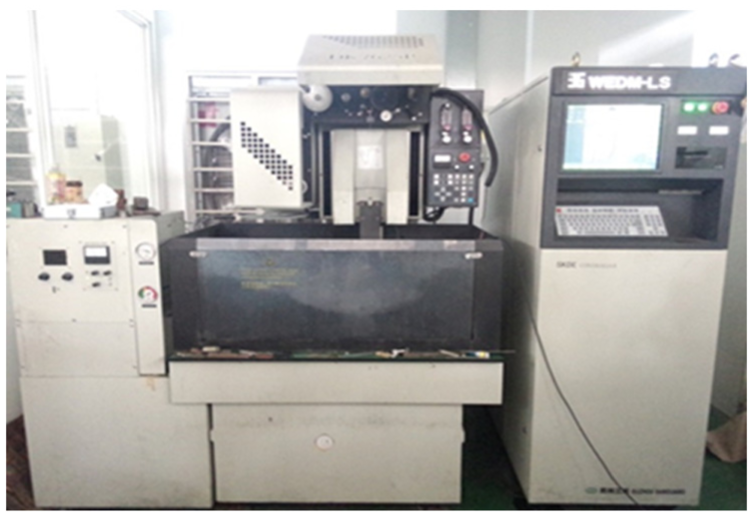
WEDM-LS experiment of Inconel 718 has been conducted on a low-speed wire cut electrical discharge machine model DK7625P made in Suzhou Sanguang Science & Technology Co. Ltd (China). The maximum stroke of the working table is 380 mm × 260 mm, The maximum cutting thickness is 240 mm, and the best surface roughness value Ra is 0.8. The deionized water and copper wire electrode with a diameter of 0.2 mm have been utilized in the experiment. The AE sensor collects the elastic waves which was fixed at the appropriate distance from the workpiece during the machining process, and the multifunction data acquisition (model PXIe-6368, sampling speed: 2 M/s/ch) embedded in test case (model PXIe-1075) is used to transform the elastic waves into AE signals and amplify them. The equipment layout is shown in Figures 11–14. The collected AE signals are transmitted through an I/O junction box model NI SCB-68 to a balance controller and then to the acquisition card. The DAQ program written in LabVIEW collects the data which will be saved to mobile hard disk drive. Surface roughness has been measured with a Taylor Hobson contact profilometer. Two- and three-dimensional topographies of the machined surface have been obtained using Keyence VHX-2000 microscope system. The shape of the specimen is cylindrical with
Block diagram of monitoring system.

Hardware setup of WEDM.
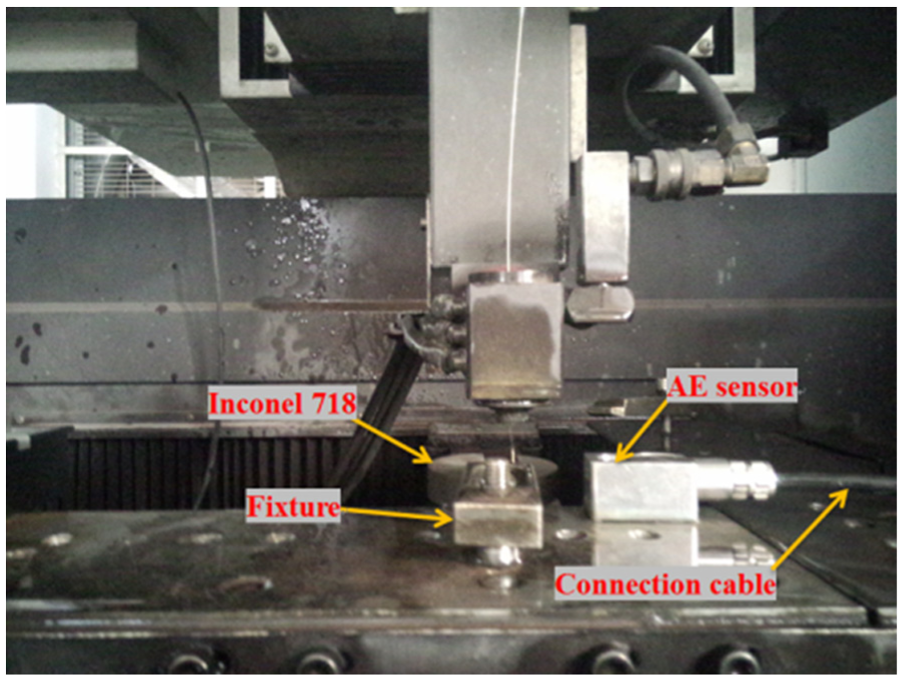
Local picture of WEDM processing.

Connection layout of AE monitoring system.
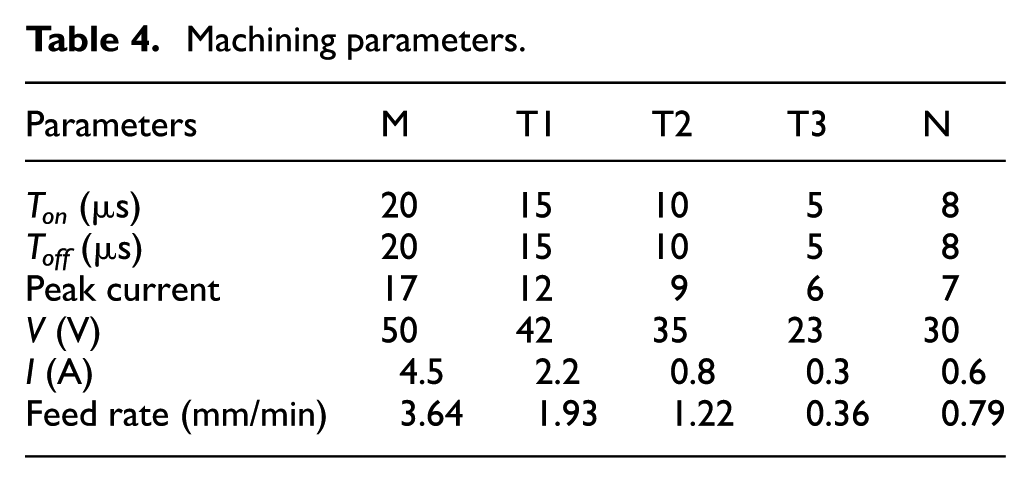
The pulse width and pulse current have an implicit relationship with the actual voltage and current which determine the discharge energy.11,30 Therefore, the performed process consists of a main cut (M) and subsequent three trim cuts (T1, T2, and T3) each at reduced discharge energy by controlling three parameters: pulse on time, pulse off time, and peak current. A confirmatory experiment (N) is also conducted. To detect the surface quality of all these five WEDM-LS regimes, the experiments were carried out separately instead of on a same surface. The measured voltage, discharge current, and wire feed rate values are also listed in Table 4.
Machining parameters.
Results and analysis
Mechanism of surface topography formation in WEDM-LS
For traditional machining methods, surface roughness exists mainly because there is vibration, built-up edge, friction, and many other factors. 31 While the formation mechanism of surface roughness is different in WEDM-LS because there is no contact between wire electrode and workpiece. Every spark discharge will leave a crater on the workpiece surface, surface topography forms when thousands of craters overlap with each other, and some melted materials resolidify on the machined surface, as shown in Figure 15, which indicates a close relation between the depth of discharge crater, machine feed speed, and white layer thickness.

Formation mechanism of surface topography in WEDM-LS.
The measured values of M regime along and perpendicular to the wire are 1.6337 and 1.6328 µm, respectively. The equivalent roughness value along two directions indicates that surface directionality is negligible. That is because the ultra-high frequency of pulse power supply in WEDM-LS leads to the micro movement of copper wire along feed direction during one pulse period. Therefore, overlapping mechanisms along wire axial and feed direction are almost the same; thus, there are no apparent difference on surface roughness value along two directions.
Quantitative analysis of Rt values in WEDM-LS
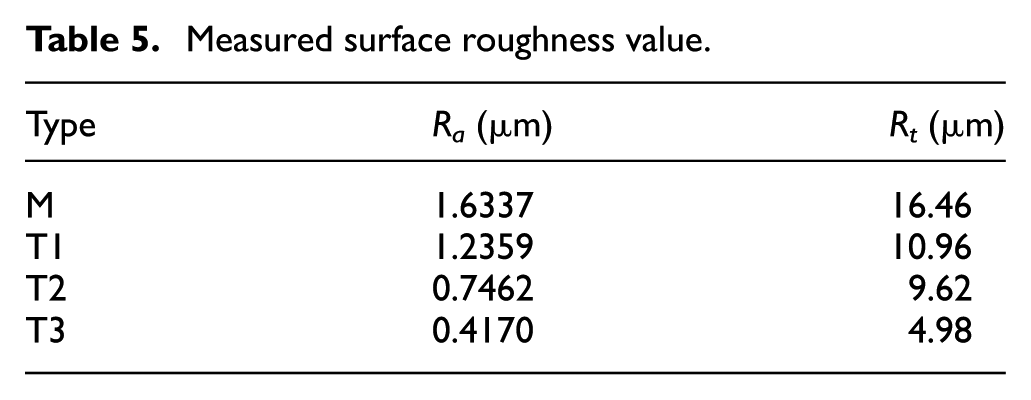
Figure 16 represents the machined workpiece surfaces under different conditions. Table 5 shows arithmetic mean roughness value (Ra) and maximum peak to valley height (Rt) measured along the direction perpendicular to the electrode wire. When Ra was measured, the evaluation length was 8 mm while the cut-off length was 10 mm. The cut-off length is the thickness of the specimen cut by the wire tool while the evaluation length is the distance of detection pin attached with Taylor Hobson surface roughness measuring instrument. The measured Rt values and simulated crater depth are shown in Figure 17.
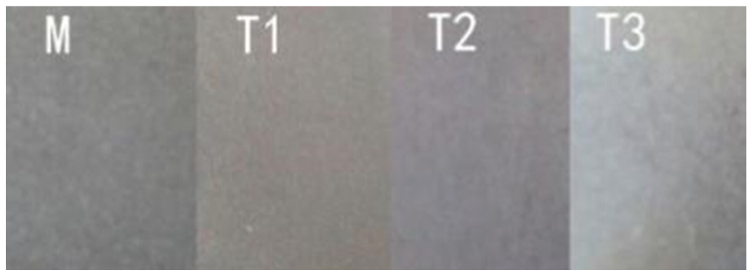
Sample workpiece surfaces.
Measured surface roughness value.

The comparison of experimental and simulation results.
It should be noted that Rt values are always smaller than crater depth values due to the fact that the surface topography is shaped by overlapping craters in WEDM as shown in Figure 15. As mentioned before, there exists some internal relationship between crater depth, Rt values, and wire feed rate. In WEDM-LS, the movement of the wire electrode indicates discharge position change. The distance of wire movement during one pulse period Sw is shown in the following equation

where Vw is the wire feed speed and T is the pulse period. Then another series of discharge happens during the next pulse on time.
For example, in M regime, Vw = 3.64 mm/min, T = Ton+Toff = 40 µs, and crater depth h = 14.50 µm. According to equation (12), Sw = 2.43 µm. It means that two adjacent craters with shapes similar to the simulations overlap with each other as shown in Figure 18. If there is no melted material recast on the machined surface, the simulated
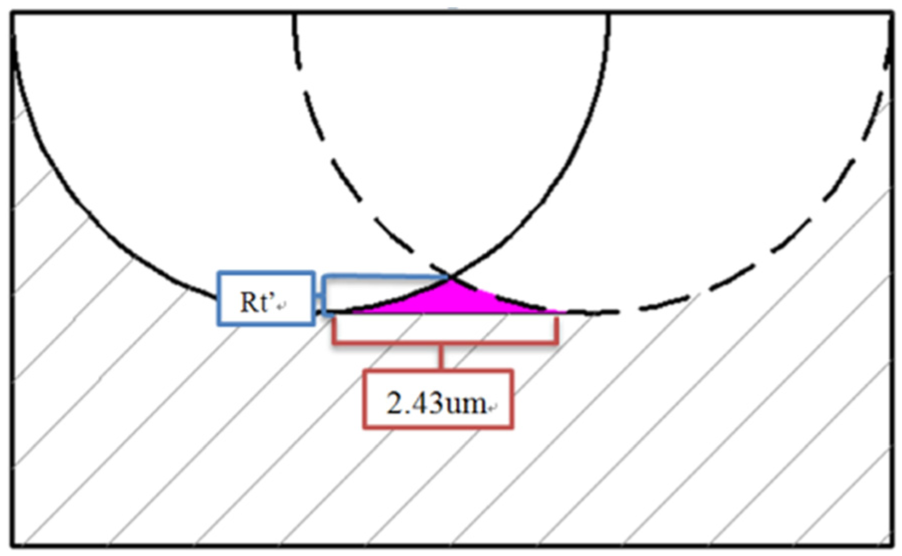
Schematic diagram of simulated
The average white layer thickness can be calculated by the following empirical equation 32

where AWLT is the average white layer thickness (µm), I is the discharge current (A), and t is the pulse on time (s). Then according to the parameters listed in Table 4, the average white layer thickness of these five machining regimes is, respectively, 16.27, 11.34, 6.81, and 3.84 µm.
In regime M, the difference between Rt and

where h(Rt) is the Rt value and h(

Therefore, the white layer material has significant impact on machined surface topography in WEDM-LS. Besides, there exists tensile stress in the workpiece surface because of the white layer material. 33 A very effective way to reduce the surface roughness value in WEDM-LS is to minimize the thickness of white layer material as much as possible.
Comparative analysis of experimental discharge craters with simulated results
Figures 19 and 20 are measured with Keyence VHX-2000 microscopic system (amplification: 3000×). It is obvious that as the discharge energy decreases, the surface roughness value is smaller as shown in Figure 18. Those re-solidified material drops form from the quick water quenching of vaporized or molten material, especially in Figure 19(a) and (b). The color shade in Figure 20(a)–(d) shows that the white layers are discontinuous and non-uniform. In WEDM-LS, the size of the crater is significantly influenced by discharge energy in Figure 20. From main cut (Figure 20(a)) to trim cuts (Figure 20(b)–(d)), as the discharge energy decreases, the peak to valley values sharply reduced from 16.670 to 3.858 µm. In Figure 20, it can be concluded that discharge crater has a shape of ellipsoid, that is, the depth of crater is smaller than the radius of pithead, which is in good agreement with the simulated result.

2D surface topography microscope photographs (3000×): (a) M, (b) T1, (c) T2, and (d) T3.

3D topographic map of four different regimes (3000×): (a) M, (b) T1, (c) T2, and (d) T3.
AE signal processing and analysis in WEDM-LS
In this WEDM-LS machining experiment, the acquisition time of each machining regime is set to 300 s. Because the data acquired during per acquisition time are extremely huge, it is divided into 100 segments, and the LabVIEW procedure read only one segment each time. Figures 21–24 depict the original AE signal waveform graphs detected in 1.5 s when machining four regimes (M, T1, T2, and T3).

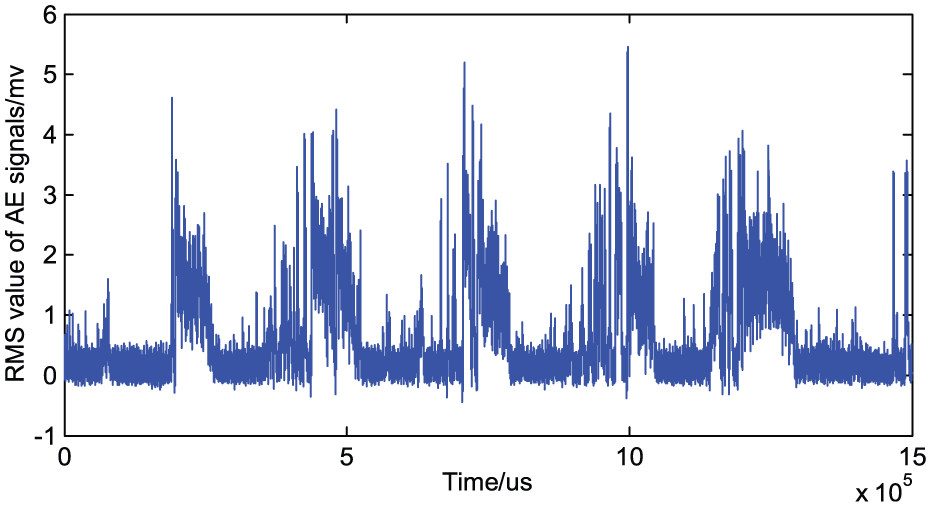
Waveform graph of regime M.

Waveform graph of regime T1.

Waveform graph of regime T2.
Waveform graph of regime T3.
In this work, AE signals in relation to discharge machining are valuable, but there exist many noisy sources during the discharge process. The noises in the AE signals in WEDM-LS may come from the following sources: 34
Distorted signal components beyond the limits of mechanism in the signal acquisition process;
Residual, periodic electronic noise generated or captured in the electronic components;
Noises coming from the impaction of dielectric fluid and the vibration of machine.
The frequency distribution can be obtained by spectrum analysis of the original AE signals. The frequencies of noisy signals can be determined by analyzing the spectrum; thus, these noise components can be eliminated by filtering processing. Any signal can be regarded as the overlapping of sine signals of different frequencies. Discrete Fourier Transform (DFT) is a mathematical tool which transforms sequential data in time axis to the spectral data in frequency as shown in equation (16). And Fast Fourier Transform (FFT) is an effective numerical computation method to realize the DFT of signals. The calculation time of applying FFT or not is

where F(t) is the time function, T is the time span which is divided into N sections averagely, n and m are less than or equal to (N − 1), and Fm is the value of each section.
A block diagram of the proposed method is shown in Figure 25. It consists of the following steps:
AE signal acquisition;
Signal denoising using filter analysis;
Frequency domain conversion applying the FFT;
Peak search to identify the peaks that indicate the signals related to the discharge process.

Flow chart of the proposed method.
The spectrum of the acquired AE signals is shown in Figure 26. It can be concluded that during the machining process, the acquired AE signals have high signal noise ratio due to the small amplitude of low frequency as shown in Figure 26. To exclude the negative influence of these noises, a high-pass filter is used during the acquisition process on line.
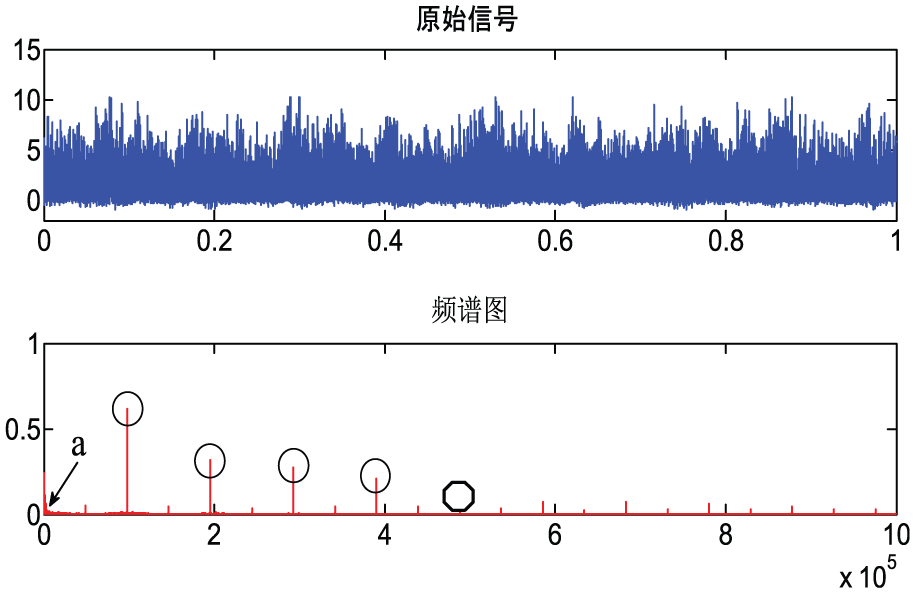
Spectrum of AE signal of regime M.
The prominent peaks represent the signal frequencies closely related to the discharge machining process. There are mainly five different kinds of frequency components, which are 1 × 10⁵, 1.9 × 10⁵, 2.8 × 10⁵, 3.7 × 10⁵, and 4.8 × 10⁵ Hz. But none of these frequencies is the same as the pulse period of regime M, which is 2.5 × 10⁴ Hz. Further studies still need to be conducted to determine their physical meanings.
The mean square value can be used to describe signal intensity or average power defined as follows
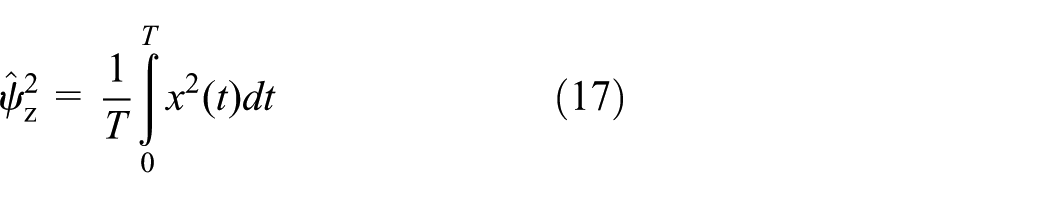
where x(t) is the sample record of random signal and T is the time of sample record. Its RMS value
Figure 27 shows the detailed waveform of regime M to research the variation pattern of AE signal during one pulse period. It is obvious that there appears peak periodically. That is because the breakdown of dielectric gives off more energy when forming the plasma channel which is in accordance with the simulation result that there is greater change rate about temperature at the same time. Therefore, AE testing technique provides great technical support in researching the discharge energy variation rule in WEDM-LS.
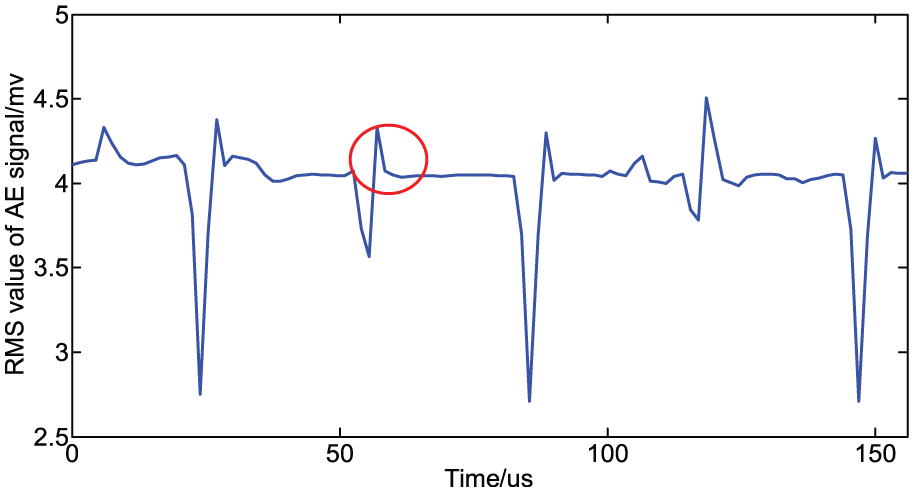
Part of AE signal in regime M.
Relationship between AE signal RMS and Ra values based on regression analysis
According to Table 6, a scatter plot with surface roughness value as the ordinate and the RMS values of AE signals as abscissa is drawn as shown in Figure 28.
Surface roughness value and RMS.

RMS: root mean square.

Scatter diagram of experimental data.
With the aid of curve fit technique in MATLAB, the exponential regression equation can be established as Figure 29

where x is the RMS value and y is the surface roughness value of the workpiece. The R2 value for equation (18) is approximately equal to 1 at 95% confidence level. Sum of squares for error (SSE) value for y is 1.746e−17. The regime (N) WEDM-LS experiment is also carried out and the experimental parameters are shown in Table 4 to verify the mathematical model. The measured surface roughness Ra is 0.5847 µm and RMS value is 1.13. According to equation (18), the corresponding surface roughness value is 0.5590 µm. The prediction error is 0.79%, less than 1%. Therefore, high-precision mathematical model can be used in on-line surface roughness value detection to improve machining efficiency, because it can eliminate the time of assembling and disassembling.

Exponential fitting curve between Ra and AE signal RMS.
Experimental verification of the theoretical calculation of the discharge channel temperature
During pulse discharge in WEDM process, the medium ionization in discharge channel instantly generates high temperature and then passes on to the surface of the workpiece to achieve material melting erosion effect. But the actual temperature in the discharge channel is difficult to be measured on line by the existing sensor directly. The temperature curve of the discharge channel center calculated by ANSYS software shown in Figure 9 can only be tested and verified by indirect measurement method.
The RMS value of the AE signal in WEDM-LS process is reflected by the energy of the discharge process. According to the four experimental results of Tables 4 and 6, the relationship between RMS values and pulse on time is shown in Figure 30.

Relationship between RMS values and pulse on time.
According to Figures 9 and 30, it can be seen that both the temperature of the discharge channel and the RMS value of AE signal increase with the discharge time, so the relationship between the temperature in discharge channel and the RMS value is obtained, as shown in Figure 31.

Relationship between the temperature in discharge channel and the RMS value of AE signals.
The fitting curve equation obtained from Figure 31 is shown in equation (19)

From the experimental results in Figure 29 (equation (18)) and the simulation results in Figure 31 (equation (19)), it can be concluded that the change trends of the theoretically calculated temperature in the discharge channel and AE signal RMS and the change trends of the surface roughness value test by experiment and the AE signal RMS show a similar exponential growth law. So the AE signal detection on line verifies the correctness of the temperature value by ANSYS simulation calculation.
Conclusion
This work explores the formation mechanism of surface topography of Inconel 718 in WEDM-LS theoretically and experimentally. The following conclusions can be drawn:
The optimized truncated cone-shaped thermal conduction model was put forward and used in ANSYS simulation. The result shows a positive correlation between the maximum temperature and pulse on time, and the maximum temperature can reach 10,000°C. For Inconel 718, the pulse width of 20 µs is a threshold to determine whether it is a vaporization or fusion dominant material removal process.
The difference between experimental and simulated crater depth substantiates that there is some molten material adhered to the machined workpiece surface, increasing the measured Ra values. The increment of Ra values almost equals to the depth of the white layers under the same machining regime. In addition, the discharge crater has a shape like semi-ellipsoid whose depth is less than the radius of pithead.
There is a very little difference in surface roughness values along parallel or perpendicular to the wire axis direction, proving that the machined material microstructure is uniform.
The relationship between AE signal RMS and Ra values based on regression analysis is established. It is also concluded that the change trends of the theoretically calculated temperature in the discharge channel and AE signal RMS and the change trends of the surface roughness value test by experiment and the AE signal RMS show a similar exponential growth law. A regression equation about the arithmetic mean roughness (Ra) values and RMS values of AE is established to predict surface roughness value Ra whose error is less than 1%.
Footnotes
Academic Editor: J Paulo Davim
Declaration of conflicting interests
The author(s) declared no potential conflicts of interest with respect to the research, authorship, and/or publication of this article.
Funding
The author(s) disclosed receipt of the following financial support for the research, authorship, and/or publication of this article: The authors would like to thank The Innovation and Entrepreneurship Foundation of Jiangsu Province and The Innovation Fund Project for Graduate Student of Shanghai (JWCXSL1302).