
Abstract
Compared to traditional EDM processing, UEDM (Ultrasonic Vibration Assisted EDM) have a great improvement in optimizing discharge environment. In this study, ultrasonic vibration is attached to the electrode. According to the relative positional relationship between the movement path of the electrode tip and the discharge gap, four working states of UEDM are defined. The four working states are the path within the discharge gap, the path in contact with the edge of the discharge gap, part of the electrode end path outside the discharge gap, and the path in contact with the workpiece, respectively. States are analyzed from the effective discharge energy and discharge frequency. A mathematical model for effective discharge energy and surface roughness is established for two conventional working states. The correctness of the theoretical research is verified by experiments. As the experiment results shown, the influence of ultrasonic amplitude on the energy of UEDM is primary, while frequency is secondary. A working state with better discharge stability and higher discharge energy when the electrode end path is in contact with the edge of the discharge gap. In the first three conventional machining states, the surface quality of the workpiece increases with the increase of ultrasonic amplitude and frequency. The study can provide scientific guidance for parameter matching of UEDM.
Introduction
EDM is an unconventional machining method based on electrothermal energy, which plays an important role in manufacturing difficult-to-machine materials. The EDM process is mainly divided into three stages, which are preparation phase for ignition; phase of discharge; interval phase between discharges respectively. 1 After years of research, the roughness mathematical model of EDM has also been relatively mature. 2 During the EDM process, when the voltage between the workpiece and the electrode is high enough to destroy the dielectric strength, the pulse current generated in the discharge gap will help the material to be eroded. However, prolonged processing will cause a large amount of eroded material residue to accumulate in the discharge gap, reducing processing efficiency, and discharge stability.3,4 In order to promote the discharge of residues in the EDM gap and improve the efficiency of EDM, ultrasonic vibration assisted EDM is widely used.
UEDM (Ultrasonic Vibration Assisted EDM) mainly applies vibration of a certain frequency on the electrode or workpiece to improve the machining efficiency. 5 This method rapidly changes the size of the discharge gap through the vibration of the electrode, which helps to promote the circulation of the medium 6 and thus improve the processing efficiency. In recent years, due to the emergence of various detection methods, researchers have a clearer understanding of UEDM. 7 Zhixin et al. 8 combined the advantages of ultrasonic vibration and EDM to process conductive hard materials. Research results show that this combination technology is more efficient and has a smoother surface. Hirao et al. 9 applied ultrasonic vibration with a maximum amplitude of 6 µm assistance to a tool electrode and investigated the effect of different amplitudes on the EDM characteristics in detail. It has been proved that the removal rate was confirmed to increase in proportion with the amplitude. Recently, Wang et al. 10 studied the material erosion mechanism of UEDM and explained the relationship between the erosion volume and the amplitude in the UEDM processing state. Tong et al. 11 studied ultrasonic vibration to assist the workpiece to perform micro-vibration. It was found that ultrasonic vibration improved the effective energy and machining accuracy of electric spark discharge, and the machining effect was best in the environment where the amplitude was almost equal to the discharge gap. Liew et al. 12 investigated a probe-type vibrator to apply vibration to the dielectric to process ceramics. The results show that ultrasonic vibration produces a stirring effect and cavitation, which is conducive to the removal of debris. Srivastava and Pandey 13 applied ultrasonic vibration to the tool electrode and perform cryogenic treatment. It is found that the tool wear rate of UEDM machining is lower. Later, Lin et al. 14 also conducted research on ultrasonic vibration-assisted EDM and got consistent conclusions. They conducted an experimental study on ultrasonic vibration-assisted gas electrical discharge machining. The experiment shows that UEDM has higher material removal rate (MRR), lower electrode wear rate (EWR), and better surface roughness (SR). Goiogana et al. 15 conduct research on blind hole machining with high aspect ratio by using UEDM. It is carried out that UEDM reduced the processing time and raised the accuracy of the workpiece during blinding hole machining. Shabgard et al. 16 proposed a method for developing statistical models. The relationship between machining performance parameters (MRR, tool wear ratio, and SR) in UEDM and EDM machining parameters (pulse current and pulse punctuality) is studied.
Many researchers have been conducted research on UEDM, but there is a lack of a systematic description of the theoretical study that the angle between the main working motion vector of EDM and the ultrasonic amplitude direction is 0°. In this study, the relevant mechanism of UEDM in this situation was analyzed and studied. The basic model and mathematical model are established. The accuracy of the theoretical model is verified through experiments, which provides a theoretical basis and guidance for UEDM.
Theoretical analysis and mathematical model building
Physical model analysis
UEDM mainly uses ultrasonic high-frequency vibration to affect the discharge state of EDM. In the process of processing, when ultrasonic vibration is applied to the tool electrode, the tool electrode mainly has three positional relationships that vibrate up and down based on the working discharge gap, as shown in Figure 1(a). Introducing the time dimension, the moving path of the tool electrode end is shown in Figure 1(b). When different ultrasonic amplitudes act on the tool electrode, there are four types of relative positional relationships between the moving path of the tool electrode end and the discharge gap. The four types determine the four states of UEDM processing, as shown in Figure 1(c).
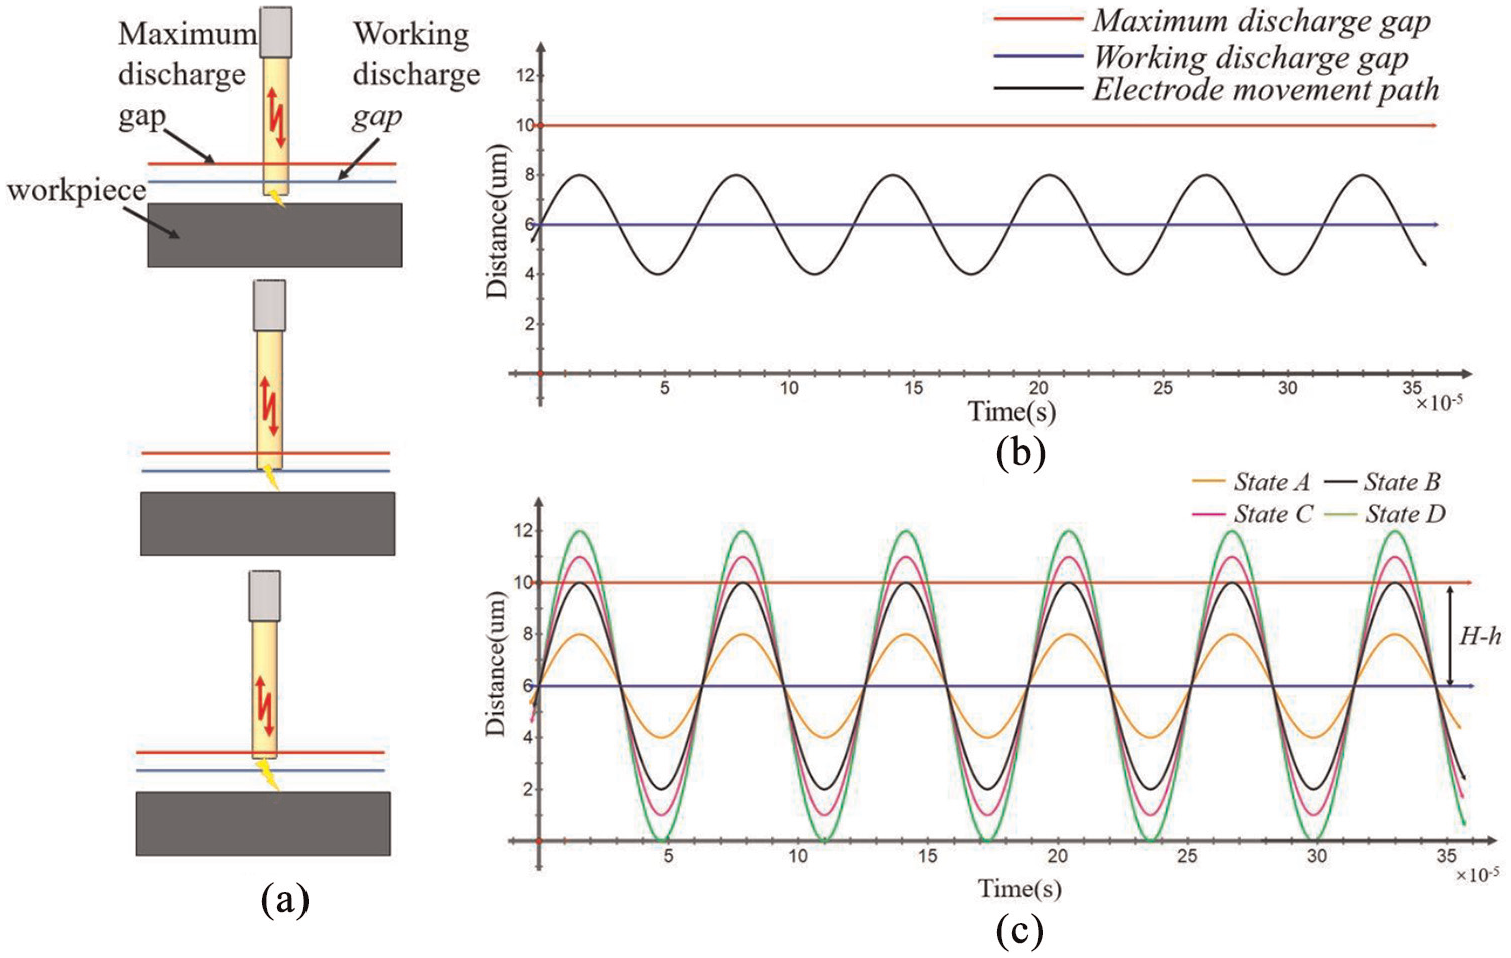
UEDM discharge theoretical model: (a) three positions of a single vibration, (b) the basic working form, and (c) four states of ultrasonic vibration assisted EDM.
The four discharge states are:
State A: The electrode end path is within the discharge gap. During the process of ultrasonic vibration, the electrode maintains the discharge state of the normal electric spark. Discharge current and voltage status are mainly determined by pulsed power. The discharge frequency will be optimized under the interference of ultrasonic vibration, but the change is small. In this state, the difference between UEDM and EDM is mainly the effect of ultrasonic vibration on the gap flow field.
State B: The electrode end path is in contact with the discharge gap. In this state, the ultrasonic vibration destroys the discharge channel of the electric spark. The discharge energy of a single pulse is divided into several parts, which called the equalization effect. When the electrode exits the maximum discharge gap, the discharge channel is disconnected. The electrode enters the maximum discharge gap and the discharge channel is re-established. The discharge points are redistributed during this process and the loss of discharge energy is negligible due to the short enough reconstruction time. The effect of ultrasonic vibration on the gap flow field increases with amplitude increase. The whole process has a positive effect on the removal of residues.
State C: Part of the electrode end path is outside the discharge gap. The path is in the discharge gap, a discharge channel will be formed between the electrode and the workpiece. When the path exceeds the discharge gap, the discharge channel will be broken. The next time the path enters the discharge gap, the energy of the spark pulse discharge is redistributed. The length of time that the electrode tip path leaves the discharge gap is determined by the frequency and amplitude of the ultrasonic vibration. It can be inferred that the energy of a single discharge has decreased and the number of discharges within a pulse has increased.
State D: Electrode end path contacts the workpiece. In this state, the electrode will impact the workpiece with high frequency, thereby forming regular impact marks on the surface of the workpiece. This state is a relatively harsh processing environment in EDM which is not recommended.
Based on the above analysis, it can be found that the first three states are relatively common working states in UEDM, where the electrode end path close to the maximum discharge gap is a better processing condition. In this state, the processing efficiency is higher and the processed surface quality is better.
Mathematical modeling
Effective discharge energy modeling
Based on the analysis results, the classification and discussion are executed. When the electrode end path is within the discharge gap, the discharge environment is similar to the EDM. The basic energy formula 2 is:
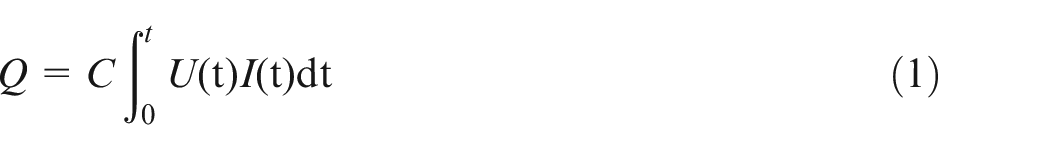
Where Q– Discharge energy (J);
C– Scale factor;
t– Discharge time (s);
U– Pulse voltage (V);
I– Pulse current (A);
When part of the electrode end path is outside the discharge gap, the state of UEDM is shown in Figure 2. The difference between the discharge energy of UEDM and EDM is mainly caused by the electrode end path exceeding the maximum discharge gap. The discharge energy used by the UEDM during the entire machining process can be derived from the discharge time affected by ultrasonic vibration under a single electric spark pulse. Then the derivation formula of the effective discharge energy of UEDM is as follows:
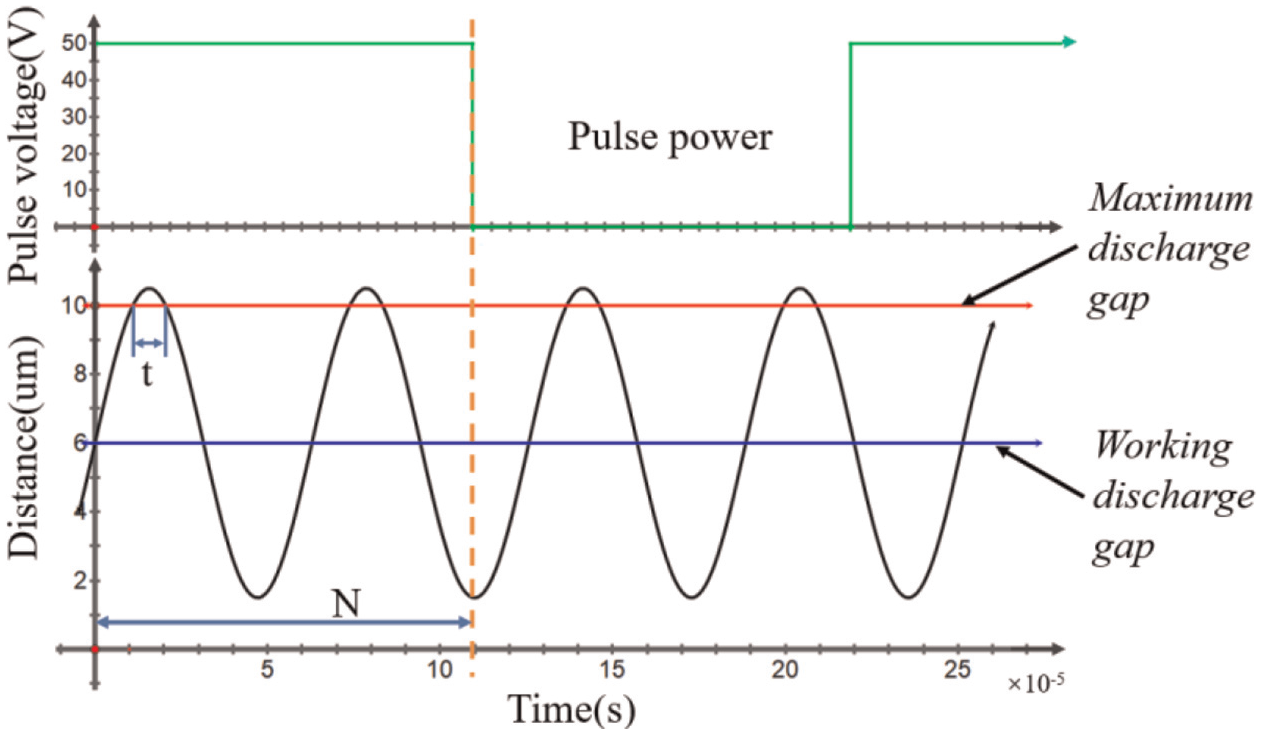
Schematic diagram of ultrasonic vibration affecting discharge time.
The basic formula of ultrasonic vibration 17 is:

Where fu– Ultrasonic vibration frequency (Hz);
A– Amplitude (µm);
The number of times an electrode vibrates within a single pulse width can be defined as:

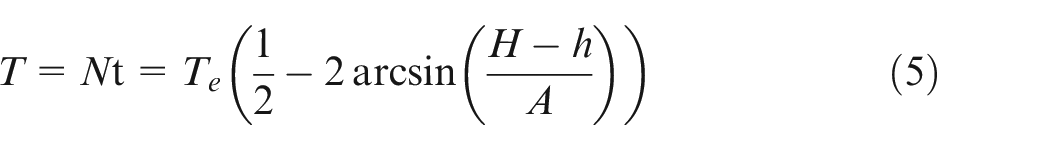
Where Te– Pulse width (s);
fu– Ultrasonic vibration frequency (Hz);
When ultrasonic vibration destroys the discharge channel, the destruction time as the time that the electrode leaves the discharge gap can be set. The effect of a single vibration on the spark discharge time is:
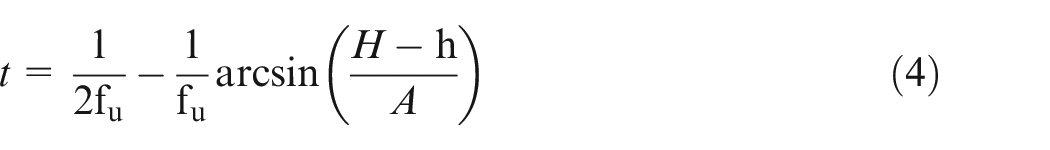
Where H– Maximum discharge gap (µm);
h– Working discharge gap (µm);
fu– Ultrasonic vibration frequency(Hz);
A– Amplitude (µm);
The effect of ultrasonic vibration in a single pulse on EDM processing time is solved as:
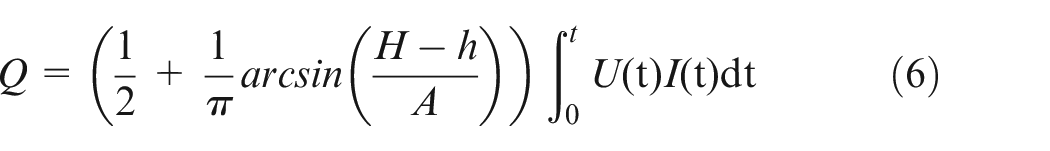
The effective energy of UEDM can be expressed as:
Where U– Pulse voltage (V);
I– Peak current (A);
H – Maximum discharge gap (µm);
h– Working discharge gap (µm);
fu– Ultrasonic vibration frequency (Hz);
A– Amplitude (µm);
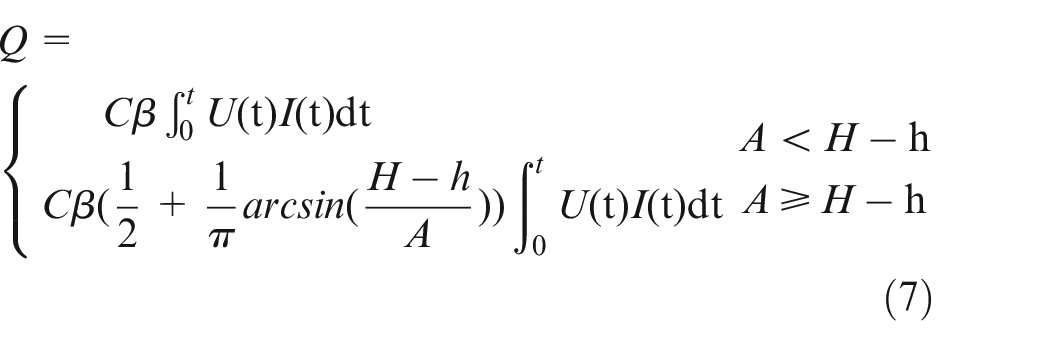
The expression of the overall effective energy can be obtained:
Where C– Scale factor;
β– Clearance flow field influence coefficient;
U– Pulse voltage (V);
I– Peak current (A);
H– Maximum discharge gap (µm);
h– Working discharge gap (µm);
A– Amplitude (µm);
According to the effective energy formula, a function curve of effective discharge energy and ultrasonic vibration can be draw, as shown in Figure 3. In order to investigate the effect of ultrasonic vibration on the effective discharge energy during EDM, we set the relevant parameters of EDM as a constant, which does not affect the basic trend of the entire curve. The influence factor of the gap flow field mainly affects the processing efficiency of UEDM, It is also set as a constant.
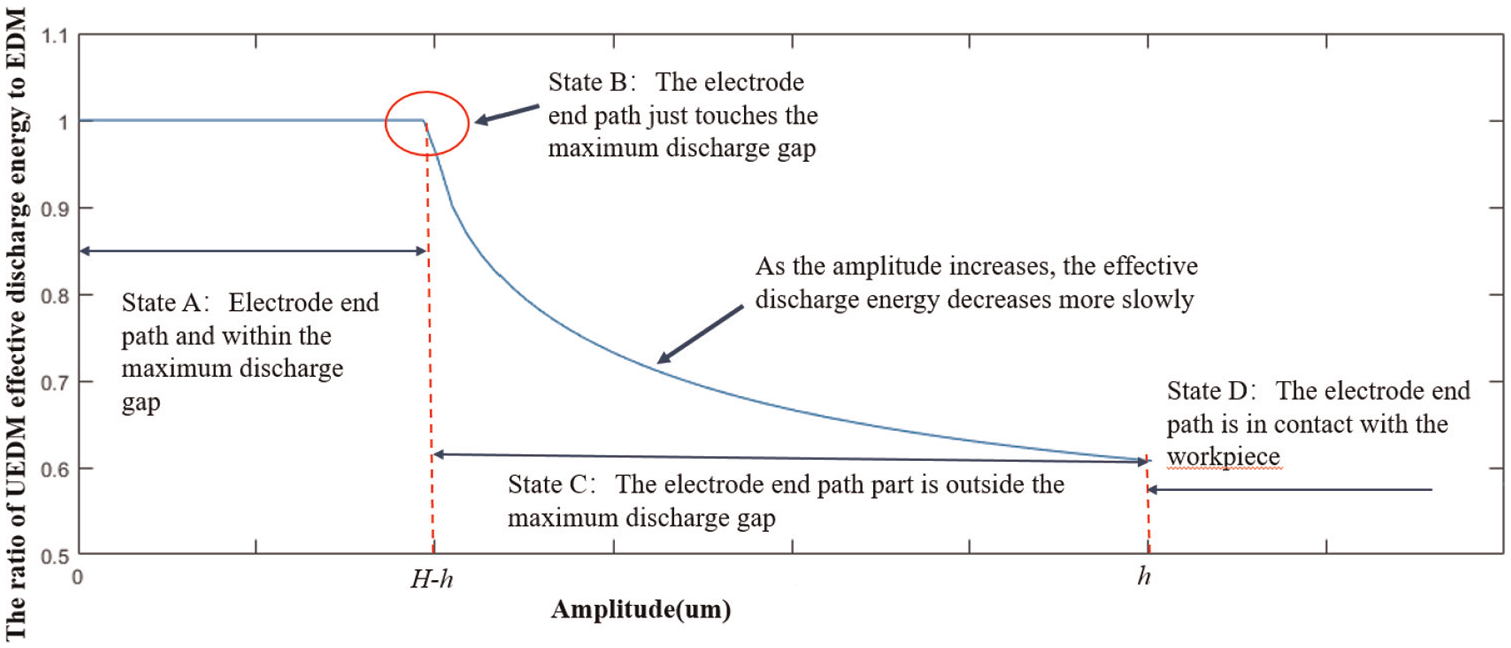
Effective discharge energy function image.
According to the formula and function curve, when the electrode end path is within the discharge gap, it can be concluded that ultrasonic vibration has relatively little effect on spark discharge energy. When part of the electrode end path is outside the discharge gap, the effective discharge energy can be expressed by formula (7). According to the function curve, it can be found that as the amplitude increases, the effective discharge energy is lower.
Surface roughness modeling
According to the roughness model of EDM machining, 2 it can be found that the roughness is mainly determined by the pulse voltage, current and pulse width of EDM. These three characteristic parameters determine the discharge energy. The roughness model of UEDM can still use this calculation formula, but the discharge time needs to be derived according to the model above.
The roughness value of UEDM discharge can be inferred based on ultrasonic vibration and EDM processing and parameters:
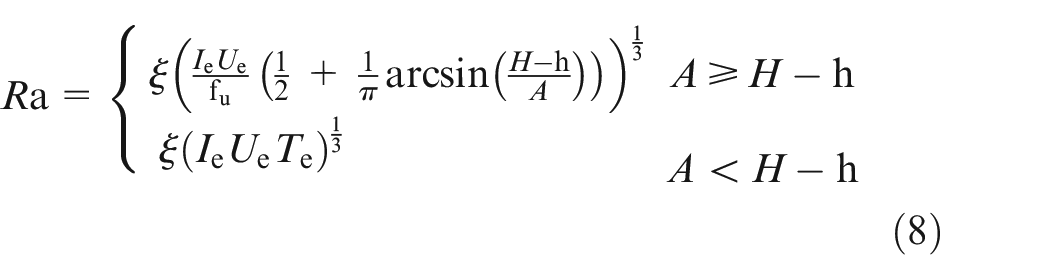
Where ζ– Constant;
Ue– Pulse voltage (V);
Ie– Peak current (A);
H– Maximum discharge gap (µm);
h– Working discharge gap (µm);
A– Amplitude (µm);
fu– Ultrasonic vibration frequency (Hz);
Te– EDM pulse width time (s);
This formula reflects that when the amplitude is larger than the maximum discharge gap, the higher the frequency or the larger the amplitude is, the better the surface quality is.
Experimental validation
Experimental design
In this research, verifying the correctness of the UEDM discharge mechanism is the first priority. The effect of ultrasonic vibration on the discharge process is verified by detecting the voltage waveform during the electrical discharge machining process. In order to prove the correctness of the basic trend of the effective discharge energy and roughness mathematical model, this research designed three sets of processing comparison experiments. In each group of experiments, the ultrasonic power ratio (ultrasonic amplitude) is used as the variable, and the roughness and surface topography are the characteristic quantities. The ultrasonic amplitude is proportional to the power of the ultrasonic vibration table. This article takes the power of the ultrasonic vibration table as a variable and measures the amplitude of each power ratio as a reference.
Through the analysis of the above discharge mechanism, this study selected nine sets of processing parameters for processing experiments, which verified the previous conjecture.
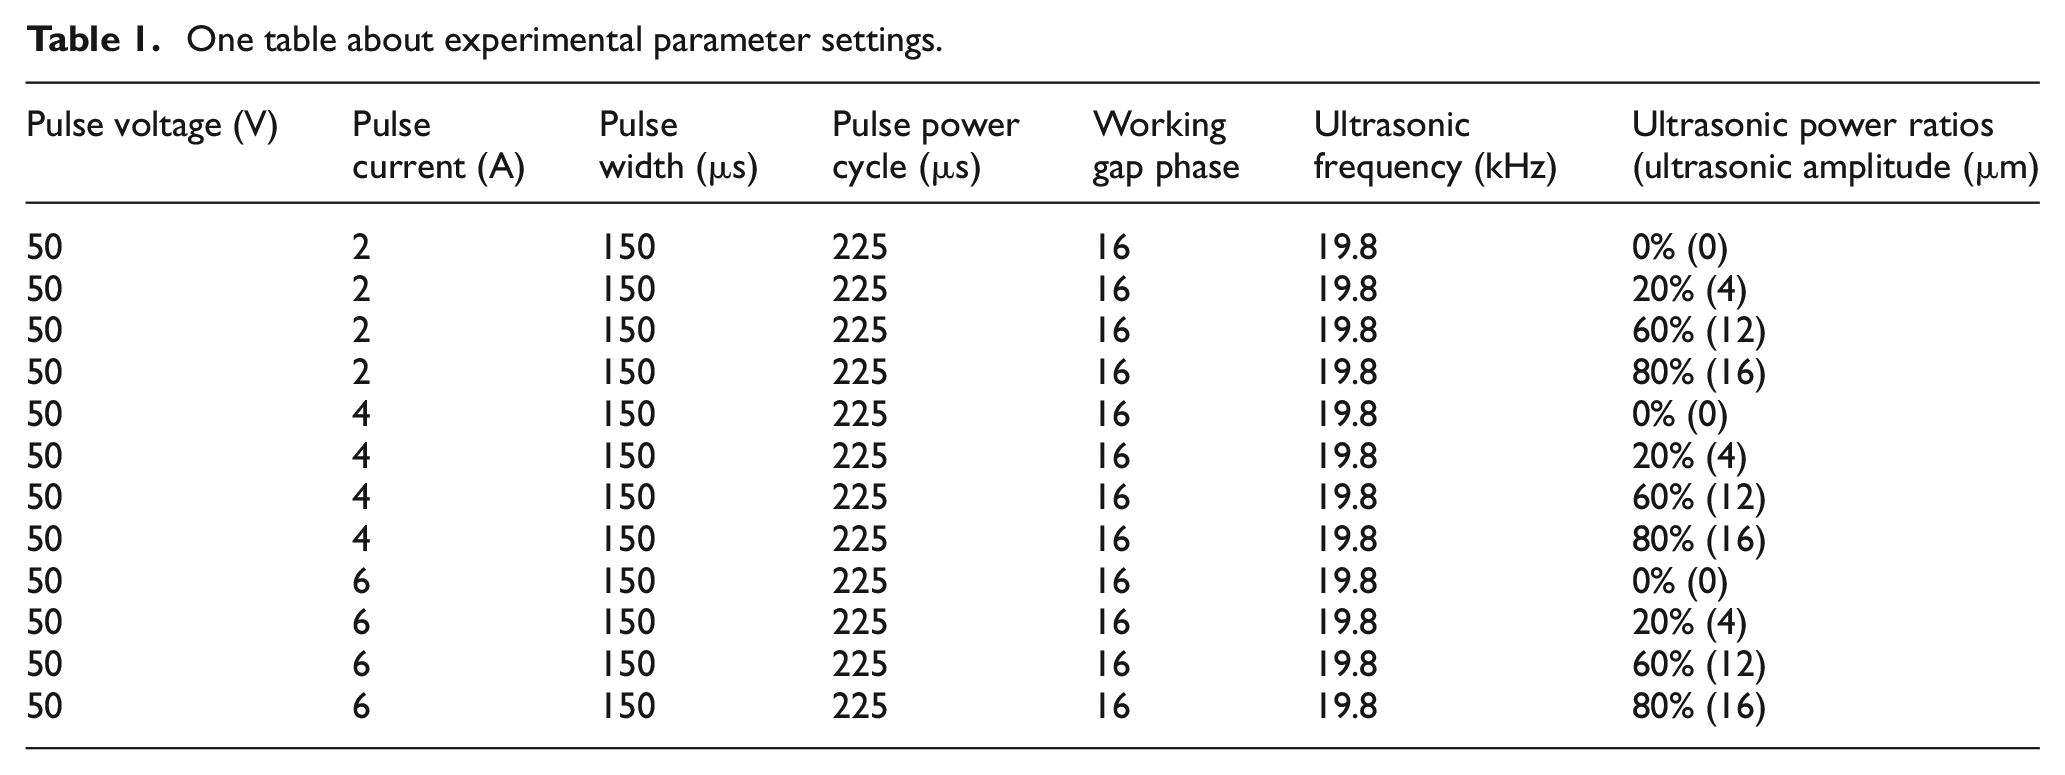
The parameter settings are shown in Table 1:
One table about experimental parameter settings.
In UEDM machining experiments, ultrasonic vibration has an effect on the gap flow field. This study aims to study the effective discharge energy of UEDM. In order to minimize the impact of ultrasonic vibration on the gap flow field and thus affect the discharge process and surface roughness, this study applied ultrasonic vibration to the titanium alloy workpiece with a vertical machining surface, which can promote the removal of discharge residues in the gap. In order to reduce the influence of the depth-to-diameter ratio on the entire experimental process, this study uses a φ2 mm copper electrode for processing experiments, and the processing depth is 0.2 mm. The discharge medium is kerosene.
The experiment setting is illustrated in Figure 4.
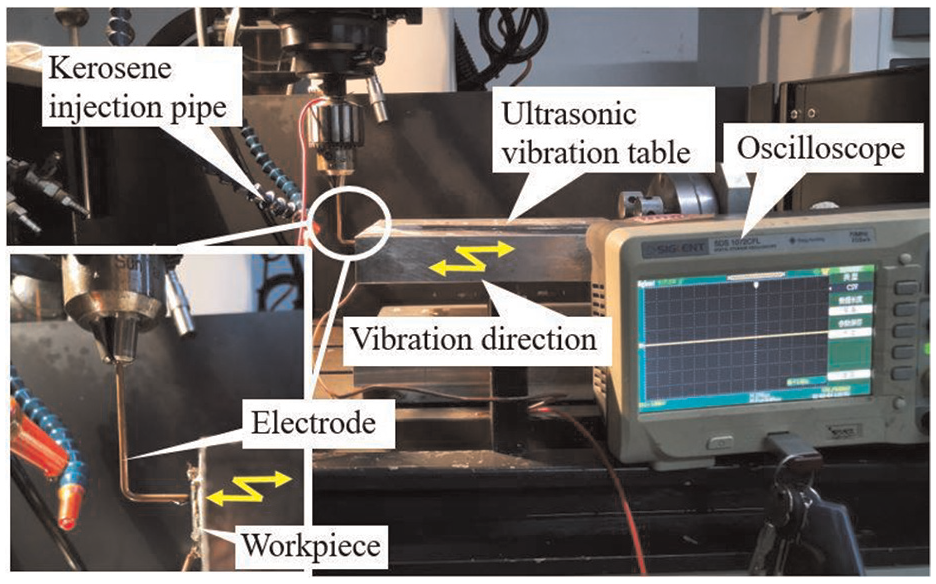
UEDM test setting.
Experimental equipment
The EDM machine (CHMER-EDM machine tool) is used for processing experiments, and the self-made ultrasonic vibration table is used to realize the vibration of the workpiece. Use an oscilloscope (SIGLENT SDS 1072CFL) to detect and collect the voltage waveform between the electrode and the workpiece. The roughness measuring instrument (TIME 3200) is used for roughness measurement and micro surface curve collection. Observation and analysis of the machined surface were carried out by using a scanning electron microscope (SEM). The microstructure was observed by scanning electron microscope (SEM, JSM-IT300LV) at a voltage of 10.0 kV.
Results and discussion
Detection and analysis of discharge frequency and waveform
During the experiment, the discharge waveforms of EDM and UEDM were collected respectively, as shown in Figures 5 to 7.
Voltage waveform processed by EDM.
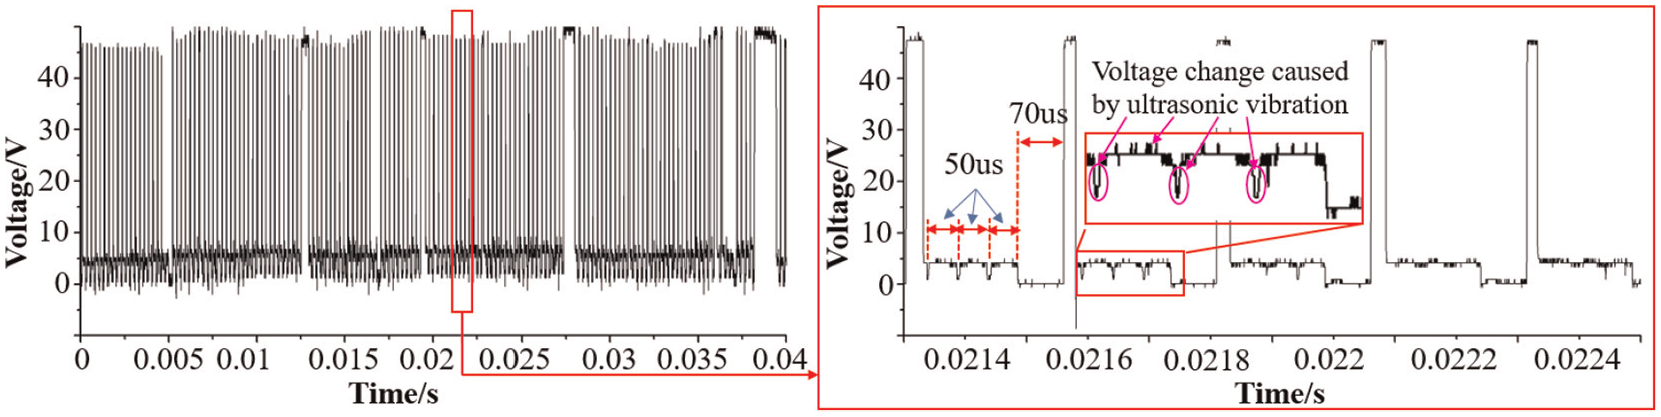
The voltage waveform processed by UEDM of 20% ultrasonic power.
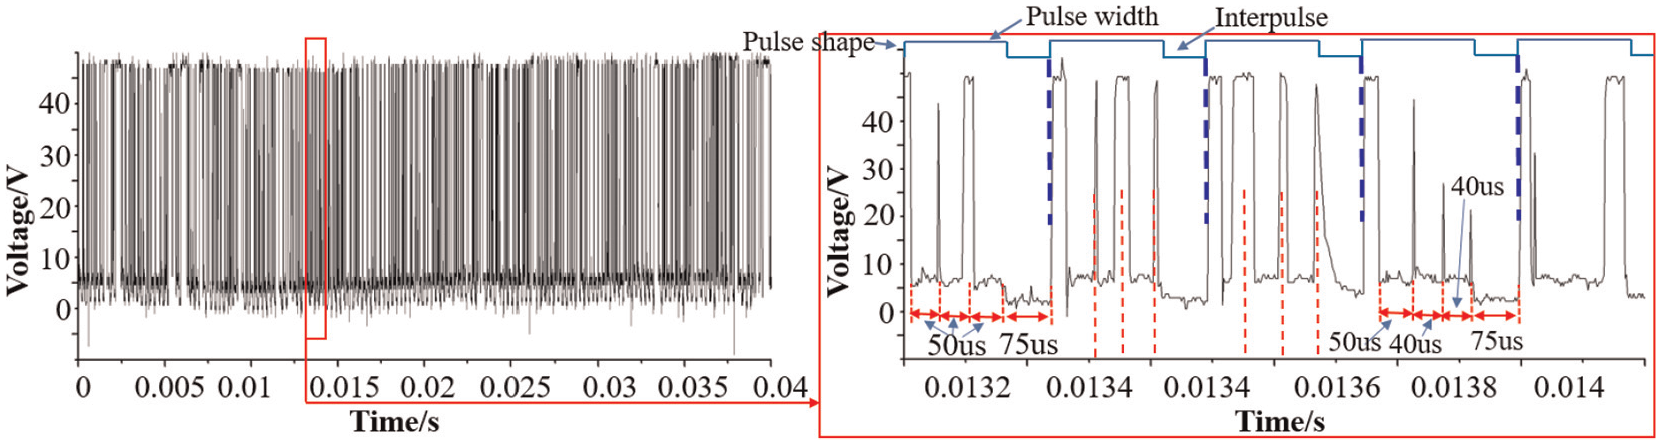
The voltage waveform processed by UEDM of 80% ultrasonic power.
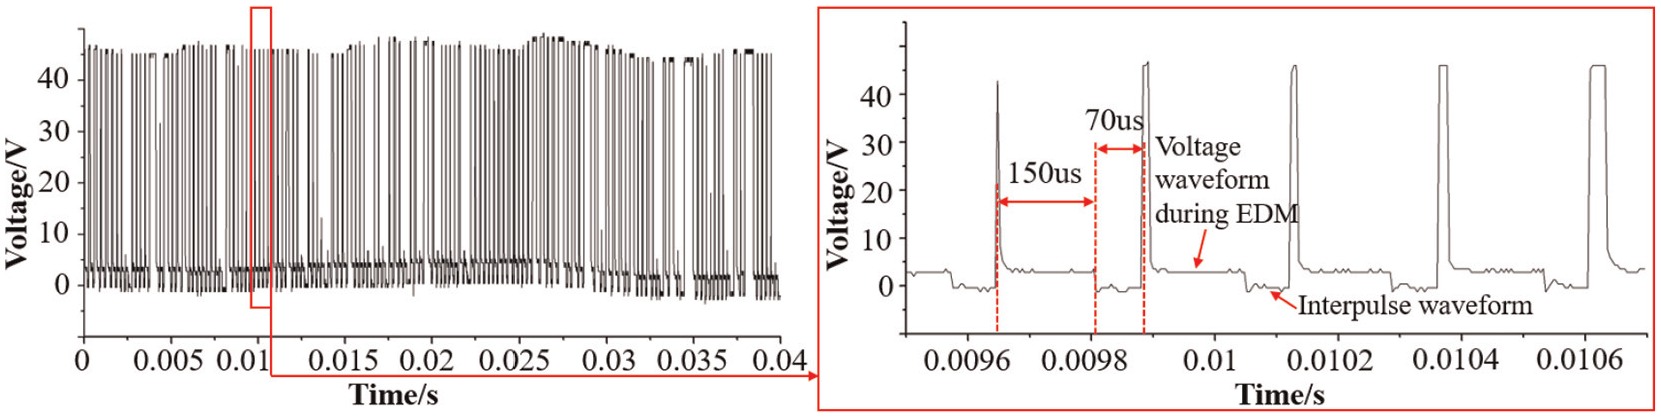
During EDM processing, the discharge frequency is around 4.4 kHz, which is consistent with the pulse frequency set in the experiment. There is a secondary discharge in the voltage waveform during EDM processing, relatively sparse places appeared in the waveform, as shown in Figure 5.
In the machining experiment with 20% ultrasonic power assisted EDM, it can be found that the overall discharge frequency has increased significantly, as shown in Figure 6. The discharge frequency during the machining process was measured many times, and the average value was 5.0 kHz. Ultrasonic vibration of small amplitude has a certain effect on the discharge process of electric sparks. Amplify the waveform locally and it can be observed that the ultrasonic vibration causes a small change in voltage. But the waveform is roughly the same as the EDM processing waveform. This also proves the hypothesis of this study that when the electrode end path is within the maximum discharge gap, the impact of small amplitude ultrasonic vibration on the discharge energy of EDM is minimal.
In the machining experiment with 80% ultrasonic power assisted EDM, the voltage waveform in the UEDM discharge process becomes denser, and the frequency we collected is 12.8 kHz, as shown in Figure 7. Observing the partially amplified waveform, it is found that there are three discharges within a single pulse width. Each discharge time is 50 µs. At the same time, in multiple discharge waveforms, it can be found that the re-discharge caused by ultrasonic vibration is almost a vertical straight line. It shows that the process of breaking and re-establishing the discharge channel by ultrasonic vibration is instantaneous. It can also indicate that the impact of ultrasonic vibration on the discharge energy of EDM is small, but it plays an important role in the re-selection of the discharge point and the re-establishment of the discharge channel. It is proved that when the electrode end path part is outside the maximum discharge gap, it will cause the collapse of the existing discharge channel and re-establish a new discharge channel.
Through the analysis of the frequency and waveform of the machining discharge of EDM and UEDM, it can be determined that with the assistance of ultrasonic vibration, the overall discharge frequency of the electric spark is increased, and the experimental test frequency is compared with the theoretical calculation frequency, as shown in Figure 8.
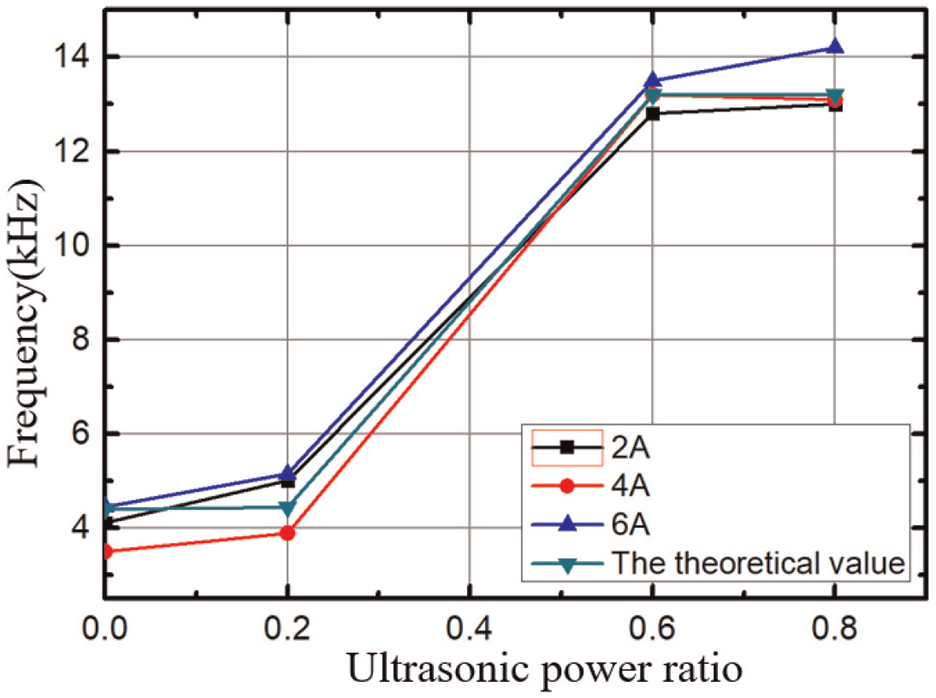
Comparison of the curve of the spark discharge frequency with ultrasonic power ratios and the theoretical calculation value.
According to Figure 8, it can be found that the discharge frequency of the 12 sets of experiments has a small difference with the theoretical calculation value. When the ultrasonic vibration power is low, the discharge frequency of the electric spark is increased due to the interference of the ultrasonic vibration. When the power of ultrasonic vibration is high, ultrasonic vibration plays a major role in the interference of the discharge gap.
Surface quality and topography analysis
According to the analysis of the discharge waveform, it can be obtained that the time of a single discharge of UEDM becomes almost one-third of the original, and the roughness will be reduced accordingly. According to the previous theoretical derivation, the corresponding roughness value is calculated. The surface roughness of the workpiece after nine groups of UEDM processing is tested and compared with the theoretical calculation value, as shown in Figure 9.
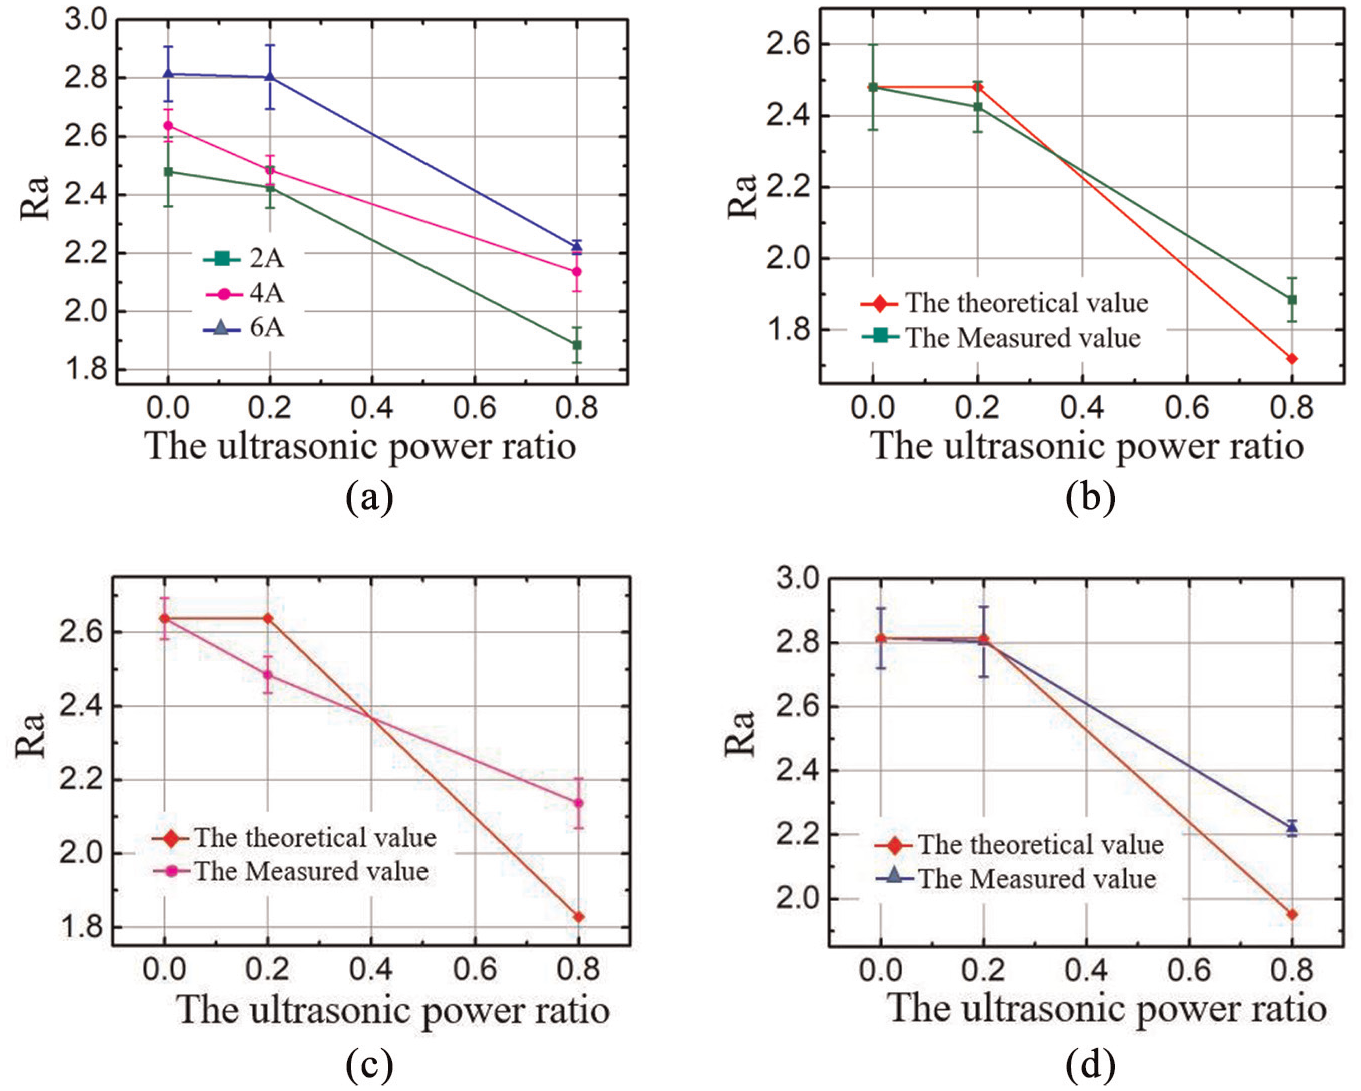
Theoretical calculation value, surface treatment quality and ultrasonic power curve: (a) three sets of experimental data curves, (b) I = 2 A, (c) I = 4 A, and (d) I = 6 A.
According to the experimental results in the Figure 9, it can be found that under different current processing environments, the change trend of surface quality with amplitude changes is consistent. The basic trend of the curve is that as the amplitude increases, the curve changes from horizontal to steep. In the data of a single value, the experimental value is larger than the theoretical value mainly because of the influence of residue on the discharge energy. When the electrode end path is within the maximum discharge gap, the ultrasonic vibration has a small effect on the surface quality of EDM. When the ultrasonic amplitude is greater than the critical value, the energy is evenly distributed. This value is the difference between the maximum discharge gap of the EDM machine tool and the working discharge gap. With the aid of ultrasonic vibration processing, the surface quality has been significantly improved, and the surface quality has increased by more than 20%. Continue to increase the amplitude, the surface quality will continue to improve, but the improvement curve will be smoother.
Observed the surface topography of the workpiece processed by EDM and UEDM, Microscopic analysis of the experimental workpiece surface is shown in Figure 10.
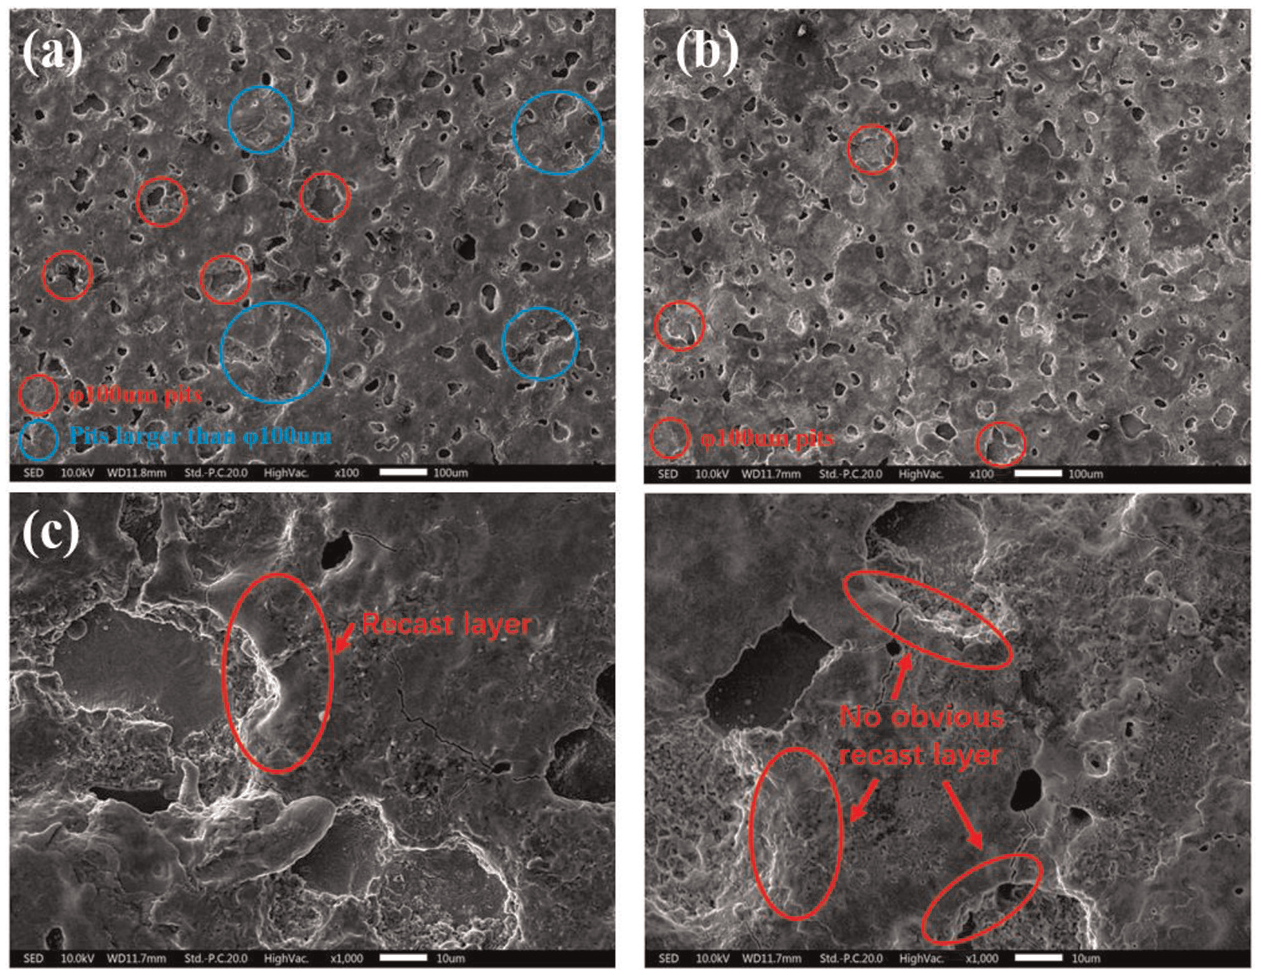
Surface morphology at different ultrasonic power ratio parameters: (a) the surface morphology of EDM processing,(b) the surface pits processed by UEDM, (c) Partially enlarged EDM surface, and (d) Partially enlarged UEDM surface.
In Figure 10, in order to compare the EDM and UEDM processing surfaces intuitively, this paper uses a red circle with a diameter of 100 µm to mark a discharge pit with a diameter of 100 µm, and a blue circle to mark a discharge pit with a diameter >100 µm. Figure 10(a) shows the surface morphology of EDM processing. There are many pits with a diameter >100 µm, and the pits are arranged sparsely. Figure 10(b) shows the discharge pits processed by UEDM. There are few pits larger than 100 µm in diameter, and the pits are arranged densely. This result proved that the introduction of ultrasonic vibration affected the discharge frequency and single discharge energy of EDM. Compared to EDM, UEDM can achieve a uniform energy distribution of a single pulse. Compare the change of single pit recast layer 18 between EDM and UEDM. Figure 10(c) shows the surface pits processed by EDM, with obvious recast layers. Figure 10(d) shows the surface pits treated by UEDM, and the thickness and width of the recast layer have been reduced. According to the micro morphology, the processed surface of UEDM is better than that of EDM. It shows that when the ultrasonic vibration is applied to the workpiece, the high-frequency vibration of the workpiece makes the molten metal easier to be discharged, thereby reducing the recast layer in the EDM process.
Conclusions
In this study, the theoretical analysis for vertical UEDM is executed, and an effective energy mathematical model and surface roughness model are established. The detailed experiment validation is presented in order to verify the accuracy of theoretical deduction. The discharge link of vertical UEDM is discussed and studied, following conclusions can be obtained:
A macro discharge model of vertical UEDM is established. The influence of ultrasonic vibration amplitude on the gap of electric discharge machining is analyzed in four discharge states, and the comparison experiment of discharge frequency and the analysis of discharge waveform verified the inference.
A mathematical model of effective energy is established for the process of vertical UEDM. The effective discharge energy is mainly affected by the amplitude of the ultrasonic vibration. When the electrode end path is within the maximum discharge gap, the ultrasonic vibration mainly affects the gap flow field. When the part of the electrode end surface path is outside the maximum discharge gap, the effective discharge energy decreases as the amplitude increases.
The mathematical model of surface roughness is established for the process of vertical UEDM. When the electrode end path is within the maximum discharge gap, the frequency, and amplitude of ultrasonic vibration have relatively little effect on the surface quality. When the part of the electrode end surface path is outside the maximum discharge gap, the frequency, and amplitude have a big impact on the surface quality. The surface quality can be obviously improved by ultrasonic frequency and amplitude increased.
According to the analysis of micro-morphology of the EDM and UEDM processed surface, the discharge pits on the UEDM surface are more uniform and smaller, and the ultrasonic vibration has a certain positive effect on reducing the height of the recast layer.
Footnotes
Acknowledgements
The authors appreciate help of Haiteng Liu and Jiajun Liu during the experiment.
Declaration of conflicting interests
The author(s) declared no potential conflicts of interest with respect to the research, authorship, and/or publication of this article.
Funding
The author(s) disclosed receipt of the following financial support for the research, authorship, and/or publication of this article: This work was supported by the Tianjin natural science foundation [grant numbers 18JCYBJC88900, 18JCQNJC05200, 18JCQNJC75300]; the Tianjin municipal education commission scientific research project [grant number 2018KJ116, 2018KJ118].