
Abstract
In this article, the use of acoustic emission signal analysis for in-process assessment of the surface quality in abrasive waterjet machining is presented. The authors carried out an analysis of the influence of the cutting head traverse speed (considered in this case as the performance measurement) on the flatness, waviness and roughness of surfaces made of aluminium alloy 5251 after cutting process, as well as the influence of changing the quality factor on values of selected descriptors of the emitted high-frequency acoustic emission signal processed in the frequency domain. This was a new approach, different from the norm, in which an acoustic emission signal is usually studied for low frequencies. The obtained results confirmed the clear influence of machining conditions on the geometric structure of the obtained cuts and the registered values of the emitted stress waves. This influence can be accurately determined by the use of the high-frequency acoustic emission signal analysis being proposed. Additionally, statistical dependence models developed between the given process quality indicator and the registered selected acoustic emission signal parameters in the frequency domain allowed for the prediction of the surface texture of the obtained cuts on the basis of the acoustic emission signal emitted during the machining process.
Keywords
Introduction
In recent years, an increased interest has been observed in methods that make it possible to shape materials characterized by high resistance and hardness in a cost-efficient manner, bearing in mind environment protection-related aspects, as shown in works of Axinte and Kong, 1 Aydin et al. 2 and others.3–7 This dynamic increase is related not only with conventional machining methods which, in many cases, do not fulfil numerous criteria (as described in the works of Benardos and Vosniakos, 8 as well as those by Radzevich and Krehel’ 9 ) but predominantly due to the unconventional machining methods used more and more often in areas in which conventional methods turn out to display poor effectiveness.
One of these unconventional methods is hydrojet technology, which makes use of concentrated energy jets in the form of high-pressure hydrojets that are described in the literature.10–15 Zhu et al. 15 presented an experimental investigation of the cutting performance of hybrid laser-assisted waterjet in micro-grooving process, with a view to eliminate or minimize the laser-induced thermal damages to the workpiece.
An abrasive waterjet (AWJ) machining is used mainly in the cutting process of a wide range of material (especially metals and its alloys; ceramics; plastics), as well as for regenerating the cutting ability of grinding tools. Indeed, numerous examples of such applications can be found in the literature.16–23 Zohoor et al. 22 used waterjet technology in turning process and analysed geometrical error in turned parts. Karakurt et al. 23 studied the effects of the AWJ operating variables on the kerf angle and the material properties in machining of rocks.
Aluminium is a widely used light metal in the machine industry as it is a relatively soft material and may be cut quickly. Analyses of the AWJ cutting process of various materials, including aluminium alloys, have been carried out for many years and have been described, among others, in the works by Selvan and Raju, 24 Boud et al., 25 as well as Yuvaraj and Pradeep Kumar. 26 However, problems with its cutting capability in terms of the depth of jet penetration and kerf quality still occur, especially in cases of contradictory test results presented by different research groups. On one hand, the decreasing quality of the surface roughness after cutting with an increasing traverse speed was observed as demonstrated in the works of Selvan et al., 27 Borkowski and Sutowska, 28 among others. On the other hand, other test results, as presented by Ebeid et al., 29 show that the values of the Ra surface roughness parameter measured at different traverse speeds in the range from 1000 to 2000 mm/min decrease. The above-mentioned problems show that further experimental studies are necessary in order to fully understand the influence of the process parameters on aluminium surface roughness, thereby optimizing cutting performance. In the brochure of AGA Company, 30 the waterjet cutting process of aluminium is referred as generally suitable in relation to other methods, such as gas/oxy-fuel cutting, plasma cutting, mechanical cutting and laser cutting. The comparisons based on this brochure 30 are given in Table 1, whereas in Table 2, a comparison of criteria for the cutting quality of aluminium by the use of the plasma, laser and waterjet processes is presented. Analysing the data in Table 2, it may be concluded that the width of the heat-affected zone is excellent (++) in cases of waterjet cutting. Likewise, the surface roughness and kerf width are rated as a good for this process.
Comparison of different cutting methods for aluminium. 30
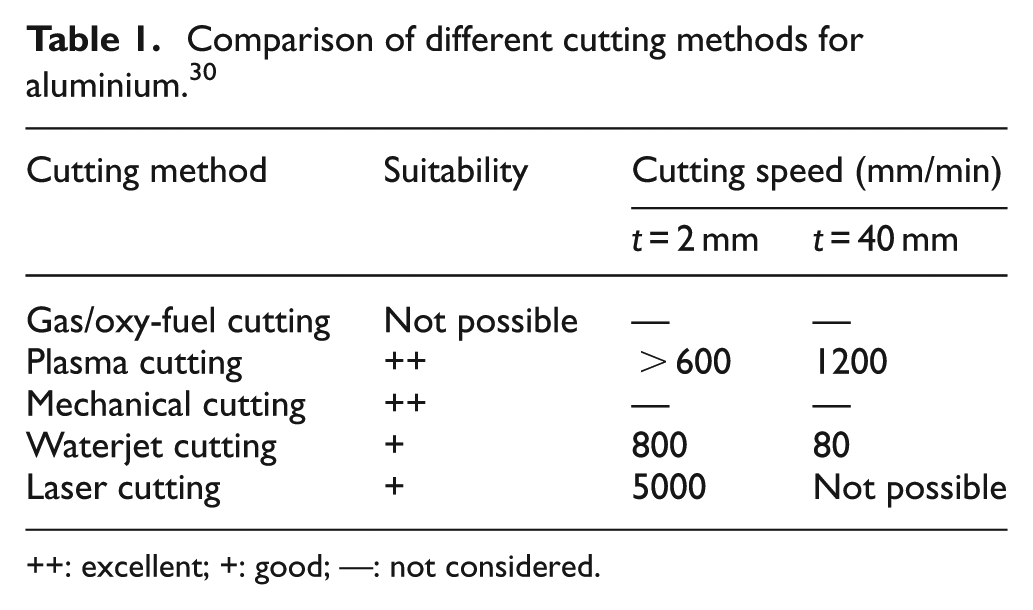
++: excellent; +: good; —: not considered.
Qualification of the cut quality of different cutting methods. 30
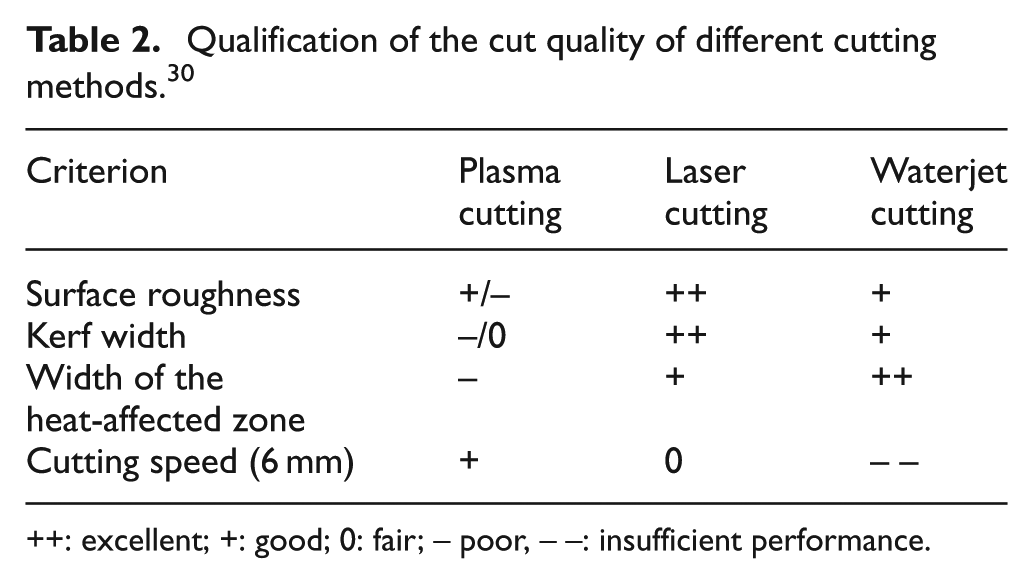
++: excellent; +: good; 0: fair; − poor, −−: insufficient performance.
Verification of the suitability of the cutting process of aluminium performed by the use of AWJ in relation to the obtained surface roughness can be assessed by a wide range of non-contact diagnostic methods. In this article, the possibility of applying high-frequency acoustic emission (AE) signals for assessing the quality of the surface roughness of aluminium alloy 5251 after the AWJ cutting process is presented and discussed. In section ‘Characteristics of AE and AE-based techniques’, a brief description regarding the characteristics of AE and AE-based techniques is given. Section ‘Methodology of the experimental studies’ focuses on the methodology of experimental studies, including a detailed description of the technological and metrological apparatus, as well as the course of the AWJ cutting process. The selected results obtained during experimental studies are discussed in section ‘Results and discussion’, whereas in a final part of this article, the most important conclusions are presented.
Characteristics of AE and AE-based techniques
Acoustics is an interdisciplinary field of science that deals with the study of all mechanical waves in gases, liquids and solids including topics such as vibration, sound, ultrasound and infrasound.
Vibrations and machine noise are low-frequency waves, generally up to 10–20 kHz. Hreha et al. 31 investigated the possibility of detecting the focusing tube wear and failures of abrasive supply by means of material vibration. Based on those experiments, it can be concluded that significant and stable amplitude peaks were observed around the frequencies of 10,500 and 14,400 Hz, and the influence of the focusing tube diameter and abrasive mass flow on surface roughness parameters were confirmed. Authors conclude that further research on material vibration as potential source of information for quality control in the process of AWJ. Hreha et al. 32 present equations for prediction of the surface roughness parameters according to the vibration parameter and the traverse speed of cutting head (in the case of stainless steel AISI 309 machining). Hreha et al. 33 determined the vibration frequency depending on abrasive mass flow rate during abrasive waterjet cutting. Authors concluded that active processing of data from vibration emission together with the appropriate regulation mechanisms and regulation electronic components shall be applicable in various spheres of production technologies, especially where there operator’s assistance is not required or desirable.
AE (also known as stress-wave emission) is used in the analysis of phenomena which occur during various types of processes in real time. These phenomena are detected in a wide spectrum of frequencies using an AE sensor. Its applications in assessing production processes have been widely discussed in the literature.34–47 Indeed, Oh and Lee, in their work, 36 present the prediction of surface roughness in the magnetic abrasive finishing process using AE and force sensor data fusion. Valíček and Hloch, 37 as well as Hloch et al., 38 used sound in range of audible frequencies (16–12,500 Hz) for the in-process control of AWJ technology. The authors used the measurement of the acoustic pressure level and the experimentally confirmed functional relationship for immediate control of the surface quality in real time. Hreha et al., in their work, 39 conducted research which revealed that AE (frequency range up to 15 kHz) is the most suitable technique for monitoring AWJ. The authors showed the correlation of AE amplitude with the cross-sectional roughness Ra surface parameter.
In other works,40–42 the authors used a Piezotron Acoustic Emission Sensor (PAES) which features a very high sensitivity regarding surface (Rayleigh) and longitudinal waves over a broad frequency range from 100 to 900 kHz.
A study by Nadolny et al. 40 used these high-frequency ultrasounds for the registration of AE signals in different kinds of abrasive grains during compression tests and proved that the time structure of the AE signal depends on the course of the abrasive grain destruction process. Additionally, depending on the abrasive grain structure, an AE signal with varied amplitude was obtained.
The results of experimental tests which prove the possibility of indirectly assessing the quality of the object being ground with the application of the monitoring and analysis of selected AE signals registered during the machining process were presented by Sutowski. 41 The analysed results indicate that an AE signal is a convenient indicator for the evaluation of stresses cumulated in the surface layer of the material and in selected surface texture parameters.
The high degree of usefulness of AE signals in monitoring and diagnosing the course and effects of the grinding process were discussed by Sutowski et al., 42 with the authors describing a new type of non-contact hydroacoustic sensors, in which the acoustic signal wave transmitting medium is the stream of the cooling liquid. The presented method allows for the detection of signs of wear of the grinding wheel during the process and the assessment of selected surface roughness parameters of the workpiece.
The AE method is used, among others things, in the assessment of the waterjet’s erosive nature regarding the effectiveness of its penetration of the machined material. Kovacevic et al. 43 applied AE sensing as a tool for understanding the mechanisms of abrasive waterjet drilling of difficult-to-machine materials. Research studies carried out by Hassan et al. 44 and Axinte and Kong 1 indicate AE signals as suitable technique for AWJ monitoring, displaying high sensitivity to variations in the depth of cut and waterjet pressure. The authors proved that the root mean square of acoustic emission energy (AERMS) rises linearly with an increase in the depth of cut and may be used for its on-line monitoring instead of the cutting force.
Nowadays, although machining technology with the use of AWJ is no longer a fundamental problem from a hardware and software point of view, the inspection of surface quality by continuous process control in this method still remains one of the real and unsolved problems in this field as concluded in the literature.37–39 A broad review of the applications of AE for assessing the quality of machined surfaces after the use of an AWJ has been subject of several studies.10,14,20,27,28,45
In accordance with the results of experimental research presented by Hloch et al., 10 a relationship between AE and the nozzle traverse speed has been developed. Research on the use of AE signals has been focused primarily on the analysis of peak-to-peak values and root-mean-square data. In this work, the authors also present a comparison of fast Fourier transform (FFT) spectra of AE signals, indicating the frequency components that are changed with alterations in the cutting speed.
A preliminary study of the applicability of AE signals for monitoring the AWJ process, focusing on predicting material removal rate and process stability (smoothness), was published by Mikler. 46 The author used selected descriptors to analyse AE signals, namely, root-mean-square value, mean, standard deviation, skewness and kurtosis. With these parameters, a limit analysis was developed for different process states (under-abrasion, normal abrasion and over-abrasion). It has been proven that the usual signal descriptors do not allow for significantly distinguishing between over- and under-abrasion in AWJ. Mikler concludes that further research is required to find effective parameters in order to monitor and improve the AWJ process.
Methodology of the experimental studies
In this section, a detailed description of all the technological and measurement apparatuses used in the experimental studies is presented. Additionally, the characteristics of the cutting material and the main parameters of this process are given.
The main goals of the experimental studies
The main goals of the experimental studies were related with the following:
The technological process – the cutting of aluminium alloy 5251 surfaces by the use of AWJ;
Metrology – measurements and analysis of the surface state following the AWJ process;
Process diagnostics – measurements of AE during the AWJ process, determining the relationships between the AE signal and the traverse speed (which is the determinant of the AWJ cutting process) while developing proper statistical models.
Sample preparation and the AWJ cutting process
In the experimental studies, the following devices were used: a precision OMAX 55100 JetMachining® Center (OMAX Corporation, Kent, WA, USA); an AE measurement circuit, composed of a Kistler 8152B211 piezoelectric AE sensor (Kistler Holding AG, Winterthur, Switzerland); a PXIe-6124 converter (National Instruments Corp., Austin, TX, USA). A general view of this setup is presented in Figure 1.
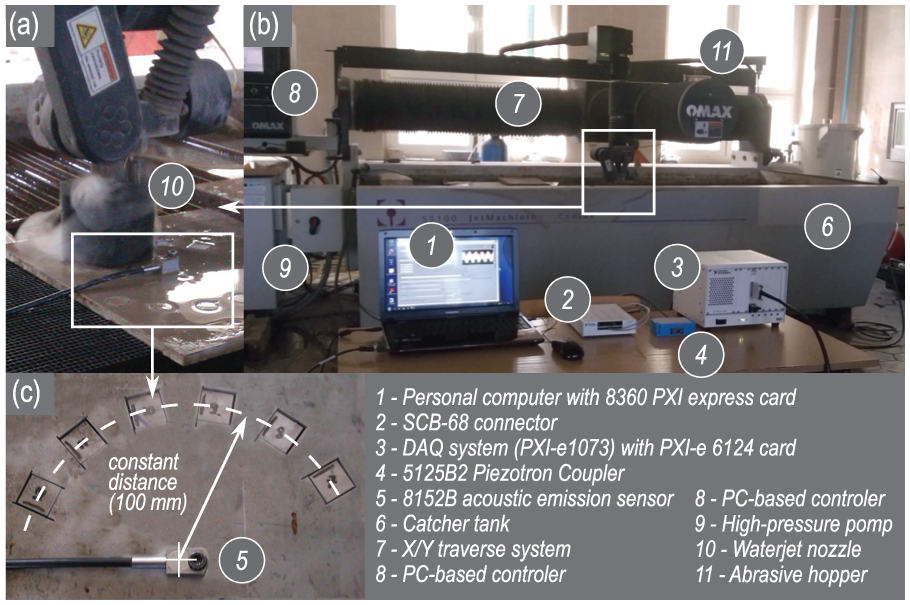
Details of experimental setup based on the precision OMAX® 55100 JetMachining Center by OMAX Corp.: (a) view of the working zone, (b) general view of the setup and (c) position of the AE sensor in relation to workpieces.
The 8152B211 piezoelectric AE sensor used was characterized by very high sensitivity to surface and longitudinal waves in a wide frequency range from 100 to 900 kHz (producer’s data). These waves were transformed by the measurement system into electric impulses with a voltage proportional to the energy of the source (system excitation source). A type 5125B2 converter with filters (high-pass filter (HPF) 50 kHz and low-pass filter (LPF) 1000 kHz) was used in the measurement system. Filtering process allowed to cut-out vibrations and machine noises from AE signals, besides all used equipment, was designed to have the minimum possible sensitivity to many external influences of environment. The signals were acquired using a PXIe-1073 system with an A/C PXIe-6124 16-bit converter with a sampling frequency fs = 2.5 MHz.
During the experimental tests, the sensor was attached directly to the workpiece (Figure 1(c)) in contrast to most of the tests known in the literature where the sensor was mounted on the waterjet head, as presented by Rabani et al., 47 among others. This allowed one to acquire AE signals directly related with phenomena occurring during machining, rather than those related only with the changes in process parameters (e.g. pressure changes or the abrasive mass flow rate) and nozzle wear.
For the tests, a flat plate made of aluminium alloy 5251 was used. This alloy is characterized by the following: medium strength and ductility; good formability; high corrosion resistance, particularly in marine environments; a high susceptibility to welding. It is widely used in shipbuilding and marine structures, aircraft and vehicle parts, as well as for the construction of silos, containers, plates, road signs and architectural panels. In Table 3 the chemical composition of aluminium alloy 5251 is given, while Table 4 outlines its selected physical and mechanical properties.
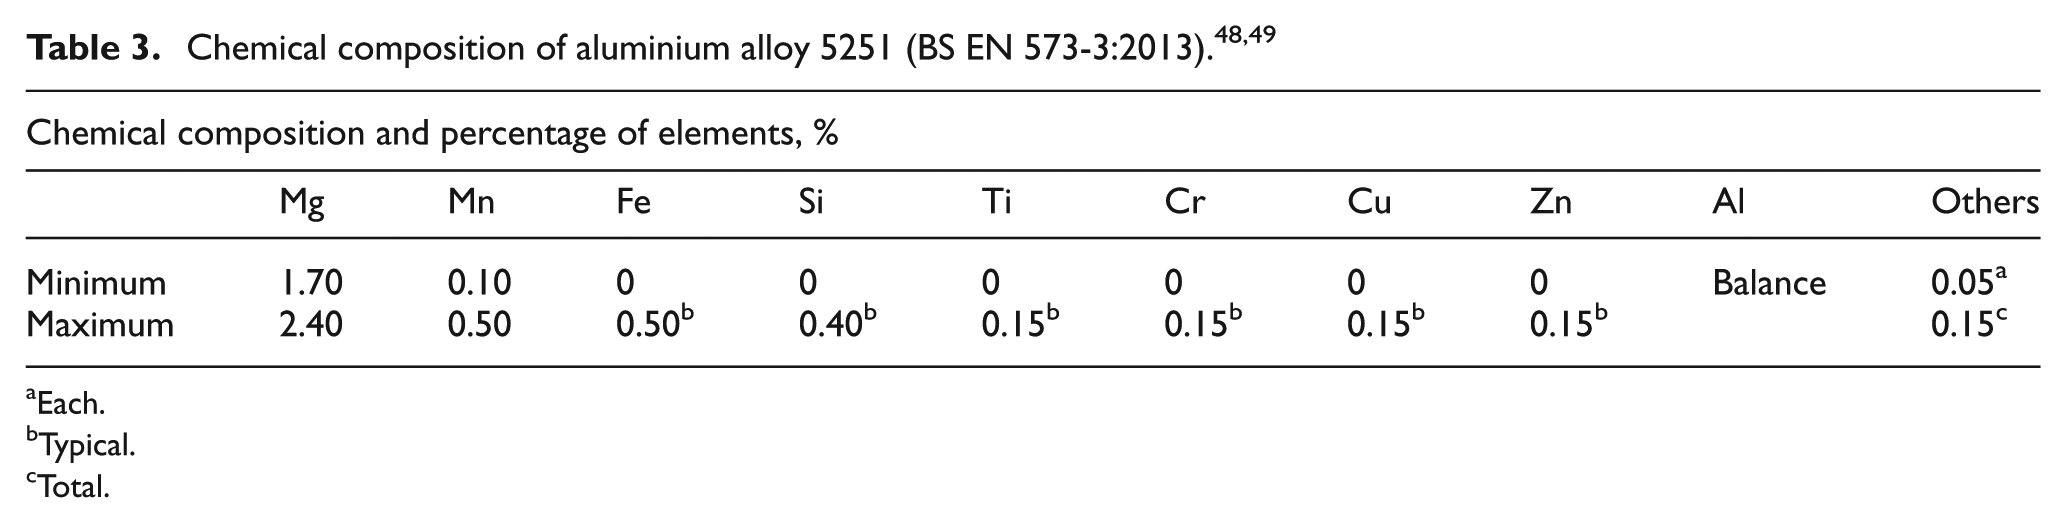
Each.
Typical.
Total.
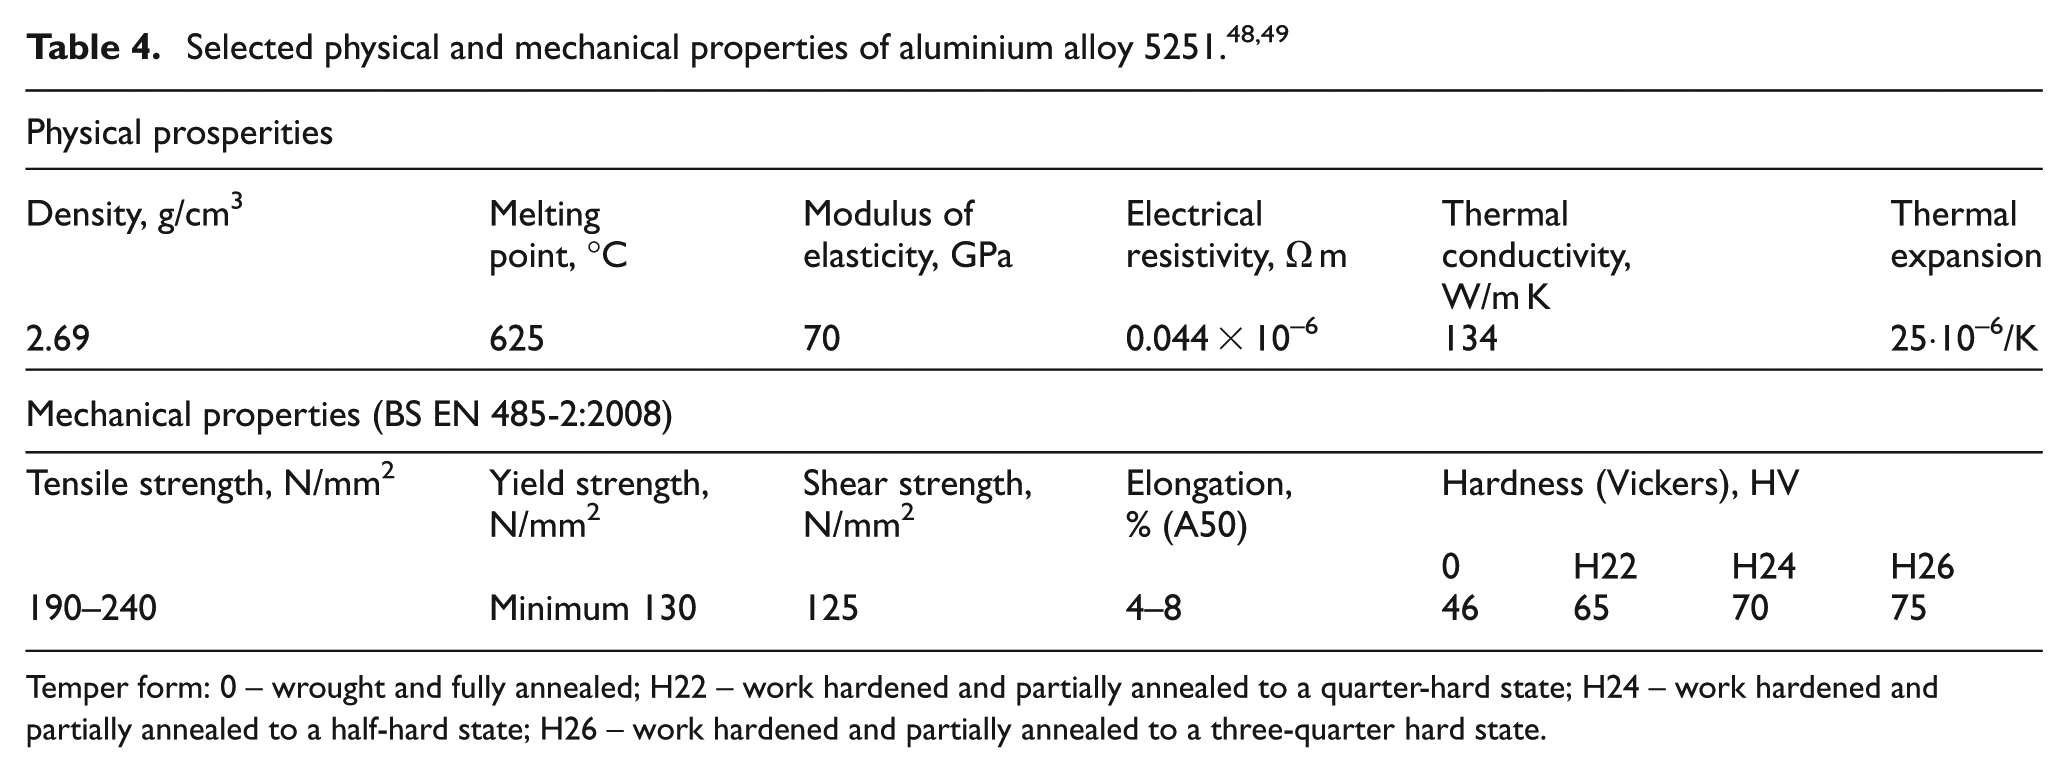
Temper form: 0 – wrought and fully annealed; H22 – work hardened and partially annealed to a quarter-hard state; H24 – work hardened and partially annealed to a half-hard state; H26 – work hardened and partially annealed to a three-quarter hard state.
The adopted test program included cutting out cuboid elements sized 20 × 20 × 10 mm3, of which a general view is presented in Figure 2.
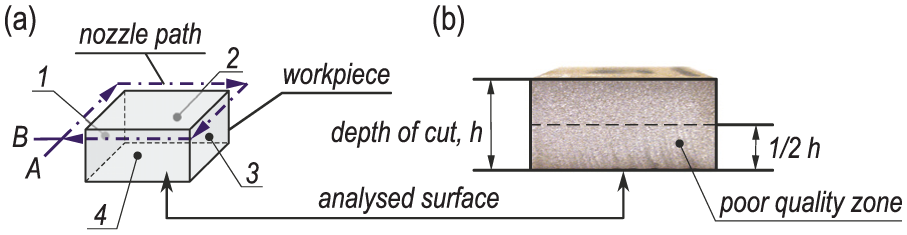
The cuboid workpiece (material: aluminium alloy, type: 5251): (a) visualization of the path of the abrasive jet nozzle and (b) the corresponding image of the original cut surface of workpiece with marked quality zone.
Process was initiated at a distance of 4 mm, parallel to the first cut edge (fragment A in Figure 2). Cutting head performed a clockwise motion working along the subsequent edges (surfaces marked as 1–4 in Figure 2(a)). At the corners, direction and speed of the nozzle shift were automatically regulated by the machining centre. The nozzle mouth distance from the cut material was 1.5 mm, and lead-out distance was set at 2 mm along edge 4 (fragment B in Figure 2(a)). The selected parameters of the cutting process are given in Table 5.
The selected parameters of cutting process of aluminium alloy 5251 with use of 55100 JetMachining Center by OMAX Corp.
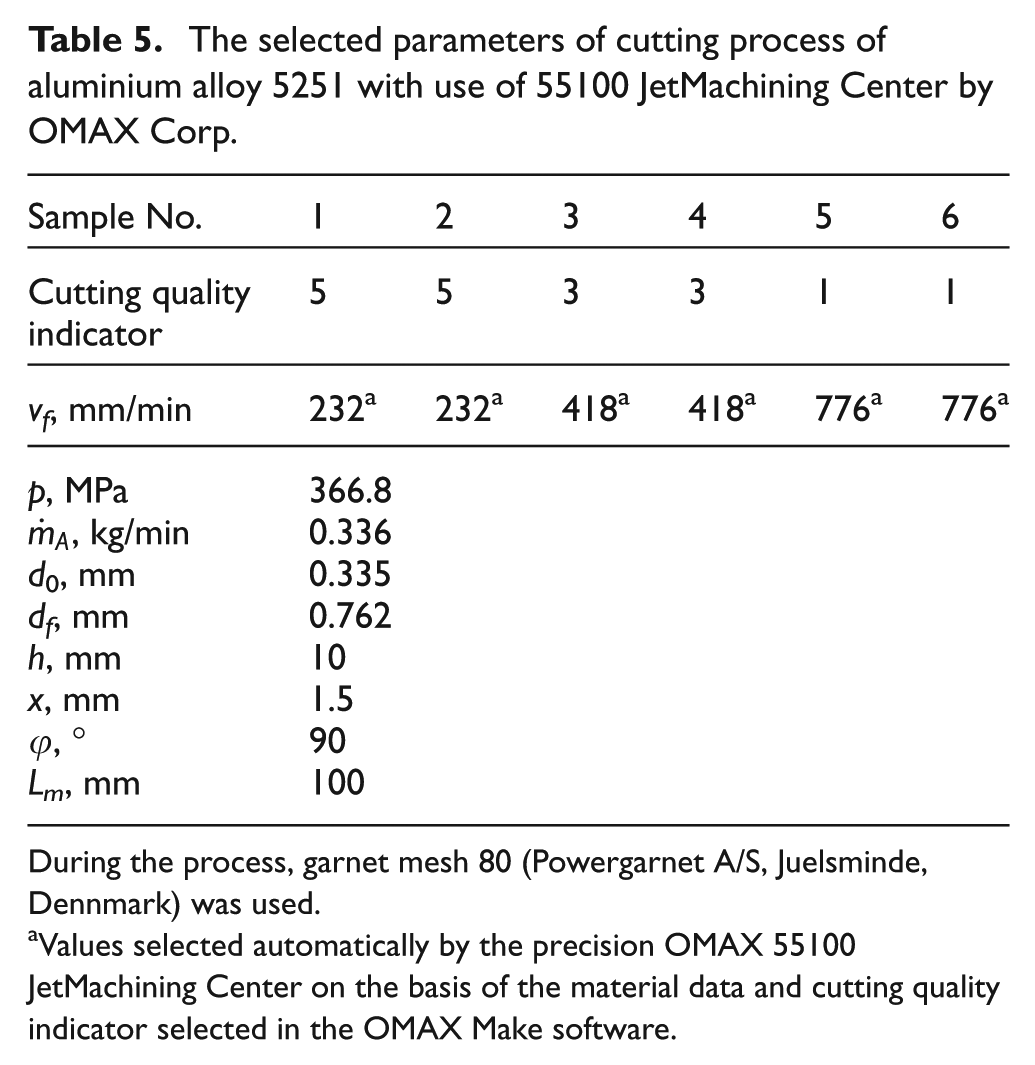
During the process, garnet mesh 80 (Powergarnet A/S, Juelsminde, Dennmark) was used.
Values selected automatically by the precision OMAX 55100 JetMachining Center on the basis of the material data and cutting quality indicator selected in the OMAX Make software.
In order to eliminate the influence of the sensor from the source of the registered ultrasound waves on their energy and attenuation, the piezoelectric sensor was located at the same distance (100 mm) from the middle of the cut-out samples (Figure 1).
Although the cut surface quality is always relative to the machinability of the material, in the general case, the cutting speed bears the main influence on results. A decrease in quality rating (Figure 3, sketches at bottom) was a consequence of an increase in the cutting speed, resulting in the cut surface becoming less and less smooth. At the highest quality rating (5), the cutting head moves the slowest.
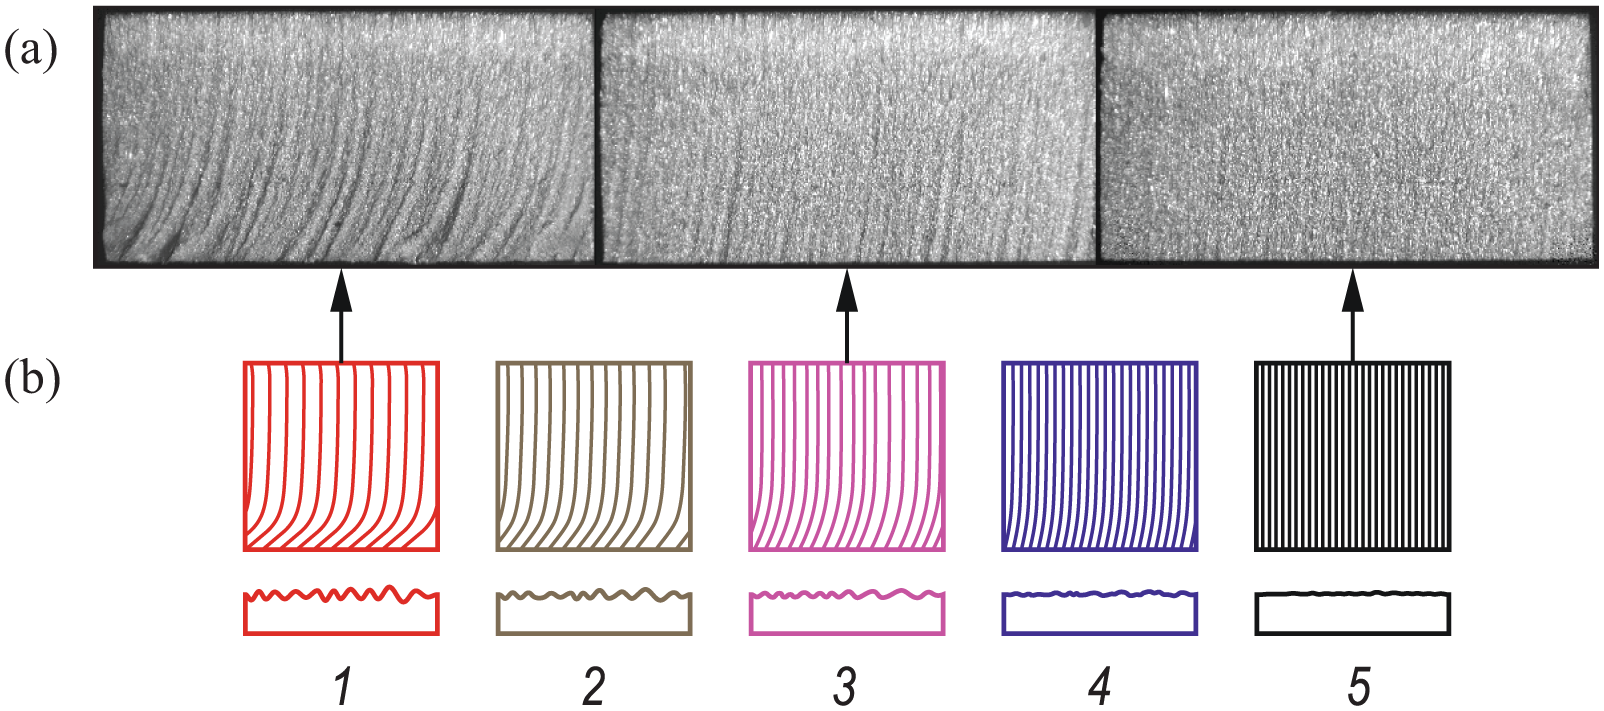
Changes in surface finish with the quality assigned by cutting quality indicator in the precision OMAX 55100 JetMachining Center by OMAX: (a) corresponding image of the original cut surfaces and (b) schematic drawings illustrating the striations on the cut surface (1 – lowest quality and 5 – highest quality).
Optical measurements of sample surface after the AWJ cutting process
The quality of the surfaces after the AWJ cutting was measured using a Talysurf CLI 2000 optical profilometer (Taylor-Hobson Ltd, Leicester, UK) equipped with an LK-031 laser triangulation head (Keyence Corp., Osaka, Japan). In this head, a semiconductor laser (wavelength: λ = 670 nm) was used, allowing one to carry out measurements in a range of 10 to 30 mm with resolution 1 and 3 µm, respectively. The measurement system in this configuration was used in previous experimental studies for, among other things, the assessment and analysis of the surface topography of abrasive tools, as well as surface imperfections of machined surfaces. The results obtained during the above-mentioned experiments have been described in detail in studies by Nadolny et al.50,51 and Kapłonek et al.52,53
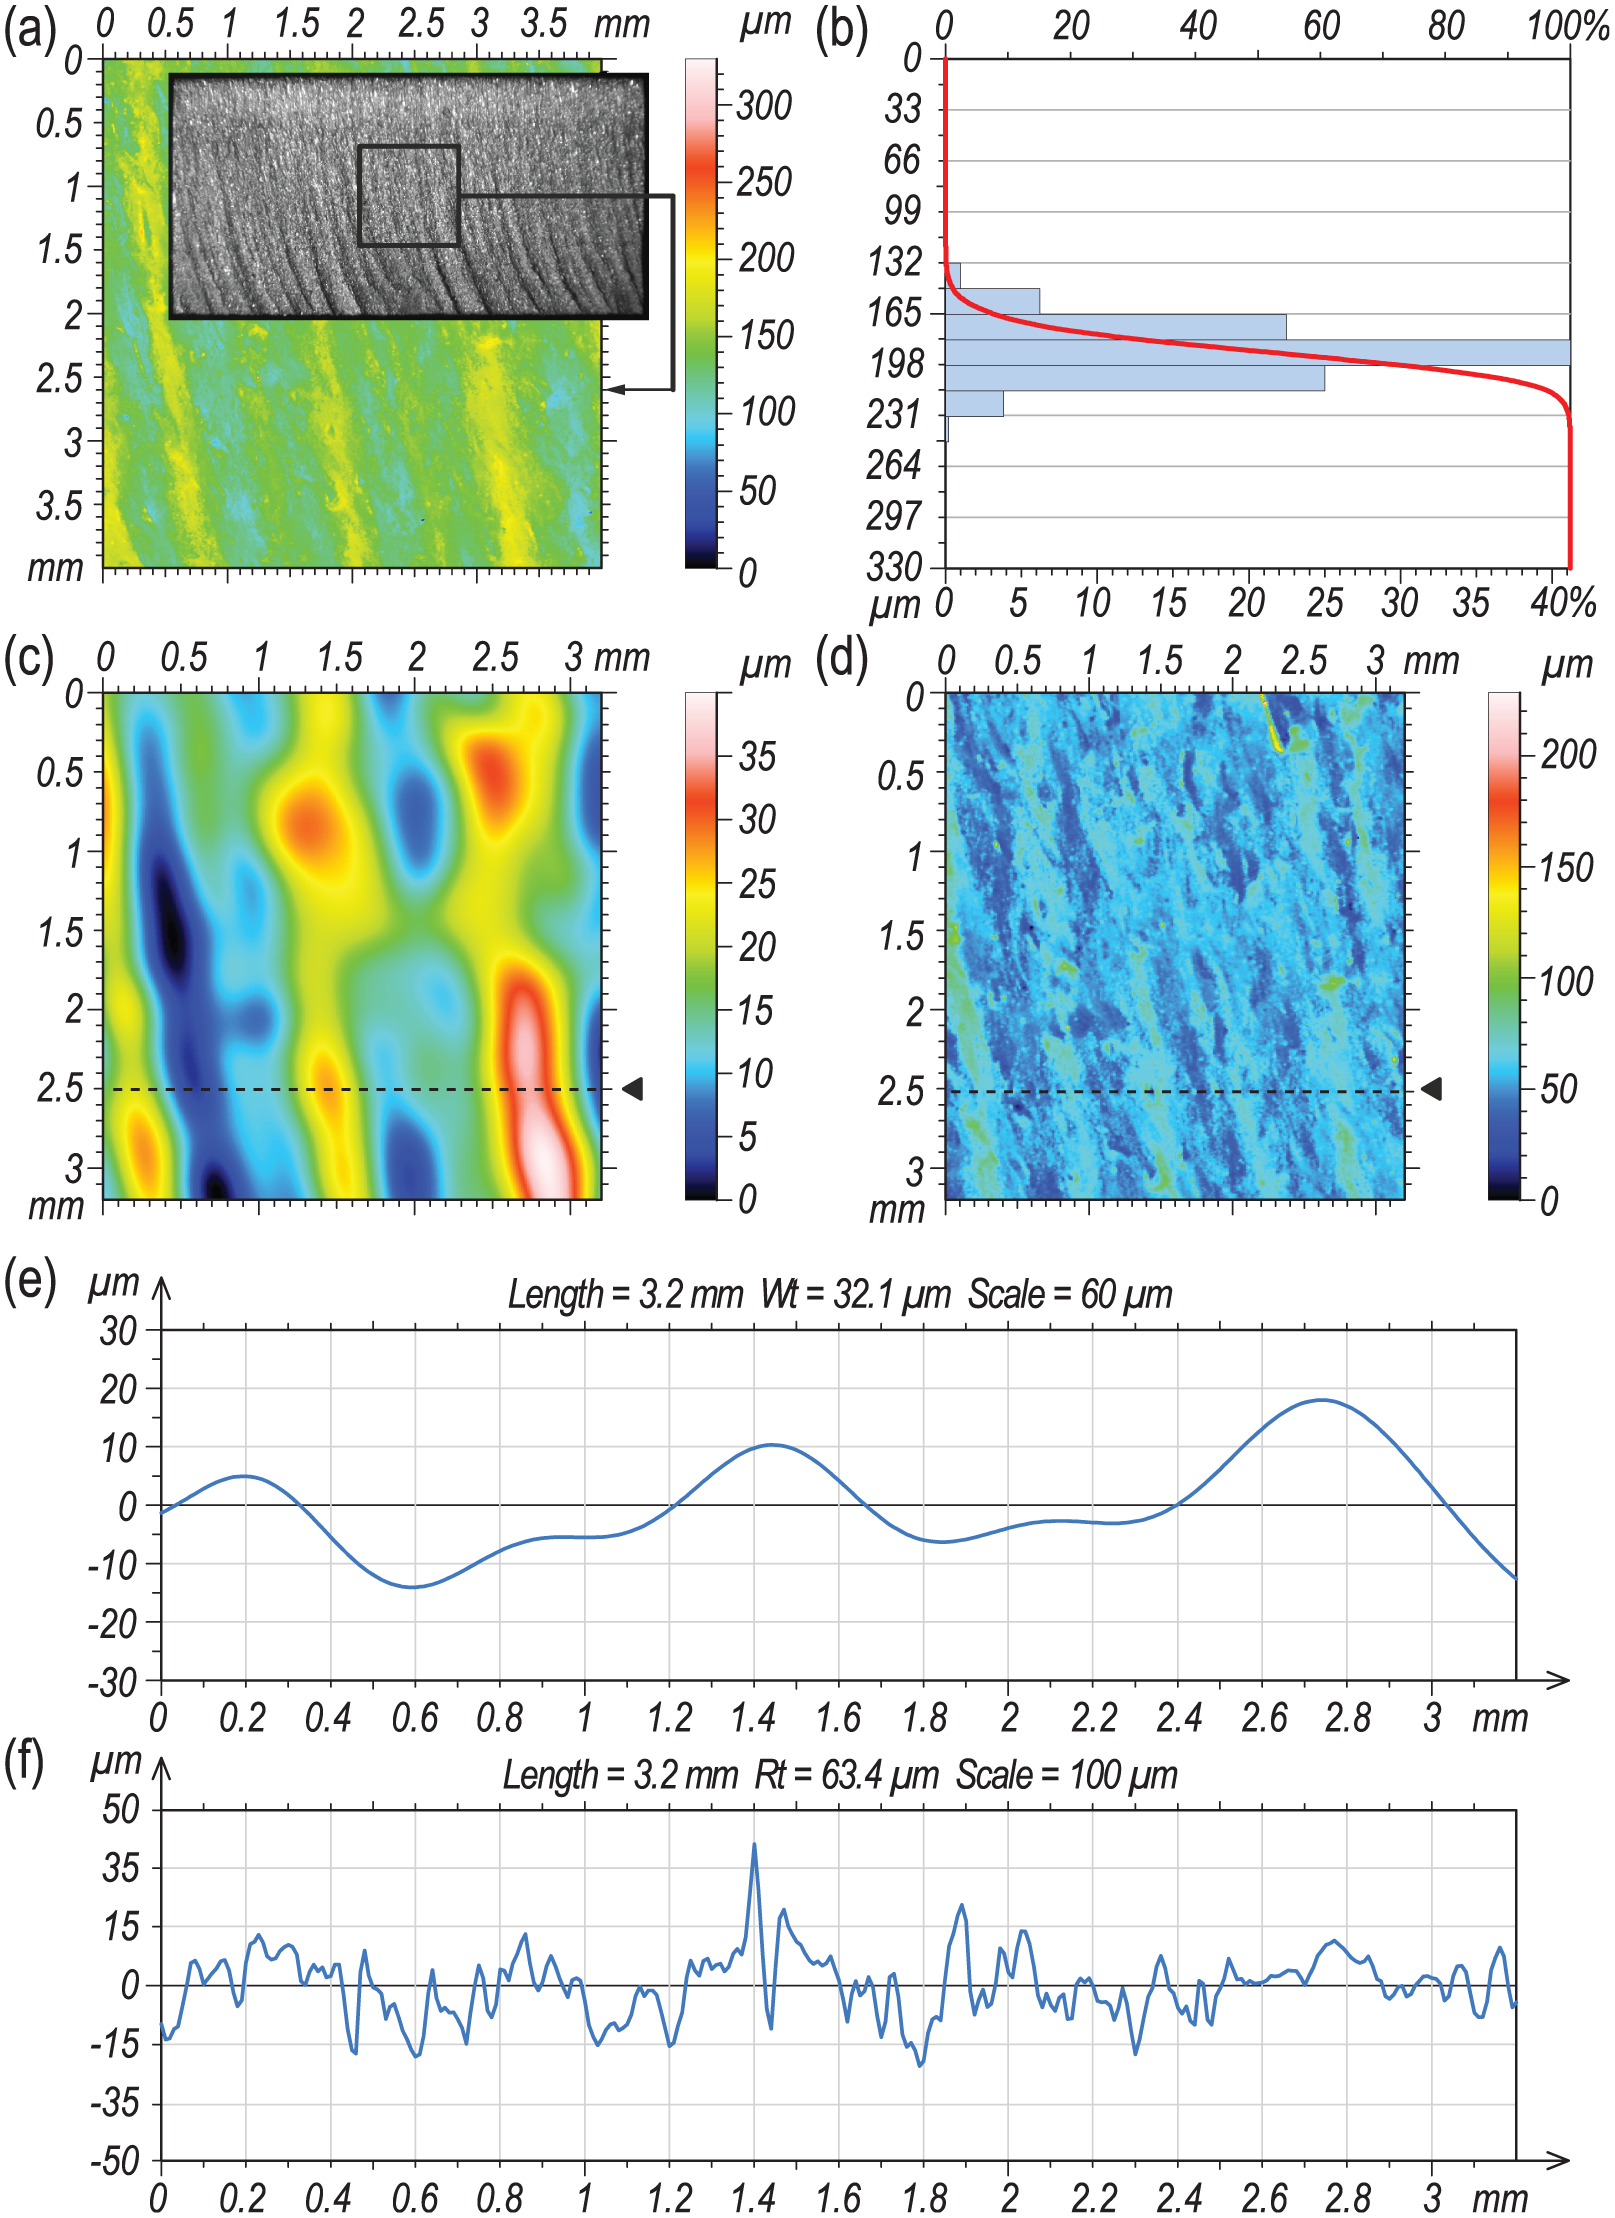
The analyses in this study included an assessment of the primary surface, as well as selected waviness and roughness parameters, both of the surface and a single profile. The set of selected parameters used for the analysis of surfaces after the AWJ cutting processes is presented in Table 6. All parameters were calculated according to ISO 25178 and ISO 12781 by TalyMap Universal 3.1 software using Mountains Technology™ produced by Digital Surf (Besançon, France).
The set of selected flatness, roughness and waviness parameters used in analysis of surfaces state of aluminium alloy 5251 samples after the AWJ cutting process.
LSPL: least squares reference plane.
Results and discussion
The experimental studies allowed one to determine the way in which the selection of the cutting process quality coefficient, using a precision OMAX 55100 JetMachining Center, influences the surface texture. In this section, the key results of measurements of surface texture following AWJ cutting, as well as the analysis of AE signals registered during this process are presented.
Surface texture analysis
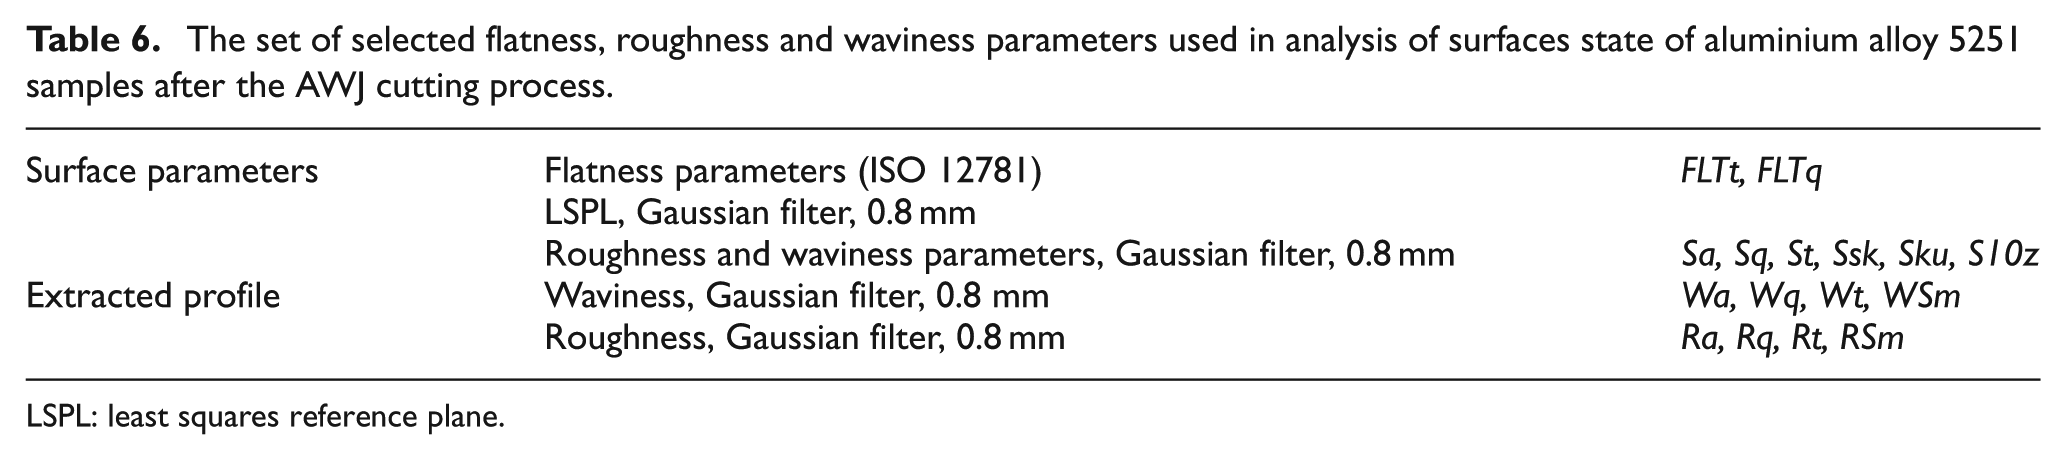
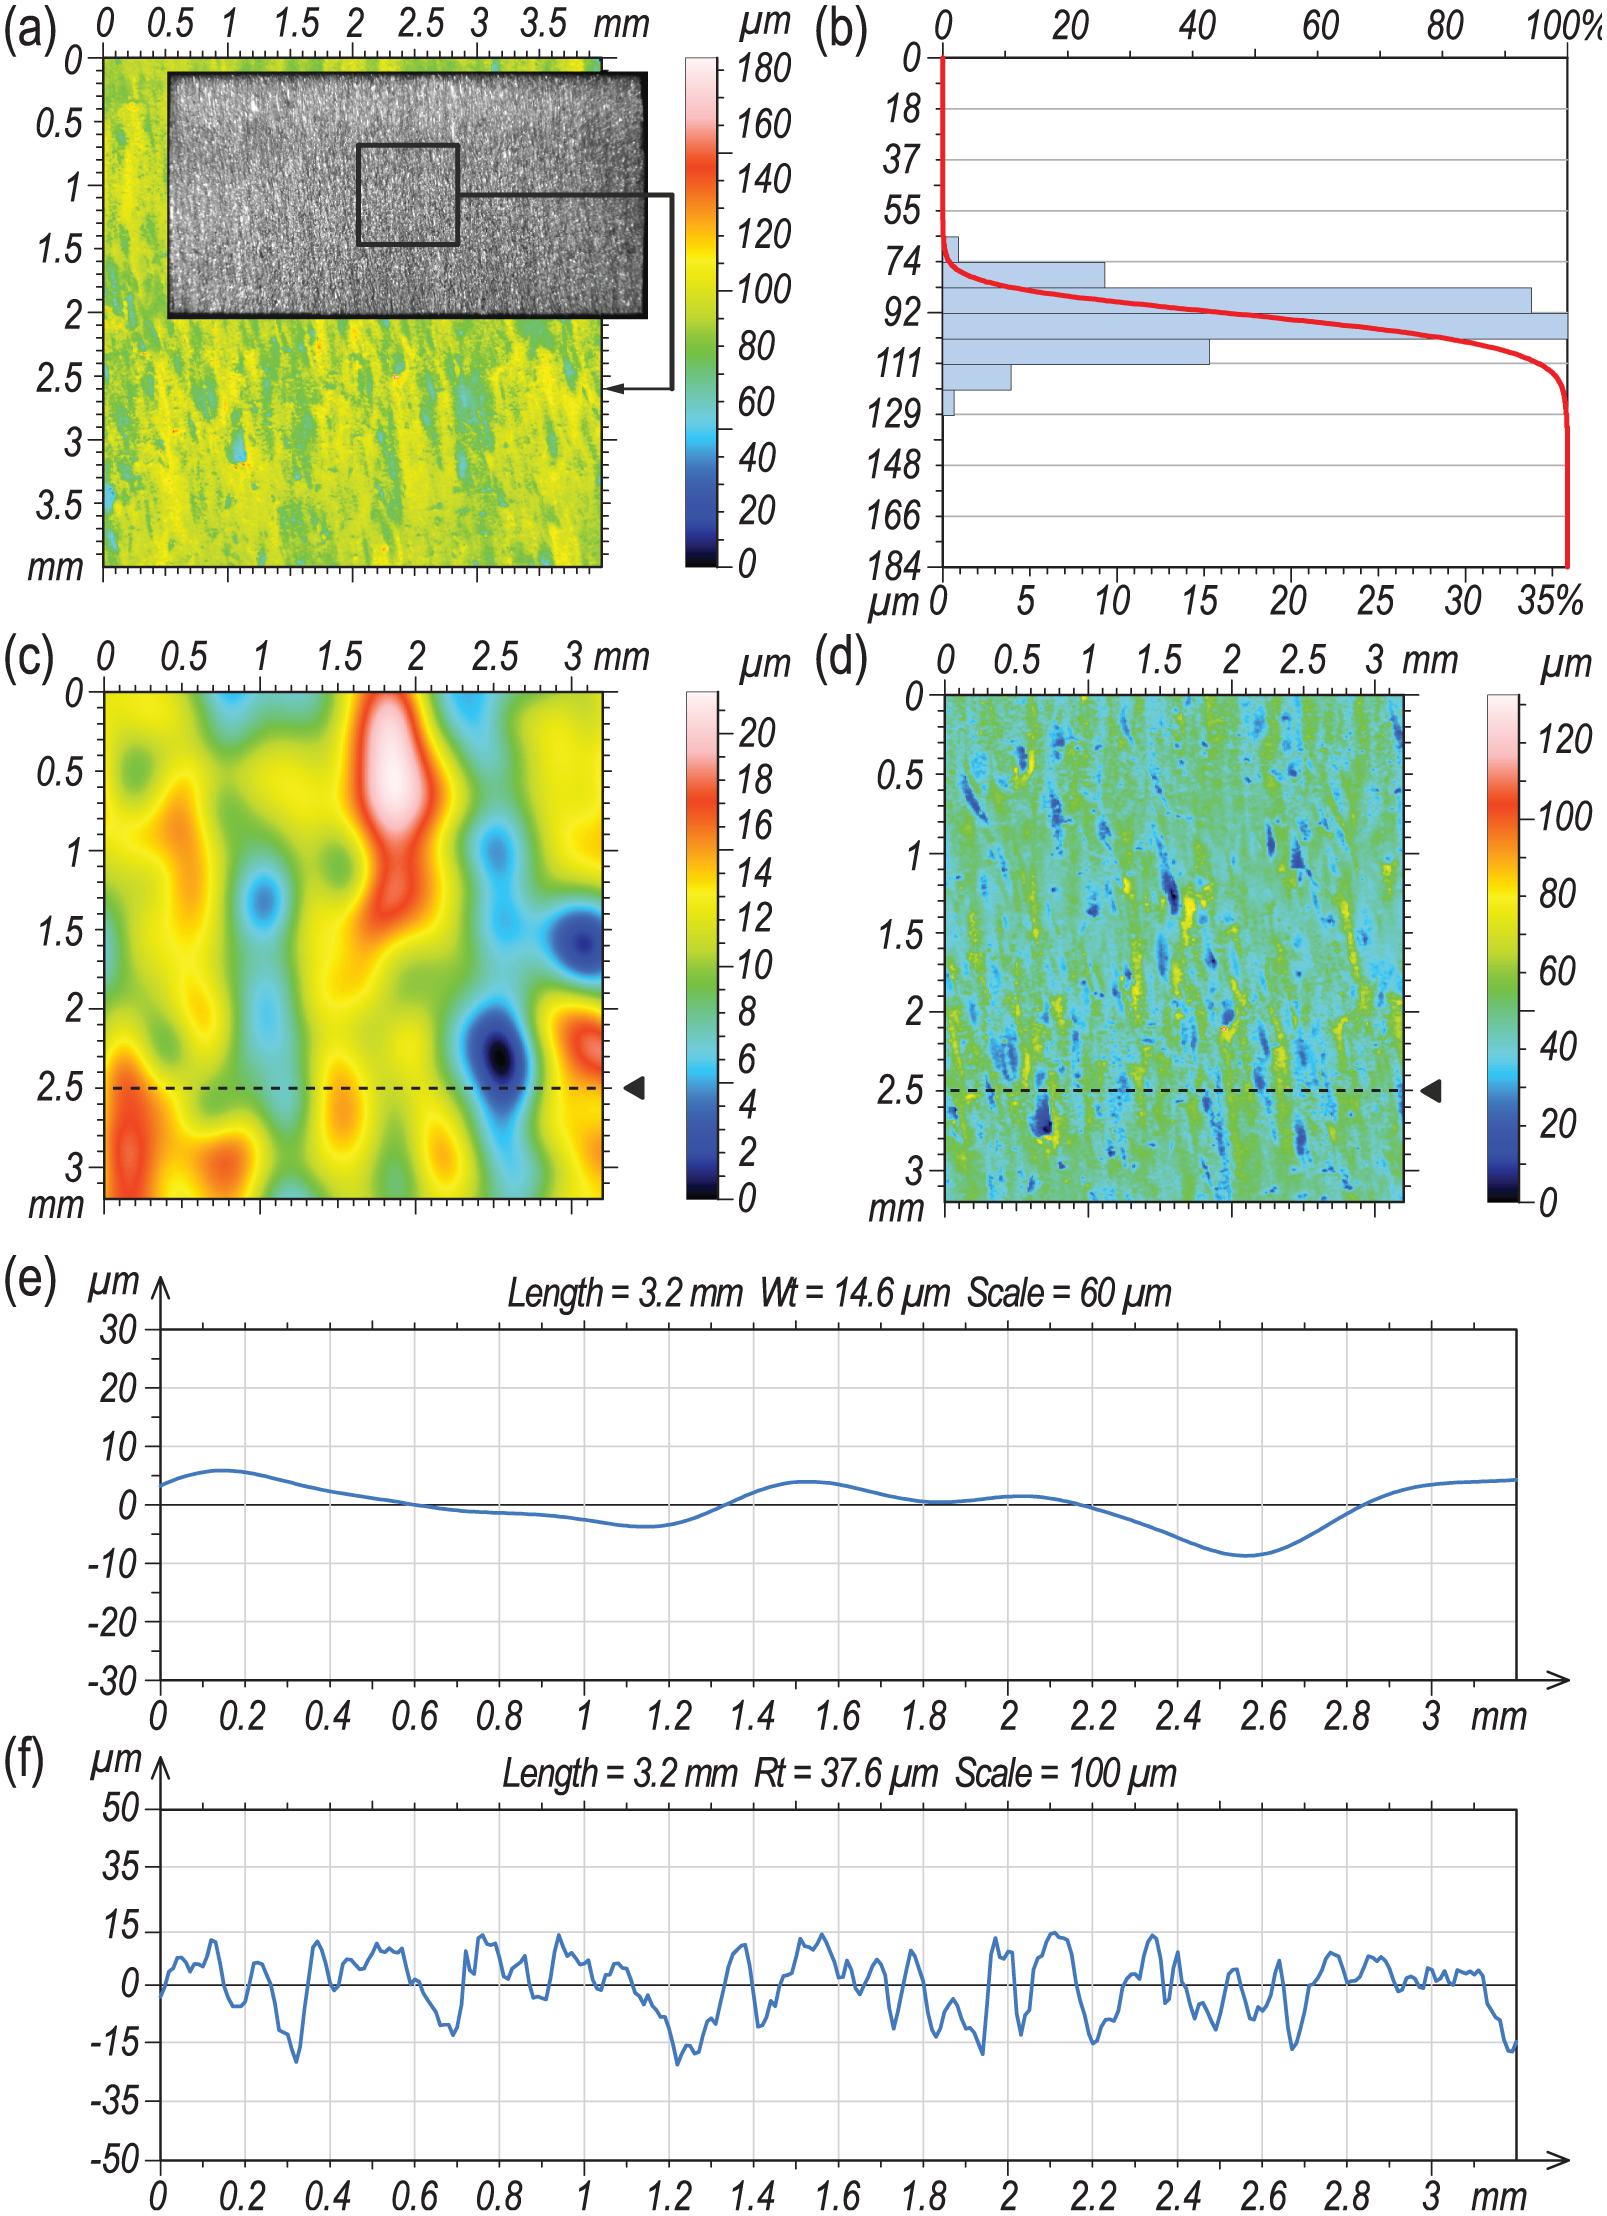
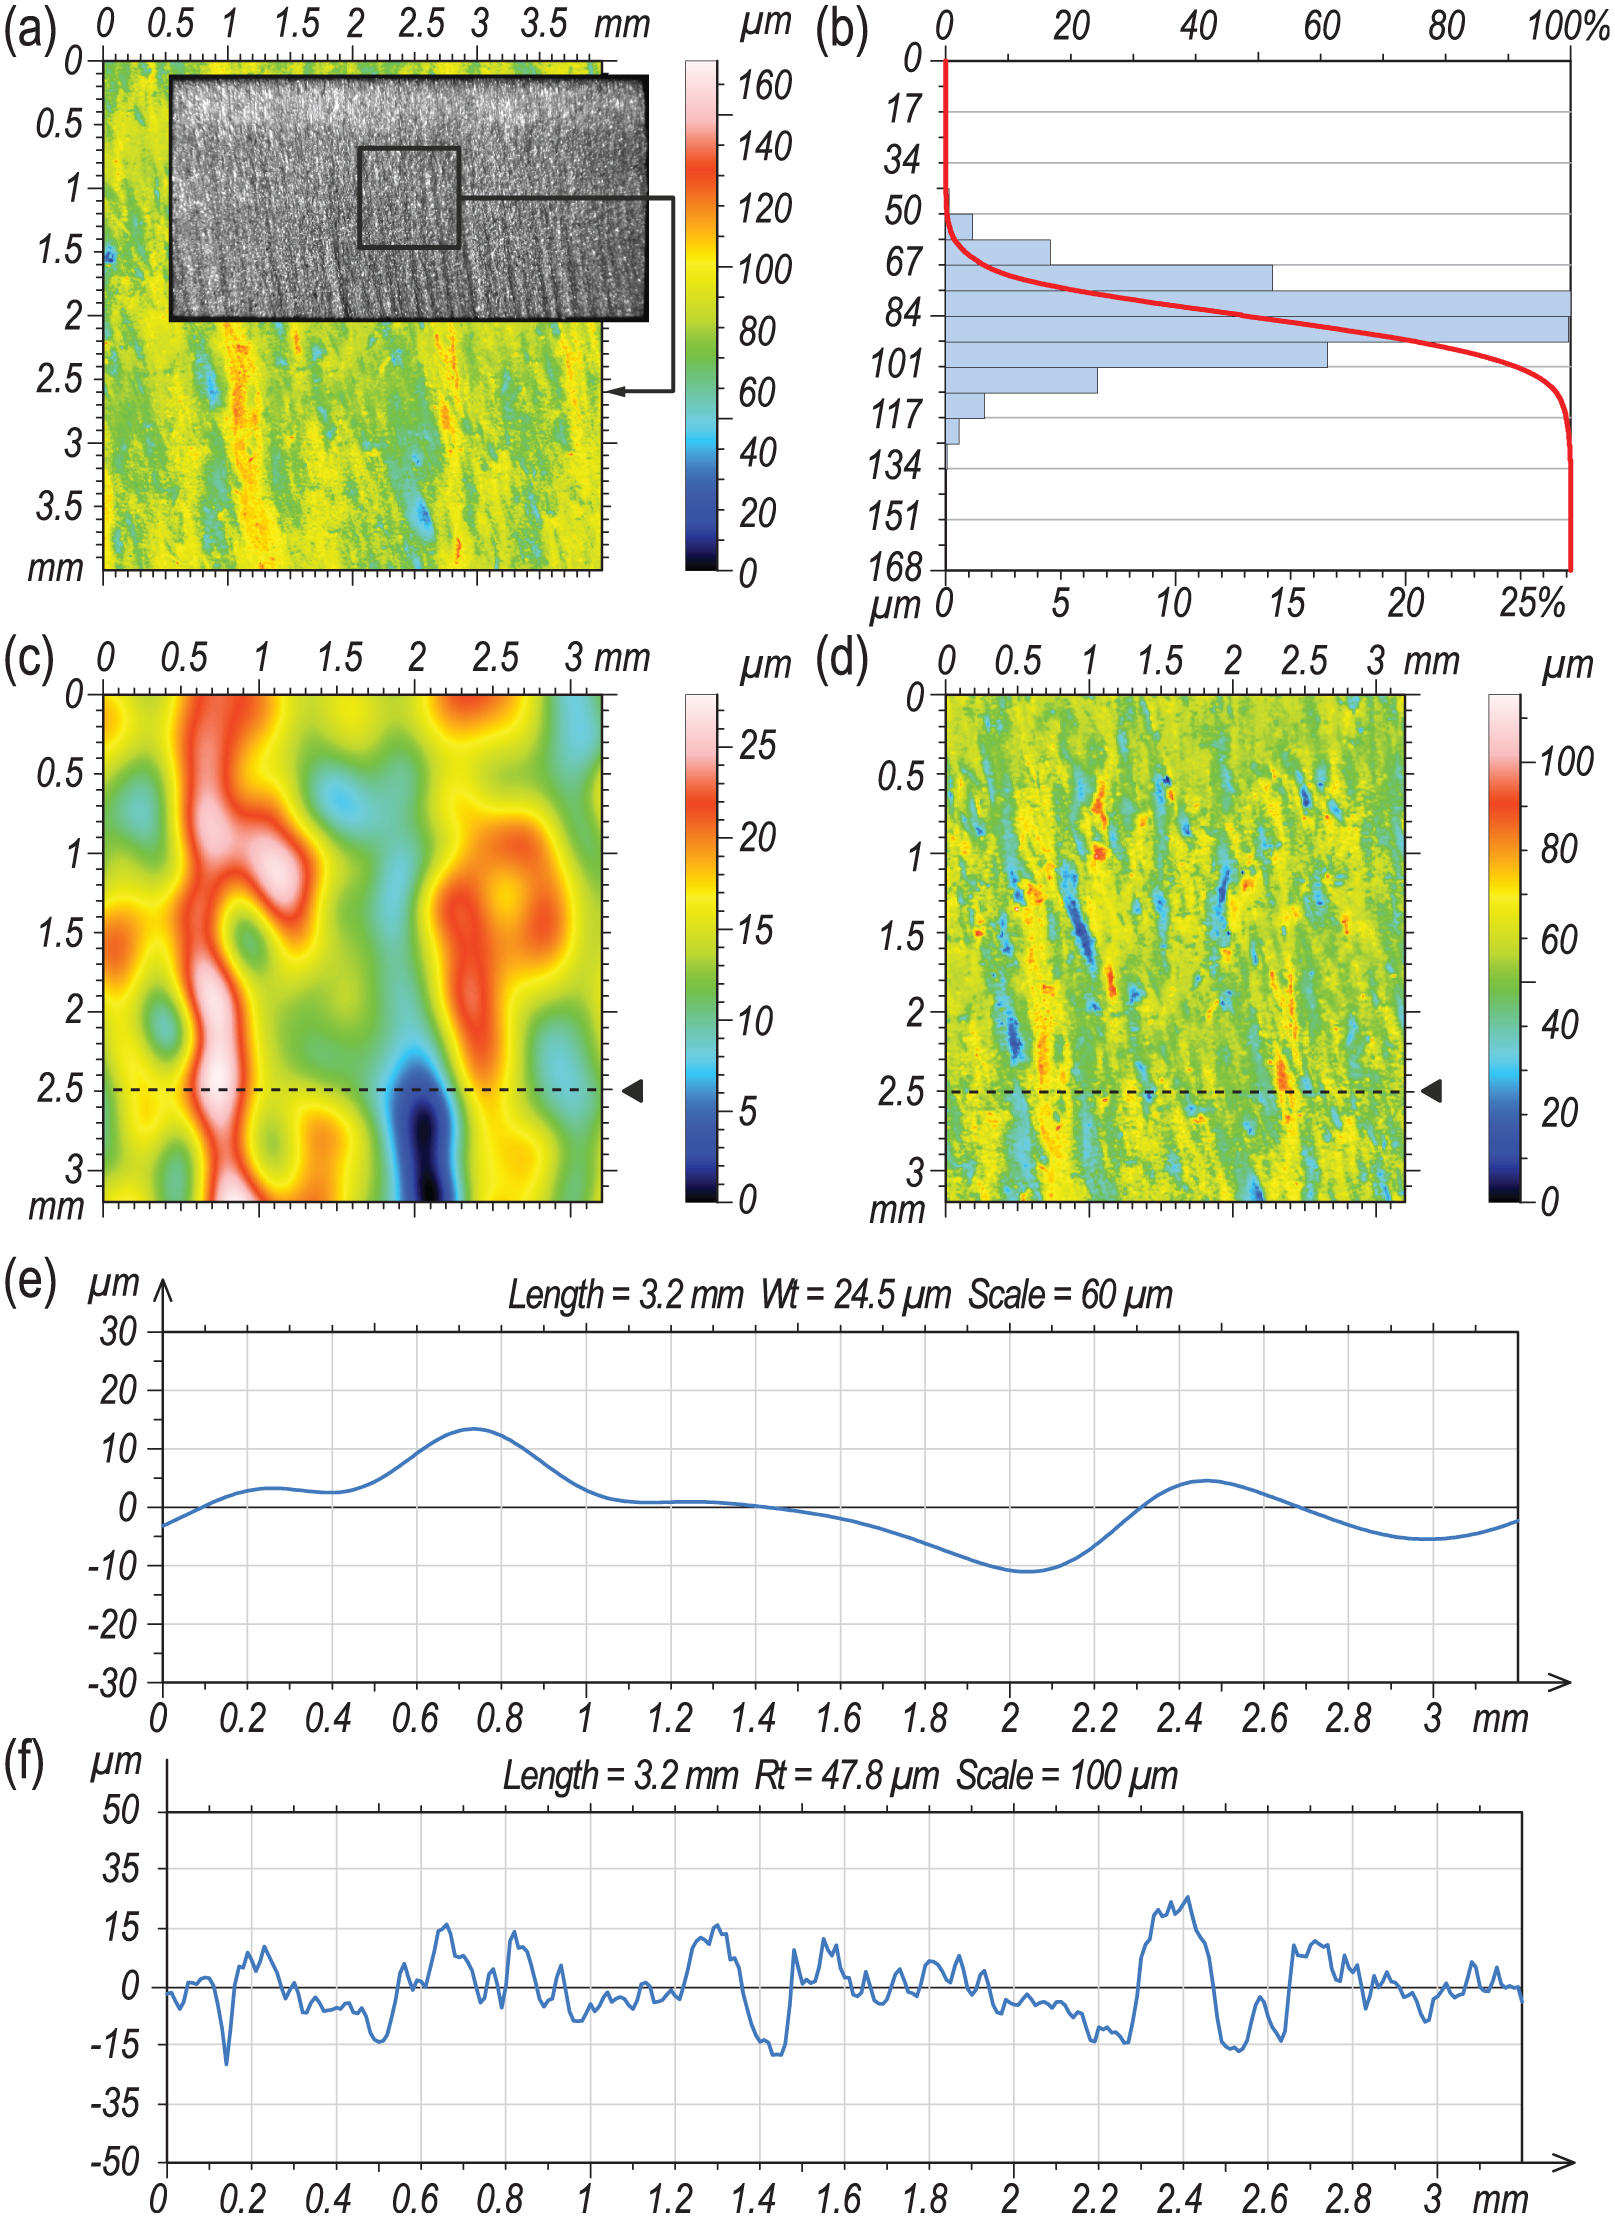
A collection of selected results presenting the state of measured surfaces after the AWJ cutting process, obtained by the use of a Taylor-Hobson Talysurf CLI 2000 optical profilometer, is presented in Figures 4–6. Each figure contains the following elements:
A real image of the surface with a marked area for analysis determined in the poor quality zone – up to 1/2 of the depth of cut;
Surface map (4 × 4 mm2) presented in indexed colours in which the roughness height is encoded with an appropriate colour;
Surface map (3.25 × 3.25 mm2) presented in indexed colours after waviness filtration (filter: Gaussian, cut-off: 0.8 mm);
An Abbott-Firestone bearing curve;
A single-surface roughness and waviness profile.
Collection of selected results of experimental studies carried out for Sample No. 2 made of aluminium 5251 alloy after the AWJ cutting process obtained by the use of a Talysurf CLI 2000 optical profilometer by Taylor-Hobson: (a) surface map measured at the centre of the sample, (b) Abbott-Firestone bearing curve, (c) surface map of roughness, (d) surface map of waviness, (e) extracted from Figure 4(c), a single-surface waviness profile and (f) extracted from Figure 4(d), a single-surface roughness profile.
Collection of selected results of experimental studies carried out for Sample No. 4 made of aluminium alloy 5251 after the AWJ cutting process obtained by the use of a Talysurf CLI 2000 optical profilometer by Taylor-Hobson: (a) surface map measured at the centre of the sample, (b) Abbott-Firestone bearing curve, (c) surface map of roughness, (d) surface map of waviness, (e) extracted from Figure 5(c), a single-surface waviness profile and (f) extracted from Figure 5(d), a single-surface roughness profile.
Collection of selected results of experimental studies carried out for Sample No. 6 made of aluminium alloy 5251 after the AWJ cutting process obtained by the use of a Talysurf CLI 2000 optical profilometer by Taylor-Hobson: (a) surface map measured at the centre of the sample, (b) Abbott-Firestone bearing curve, (c) surface map of roughness, (d) surface map of waviness, (e) extracted from Figure 6(c), a single-surface waviness profile and (f) extracted from Figure 6(d), a single-surface roughness profile.
As the fact that the quality of the surface becomes worse with increasing feed speed is commonly known, the authors decided not to present any comparison between the different faces of the samples. The main reason for presenting the surface texture results was to investigate the correlation between its parameters and the selected parameters of the AE signal.
Analysis of Figures 4–6 shows that increasing the traverse speed during cutting of aluminium alloy 5251 caused an increase in the irregularities occurring on the cut surface, both in terms of roughness and waviness.
Moreover, two-dimensional (2D) surface contour maps, generated after sample scanning, filtration and removal of surface curvature, present a clear difference between Qualities 5 and 3 (Figures 4(a) and 5(a)) with the worst value marked as 1 (Figure 6(a)). The maximum value of surface irregularities (320 µm) was obtained for Sample No. 6. The Abbott-Firestone bearing curves (Figures 4(b)–6(b)) indicate that the relationship between the height of surface irregularities and the selected traverse speed does not result from a random single apex located on the examined surface areas. When the cutting process was carried out both with the lowest (vf = 232 mm/min) and a medium traverse speed (vf = 418 mm/min), the most numerous group of apexes occurring on the cut surface reached heights ranging from 80 to 110 µm (Figures 4(b) and 5(b)). For the highest traverse speed (vf = 776 mm/min), apexes with heights of 170–210 µm were the most numerous (Figure 6(b)).
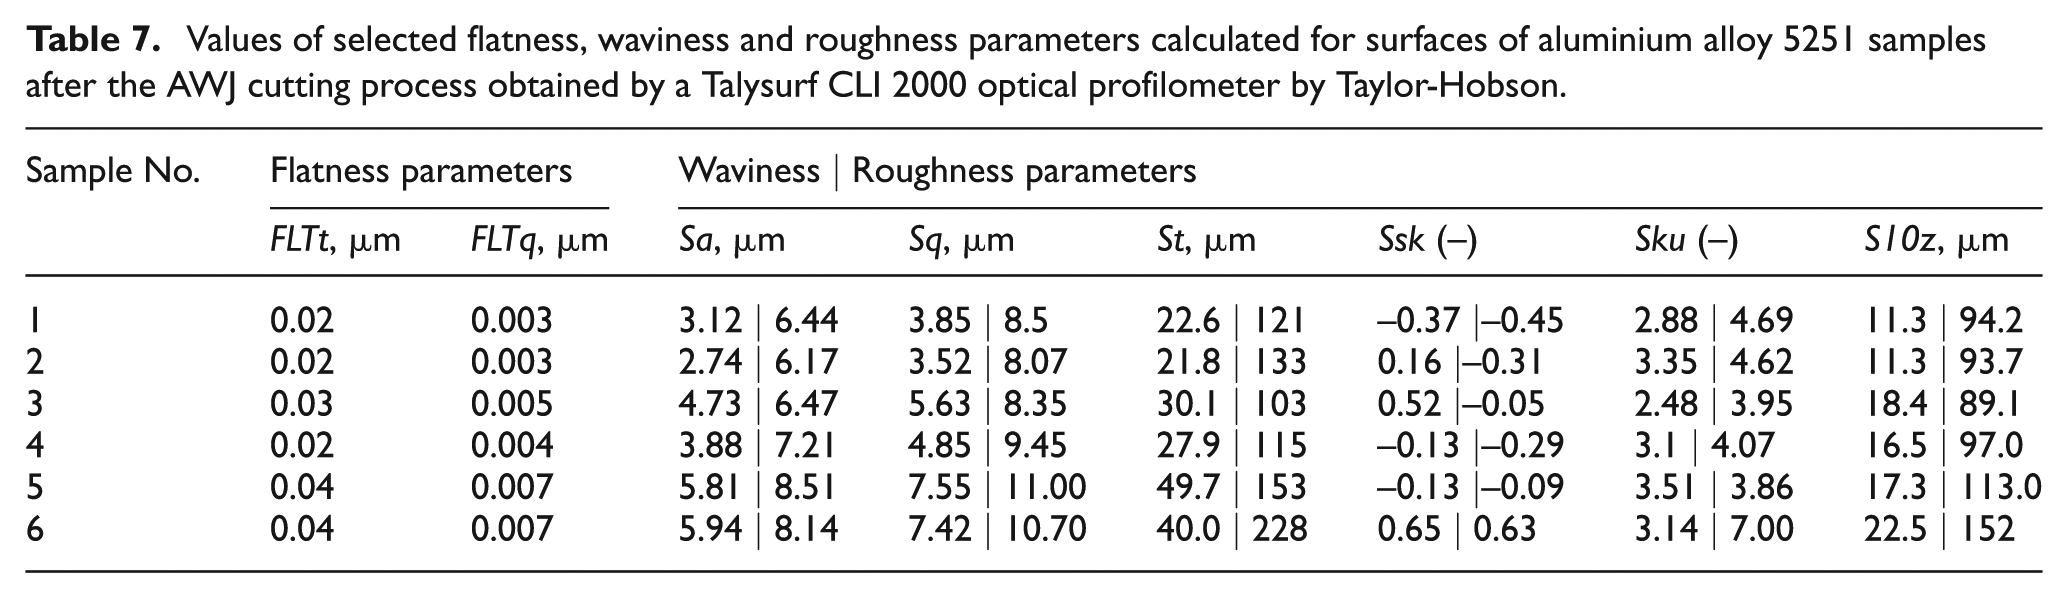
The obtained results of measurements of surface quality after the AWJ cutting process, expressed in flatness, roughness and waviness parameters, were indicative of considerable surface texture differences. These parameters are given in Tables 7 and 8.
Values of selected flatness, waviness and roughness parameters calculated for surfaces of aluminium alloy 5251 samples after the AWJ cutting process obtained by a Talysurf CLI 2000 optical profilometer by Taylor-Hobson.
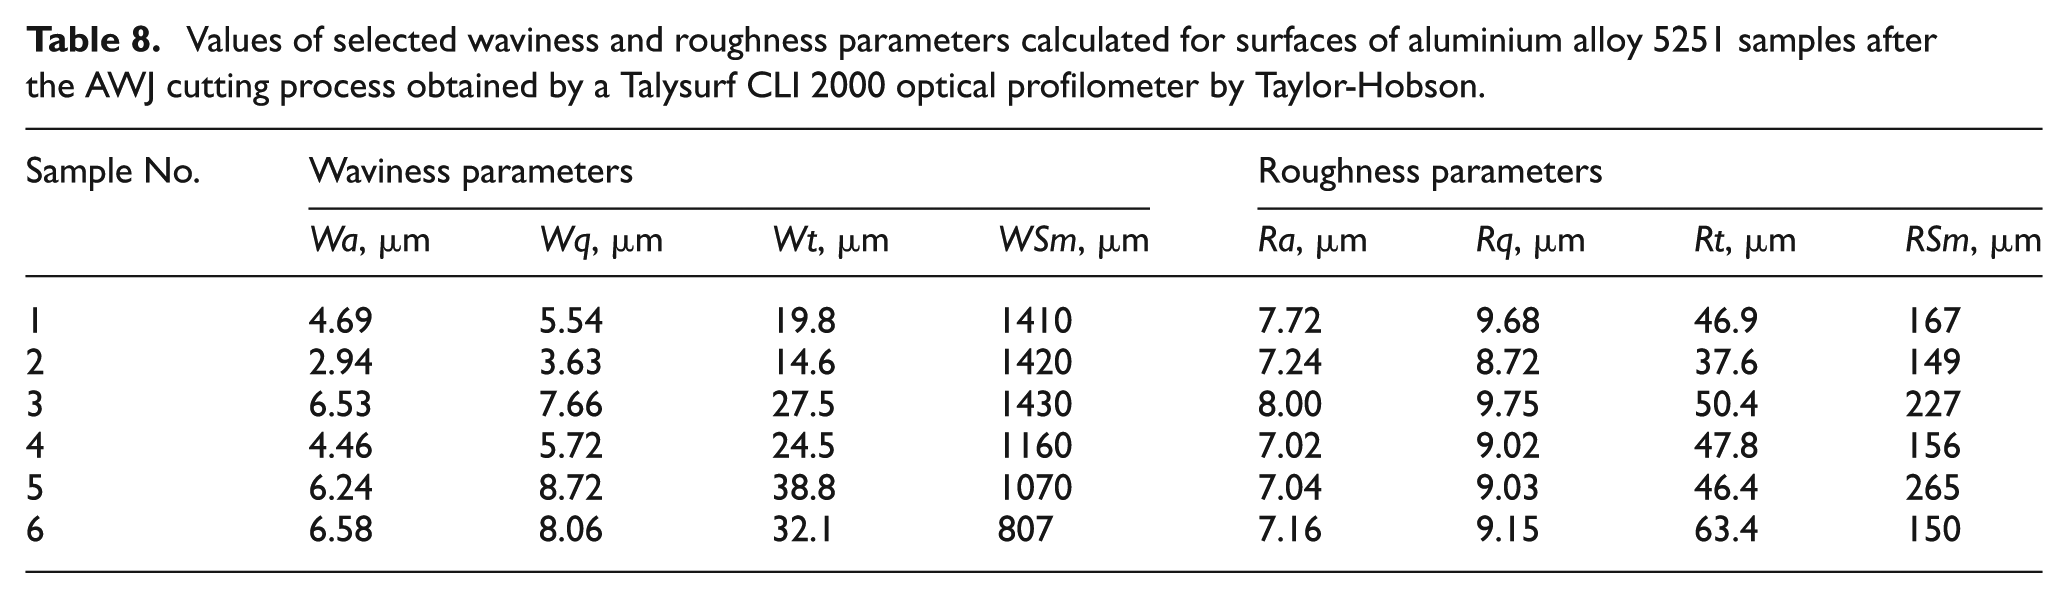
Values of selected waviness and roughness parameters calculated for surfaces of aluminium alloy 5251 samples after the AWJ cutting process obtained by a Talysurf CLI 2000 optical profilometer by Taylor-Hobson.
Flatness of the examined surfaces (Table 7) for Samples No. 1 and No. 2 assumed a value of FLTt = 0.02 µm; for Samples No. 3 and No. 4: 0.03 µm; while in the case of setting the worst cutting quality, its value increased to 0.04 µm. The progressive loss of flatness indicates a proportional decrease in the cut surface quality and an increase in the traverse speed (vf).
The Abbott-Firestone bearing curves regarding surface waviness analysis are presented in Figures 4(c)–6(c). A change in the traverse speed from vf = 232 to vf = 776 mm/min led to an intensification of machining marks on the cut surfaces, which is expressed in the changing height irregularities. All the values of surface waviness height parameters (Table 7) consecutively increase as the process quality coefficient decreases. For example, parameter St increases to a value of approximately 20 µm (in cases of application of a quality indicator = 5) to over 40 µm (for Quality = 1).
When comparing the 2D surface maps (Figures 4(c)–6(c) and Figures 4(d)–6(d)), as well as the waviness and roughness parameters (Table 8), it may be observed that in the surface texture after the AWJ cutting process, irregularities with relatively small apex distances dominate. A detailed analysis shows approximately a fivefold increase in the height of irregularities in the case of parameter St.
The graphic form of the waviness and roughness single profiles, determined at a distance of 2.5 mm from the beginning of the analysed area, is presented in Figures 4(e)–6(e) and Figures 4(f)–6(f). Increasing the machining parameter during the cutting process caused an increase in the waviness amplitude and a decrease in the distance between the post-machining marks (expressed by the WSm parameters in the waviness profile). Similar conclusions can be drawn when analysing the roughness profile parameters. Shortening the cutting time resulted in an increase in the unevenness height Rt and in the mean distance between the roughness profile elements RSm.
The above-mentioned results of measurements of the surface texture after the AWJ cutting process are indicative of the existence of a relationship between the machining parameter and cut quality discussed earlier. The changes and correlation relationships of the mean values of the selected surface topography parameters in relation to the nozzle traverse speed are presented in Figure 7.
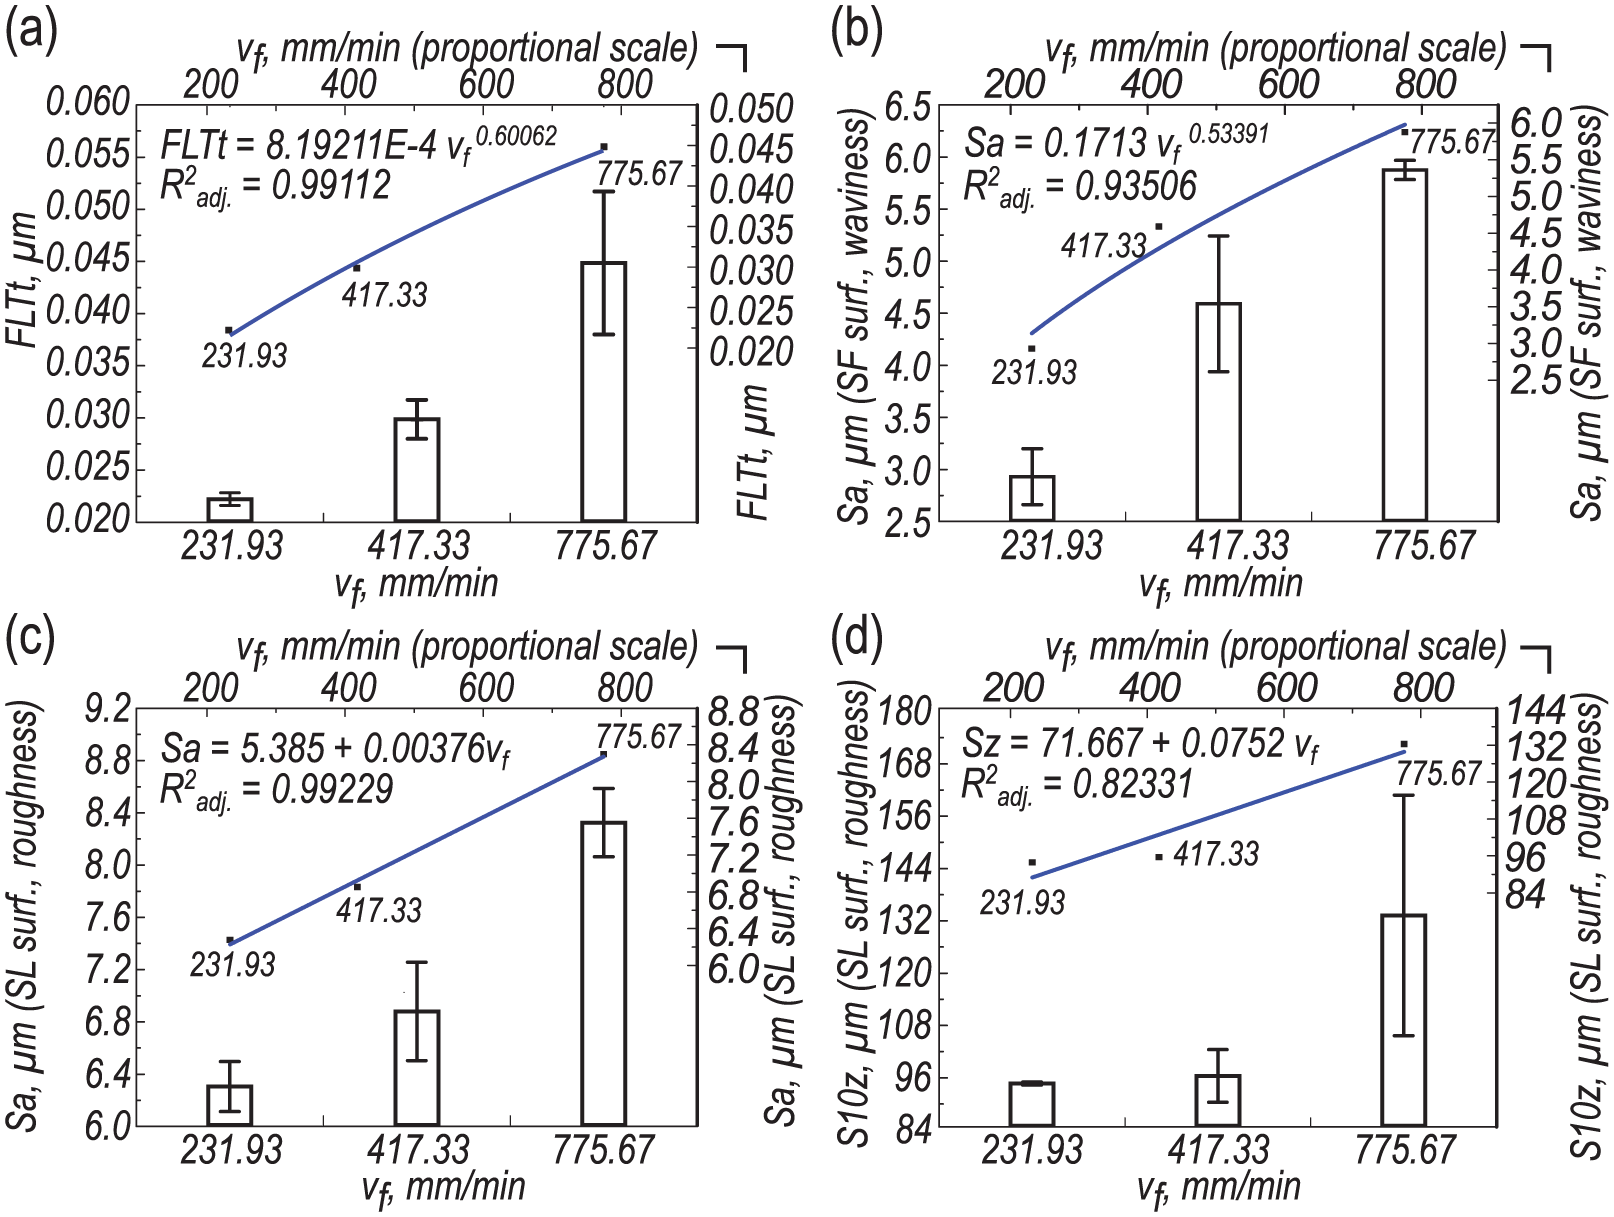
Changes and correlation relationships of the mean values of selected surface topography parameters in relation to traverse speed (cutting quality): (a) total surface flatness deviation, (b) arithmetic mean deviation of the surface waviness, (c) arithmetic mean deviation of the surface roughness and (d) level of the surface roughness based on S10z parameter.
When analysing the presented charts, close correlation relationships were observed between the following: the total surface flatness deviation (FLTt); the arithmetic mean deviation of the waviness profile (Sa (SF) – scale-limited surface (form removed and low-pass filtered surface) in order to obtain waviness parameters from extracted surface); the arithmetic mean deviation of the surface roughness (Sa (SL) – scale-limited surface (form removed, used low-pass and high-pass filters) in order to obtain roughness parameters from extracted surface); the mean distance between the five highest peaks and the five deepest valleys (S10z), as well as the traverse speed (vf). These correlations may be presented in the form of regression equations. The high values of the corrected coefficient of determination R2 adj ., exceeding 82%, were indicative of a relatively good matching of the results of the surface texture measurements to the statistically determined relationships. Increasing the traverse speed from 232 to 776 mm/min causes a progressive increase in the FLTt, Sa and S10z parameter values.
Figure 8 presents the changes and correlations of the mean values of the selected parameters of a single-surface profile in relation to the traverse speed (cutting quality). The graphically presented measurement results confirm the fact that shortening the cutting time causes a deterioration in the quality of the cut surfaces. In each of the four analysed cases, increasing the traverse speed caused an increase in the surface profile parameter value.
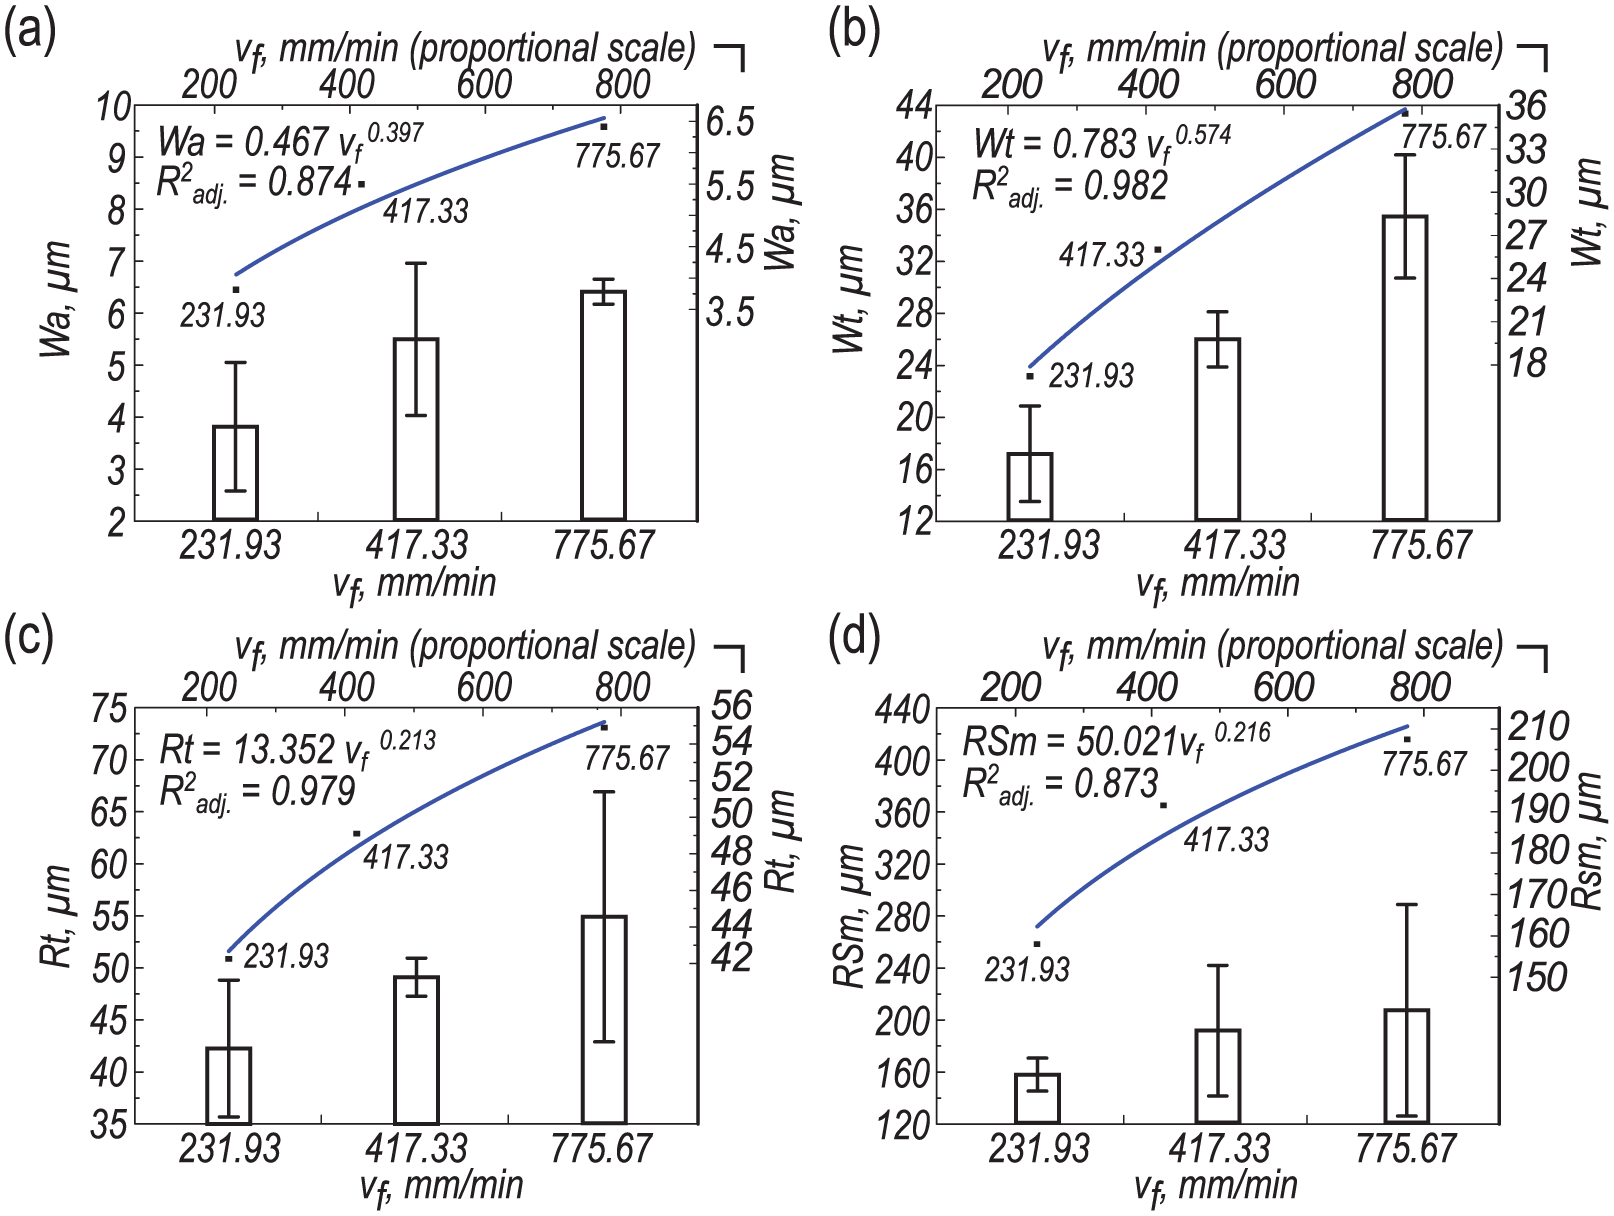
Changes and correlation relationships of the mean values of the selected surface profile parameters in relation to traverse speed (cutting quality): (a) arithmetic mean deviation of the waviness profile, (b) total height of the waviness profile, (c) total height of the roughness profile and (d) mean width of the roughness profile elements.
The relationships occurring between the previously discussed machining parameter and parameters Wa, Wt, Rt and RSm may be presented in the form of a power equation. The determined relationships were characterized by a relatively good matching of the surface texture measurement results to the statistically determined models. These models may be used in predicting the surface texture obtained in the AWJ cutting process.
Analysis of AE in the time and frequency domain
In order to determine the effectiveness of applying high-frequency AE signal analysis to the assessment of the surface quality obtained in the AWJ cutting process of aluminium 5251, analyses of selected AE signal descriptors were carried out.
The emitted sound reached its highest acoustic intensity when the jet entered (punched through) the material – fragment A in Figure 9. The proper cutting process was carried out with a considerably lower energy of the waves registered by the piezoelectric sensor. At this stage, only a minor part of the waterjet and the abrasive hits the material directly and cause its erosion. A lower energy of the AE impulse sources affected the registered signal, which was characterized by the amplitude ranging ±5 V (which corresponds to the value limit for the amplifier and the converter). The chart clearly shows how the AE signal amplitude changes when the cutting head changes direction (periods between subsequent surfaces marked 1–4). This phenomenon is caused by the automatic slowing down of the traverse speed in the corners.
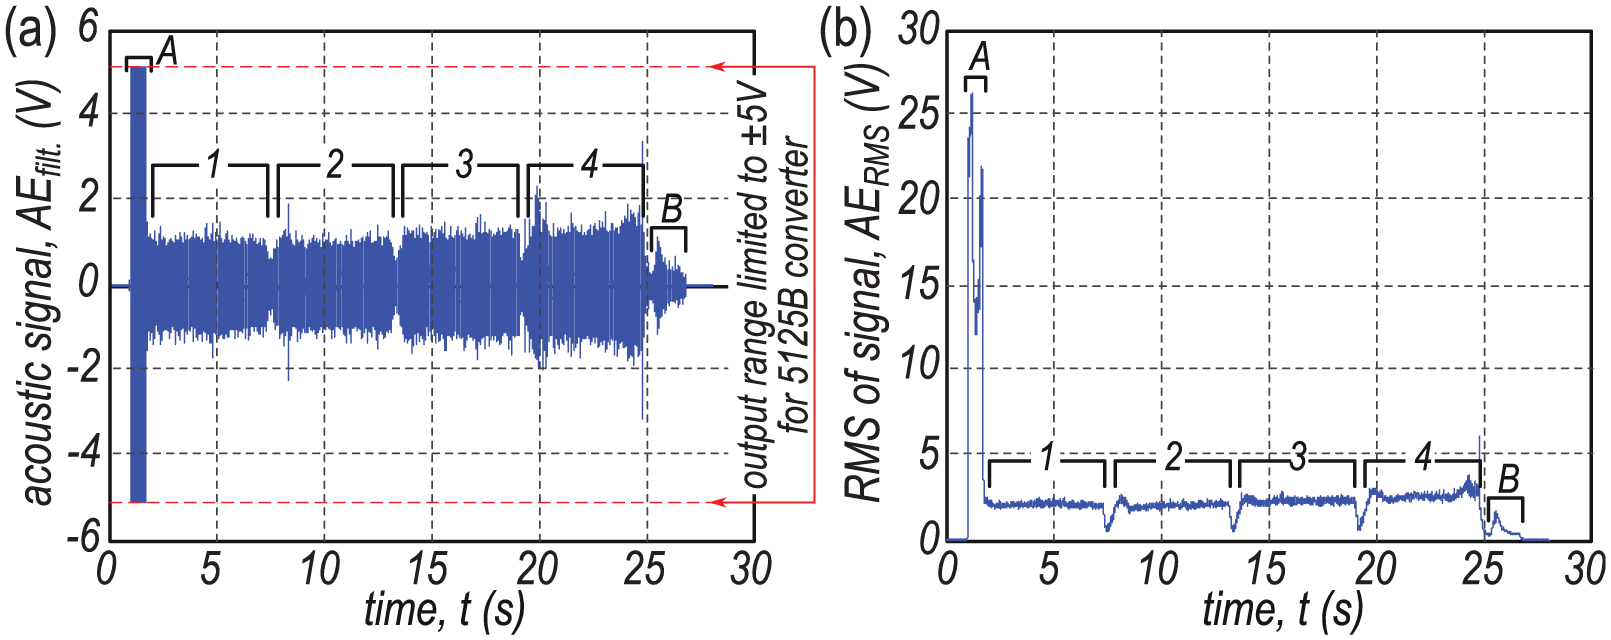
AE signal and its parts during cutting of cuboid workpiece (Sample No. 2): (a) filtered raw signal (AEfilt.) and (b) root-mean-square value of AE signal (AERMS).
The moment of the jet exiting, including pressure being turned off, is marked as B. The AE signal in this fragment of the analysed signal has the nature of a suppressed wave.
Changes in the signal energy are clearly visible in Figure 9(b), which presents the temporary root-mean-square value of the AE signal.
Changes in the AE signal values (amplitude and the effective value) registered for different cutting qualities are presented in Figure 10. Changes in the traverse speed from 232 to 776 mm/min caused an increase in the signal amplitude from 1.25 to 2.5 V, as well as of its effective value – from 2 V to the level of 5 V. In both cases, the growing variance of the mean of the observed values is clearly visible. The AERMS value represents changes in the course of the cutting process far more clearly than the signal amplitude. Simultaneous application of both of the above-mentioned statistical features may be an effective analytical tool used in evaluating the quality of the waterjet cutting process.
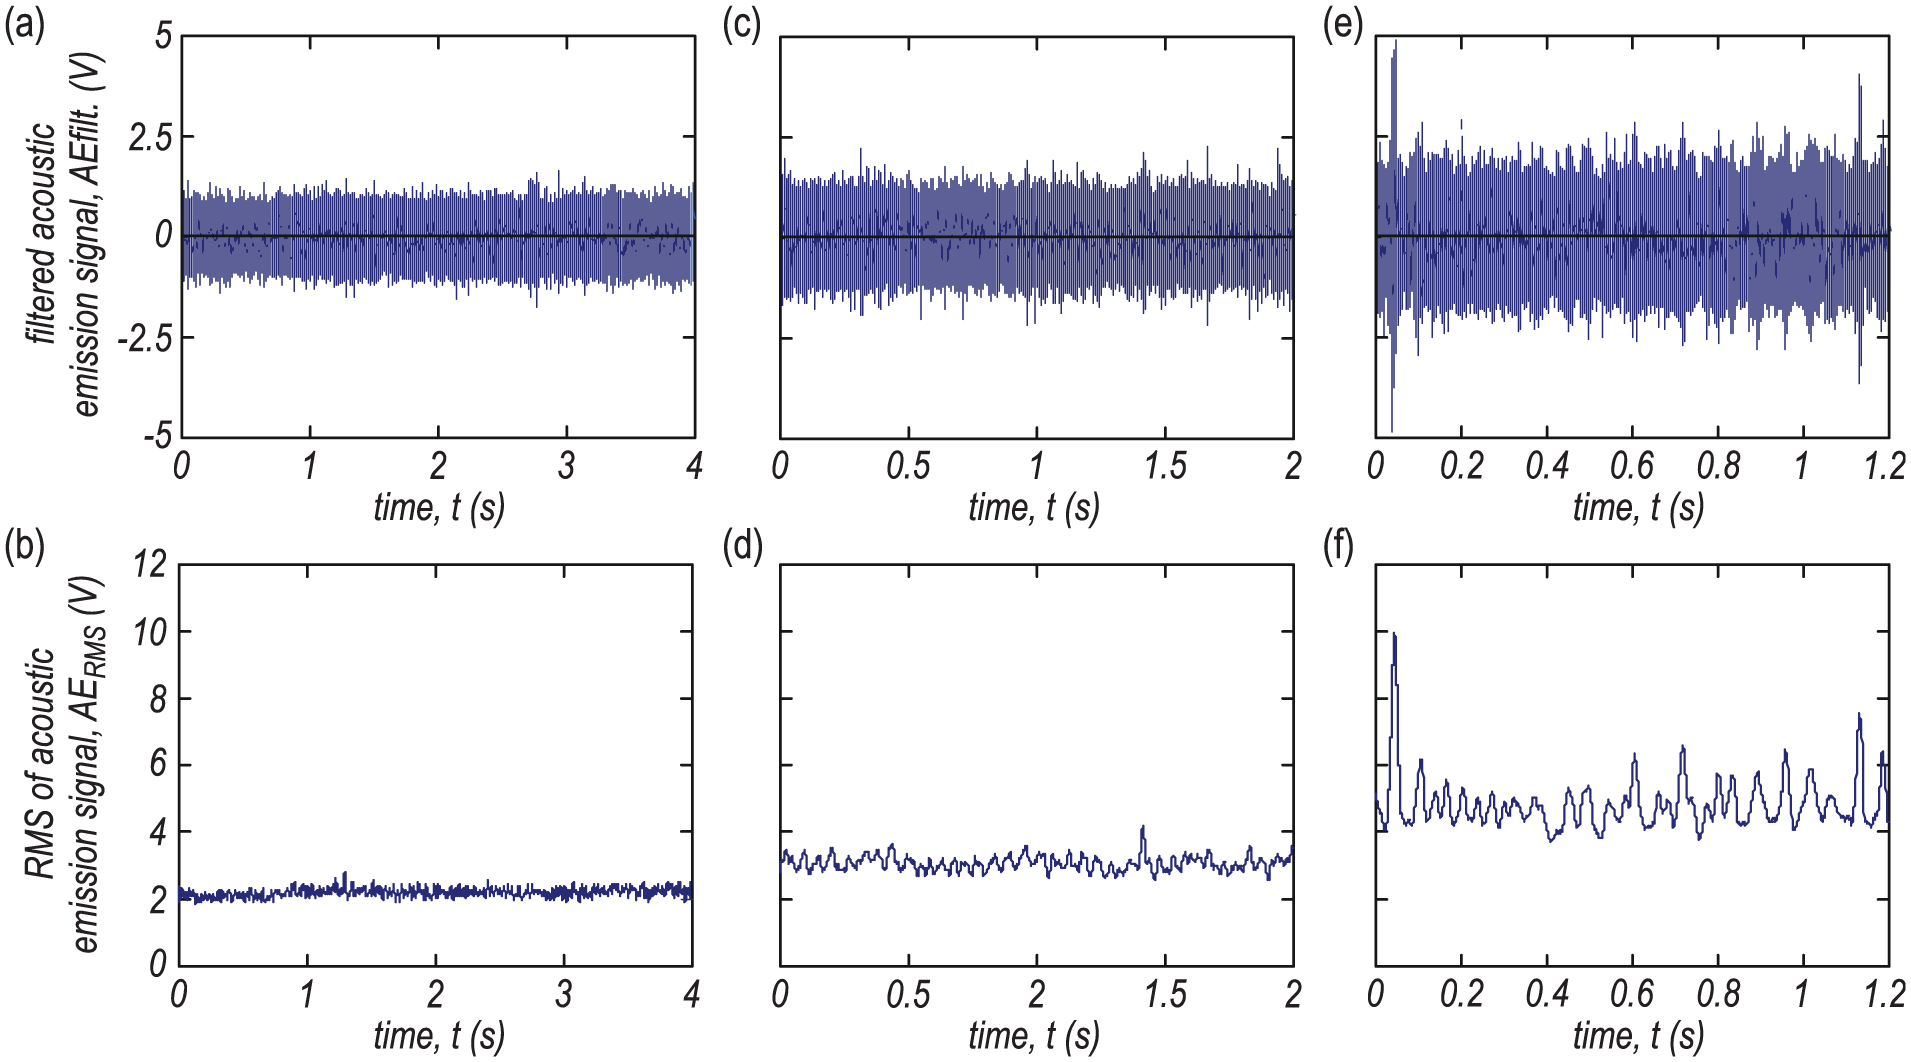
Exemplary acoustic emission values and the effective value of this signal registered for different cutting qualities: (a and b) illustrate Quality 5 (Sample No. 2), (c and d) illustrate Quality 3 (Sample No. 4) and (e and f) illustrate Quality 1 (Sample No. 6).
The above-described results of the analysis of AE signal emitted during AWJ cutting of aluminium alloy 5251 are indicative of the existence of relationships between the emitted signal and the quality of the cut surfaces. Referring this to the previously observed and determined dependencies between the traverse speed and the surface texture, it may point to a connection between the machining results and the AE signal described with the descriptors in the time domain.
The goal of the frequency domain analysis was to examine the signal parameters and properties through analysing its spectrum. The frequencies contained in the signals carry information about the properties or states of the objects under consideration, for example, biomedical signals that carry information regarding the patient’s current condition.
The Fourier transform is the basic tool for frequency analysis. Its graphic form makes it possible to determine the following: which harmonic components comprise part of a given signal; whether the signal has a limited band; what the bandwidth is; and whether it contains slow-changing (low-frequency) or fast-changing (high-frequency) components.
The results of the carried out analysis, in the form of a spectrum obtained with the non-parametric Welch’s method, are presented in Figure 11. The applied method makes it possible to estimate the power of a signal at different frequencies. Analysis of the harmonics that are part of the signal spectrum points to the main share of frequencies ranging from 100 to 400 kHz, while the components of approximately 100 kHz and around 350 kHz have the greatest power. The AE signal also contains harmonic components ranging 800–900 kHz. The observed frequencies are the structure of the AE signal shaped by selecting machining parameters, mostly water pressure and the abrasive flow rate. Connecting these elements requires, however, separate research focused on this aspect. The differences in signal spectra registered for the process carried out with different traverse speeds, and thus different process quality indicators, are limited to different powers for each harmonic component of the AE signal. Other changes were not observed as confirmed in Figure 11(b), in which the values were normalized to the range 0-1 on purpose.
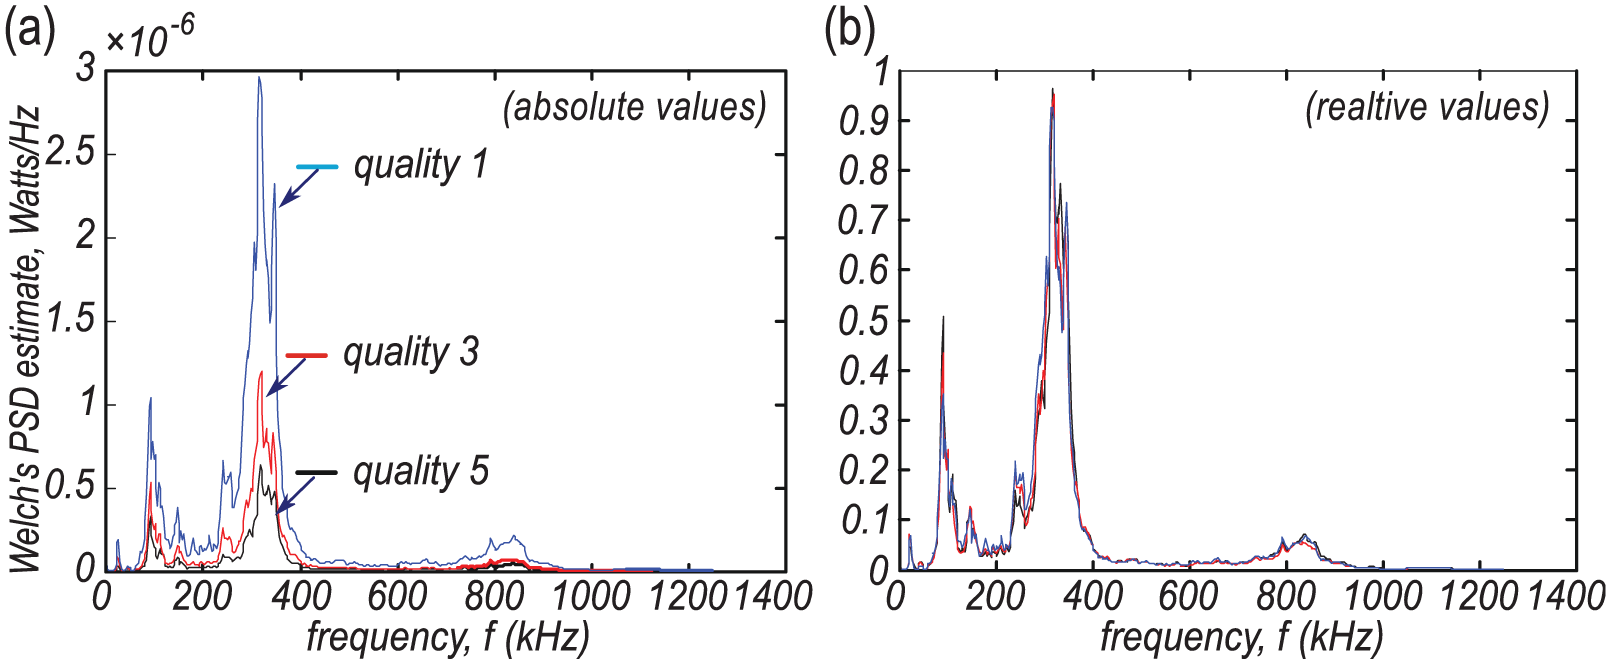
Average value of Welch’s power spectral density estimate of filtered raw AE signal during cutting of cuboid workpiece for (a) absolute values and (b) relative values.
The estimated power spectral density (PSD) function represents the averaged AE signal spectrum, while application of spectrograms makes it possible to estimate the changes in the signal as time passes. Figure 12 shows a sample visual representation of the spectrum of frequencies in an AE as they vary with time. The obtained spectrograms (Figure 12(a)) have a structure similar to the previously described AE signal spectra. At the beginning, the jet entering the material (fragment A) and the high intensity of all the components (suppression up to −60 dB) may be clearly observed. Subsequently, the process of properly cutting the subsequent edges takes place (with intervals for changing the direction of the nozzle) with suppression of the harmonic components ranging from −60 to −90 dB. At the end of the spectrogram, the moment of the jet exiting, fragment B, with a low intensity of the waves registered by the piezoelectric sensor (−80 dB and more), is clearly visible. The analysis of the whole spectrogram, as well as of a section of it representing the period of the proper cutting process (Figure 12(b)), points to the fact that the harmonic components that characterize the AE signal are virtually unchanged. Moreover, the frequencies and their power do not change. It may be clearly observed in the spectrogram that as the material is cut with the applied machining parameters, frequency components 120, 370 and 875 kHz have the highest share in shaping the AE signal structure.
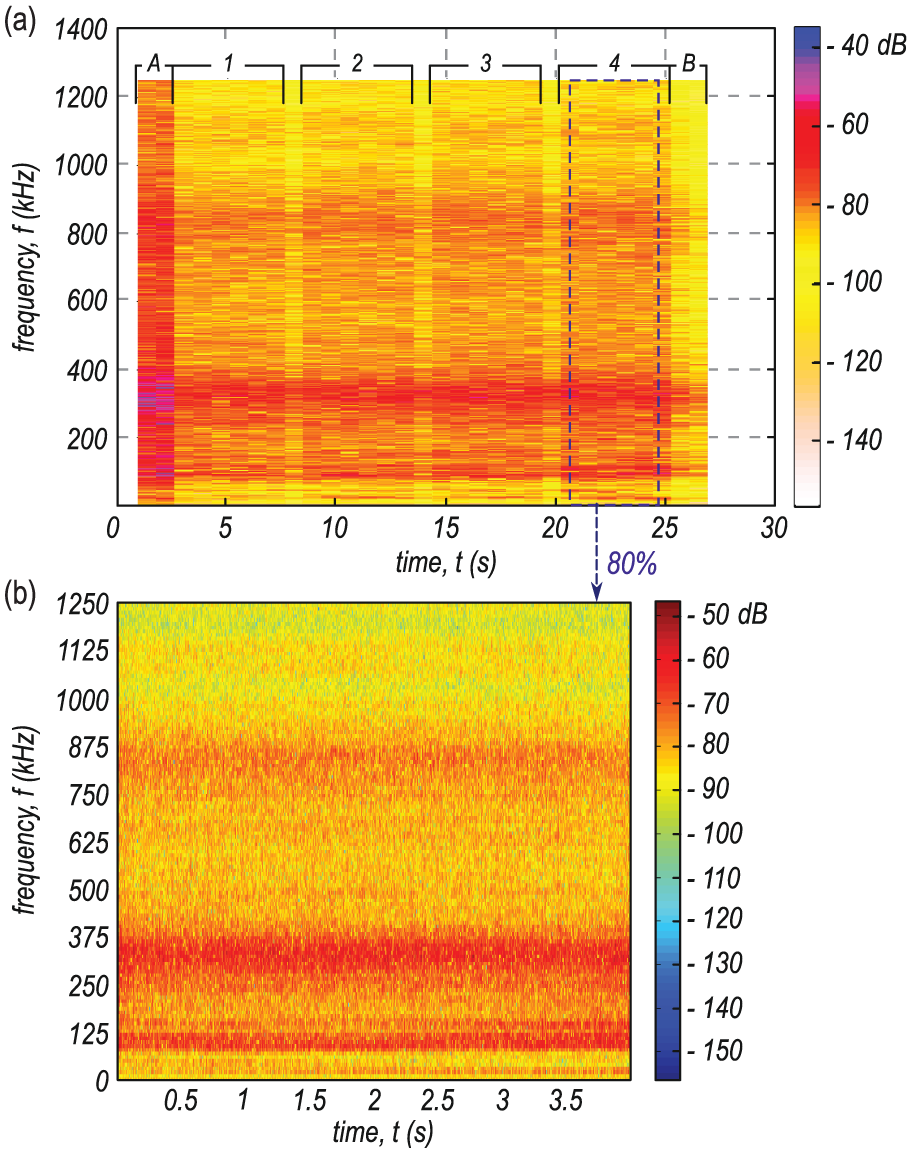
Spectrogram of filtered raw AE signal during cutting of cuboid workpiece (Sample No. 2) in cases of (a) total signal and (b) a single-surface cutting analysis.
The results of analysis in the frequency domain, focused on the quality aspect of the AWJ cutting process, are presented in a graphic form in Figures 13 and 14. In addition, Figure 13(a), (c) and (e) presents changes in the layout of the harmonic components that compose the AE signal depending on the applied process course indicator. Although these changes are subtle, the growing ‘disturbances’ may be both clearly observed and interpreted as the background that accompanies the analysed signal. When using a high-quality cut (Quality: 5), this background is virtually non-existent (Figure 13(a)). For a decreased cutting process quality (Quality: 3), the amplitude of noise in the signal is revealed, and single vertical bands may be observed on the chart that are indicative of the fact that the distribution and intensity of the harmonic components changed very quickly in short periods of time (Figure 13(b)). In case of the lowest quality (Quality: 1), the noise is so intensive that it leads to occurrence of numerous clearly outlined vertical lines on the chart displaying the spectrogram (Figure 13(b)).
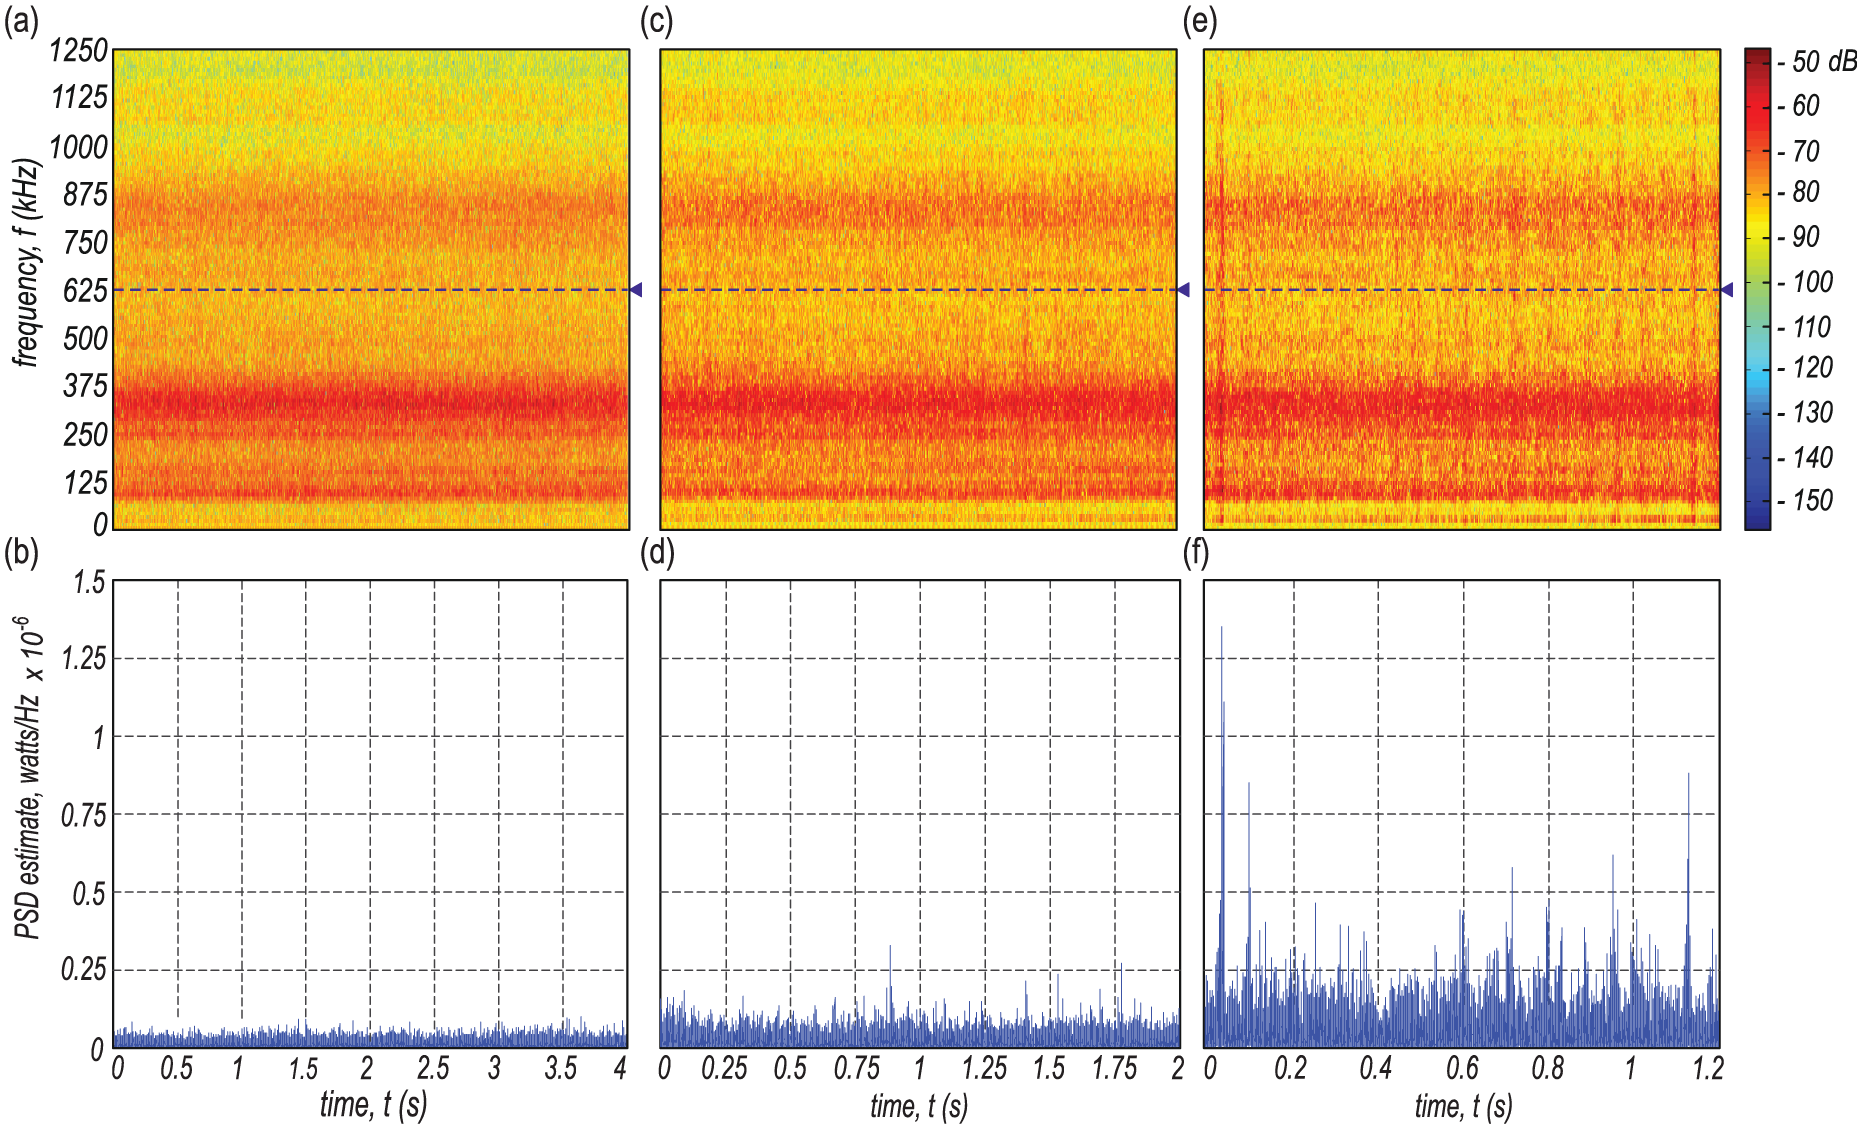
Examples of spectrograms of filtered raw AE signal and estimated power spectral density for single frequency (625 kHz) for different cutting quality values: (a and b) illustrate Quality 5 (Sample No. 2), (c and d) illustrate Quality 3 (Sample No. 4) and (e and f) illustrate Quality 1 (Sample No. 6).
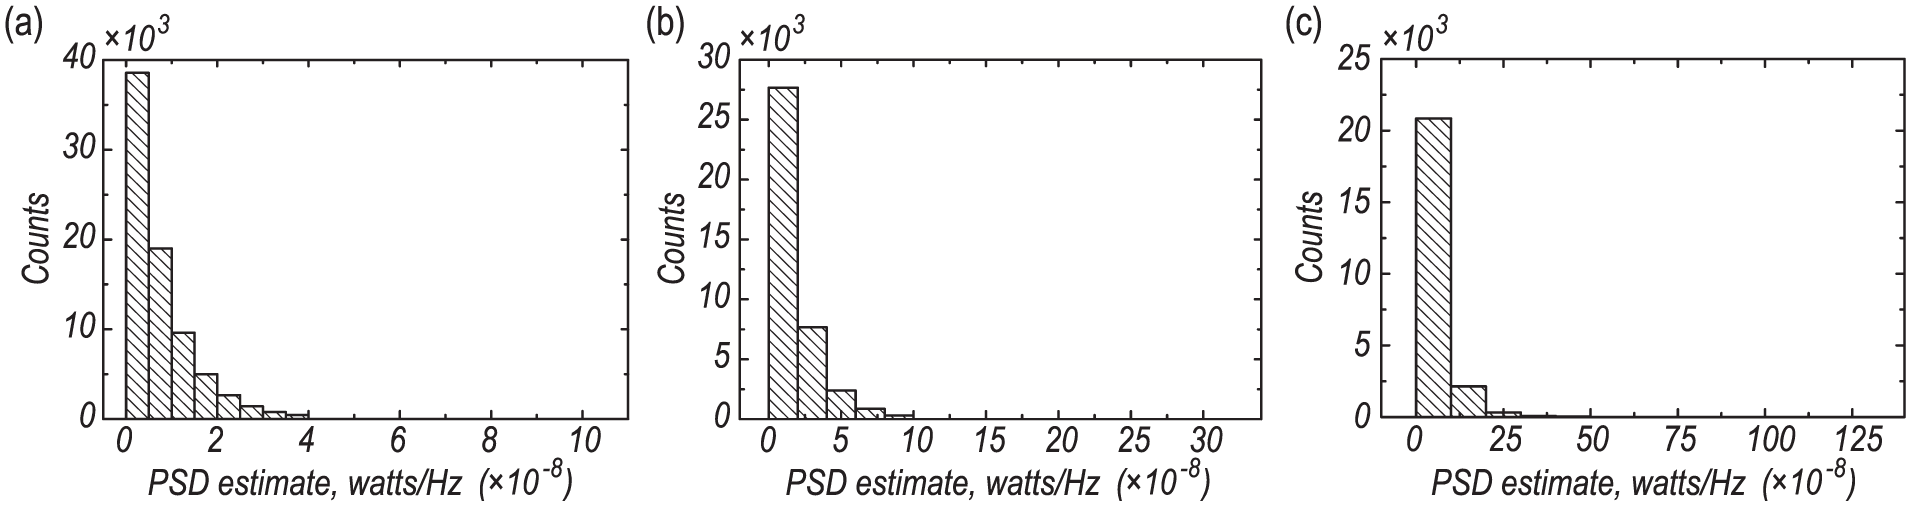
Histogram of the spectral AE signal power density value for different qualities of AWJ cutting of the material: (a) Quality 5 (Sample No. 2), (b) Quality 3 (Sample No. 4) and (c) Quality 1 (Sample No. 6).
When selecting the single PSD from the spectrogram (cross-section line at a level of f = 625 kHz in Figure 13), an increase in the signal power in the function of change in the process quality coefficient may be clearly observed (Figure 13(b), (d) and (f)). This increase is proportional to the applied traverse speed. The choice of frequency was not significant due to the nature of the spectrogram – regardless of choice, there were similar relative differences between the values of the PSD estimate for different traverse speeds. The statistical distribution of the values observed in the PSD spectrum is presented in Figure 14 in the form of histograms.
The distribution of PSD values is similar to a gamma distribution with parameters depending on the applied cutting process quality. Depending on the applied process quality indicator, the parameters that change are as follows: the mean, standard deviation, as well as distribution skewness and kurtosis. All of these statistical parameters grow as the cutting quality deteriorates. Detailed results of the calculations of the statistical parameters of the PSD spectrum for f = 625 kHz are presented in Table 9.
Selected parameters of the statistical distribution of the values describing the spectral AE signal power density (PSD) for different qualities of waterjet cutting of the material.
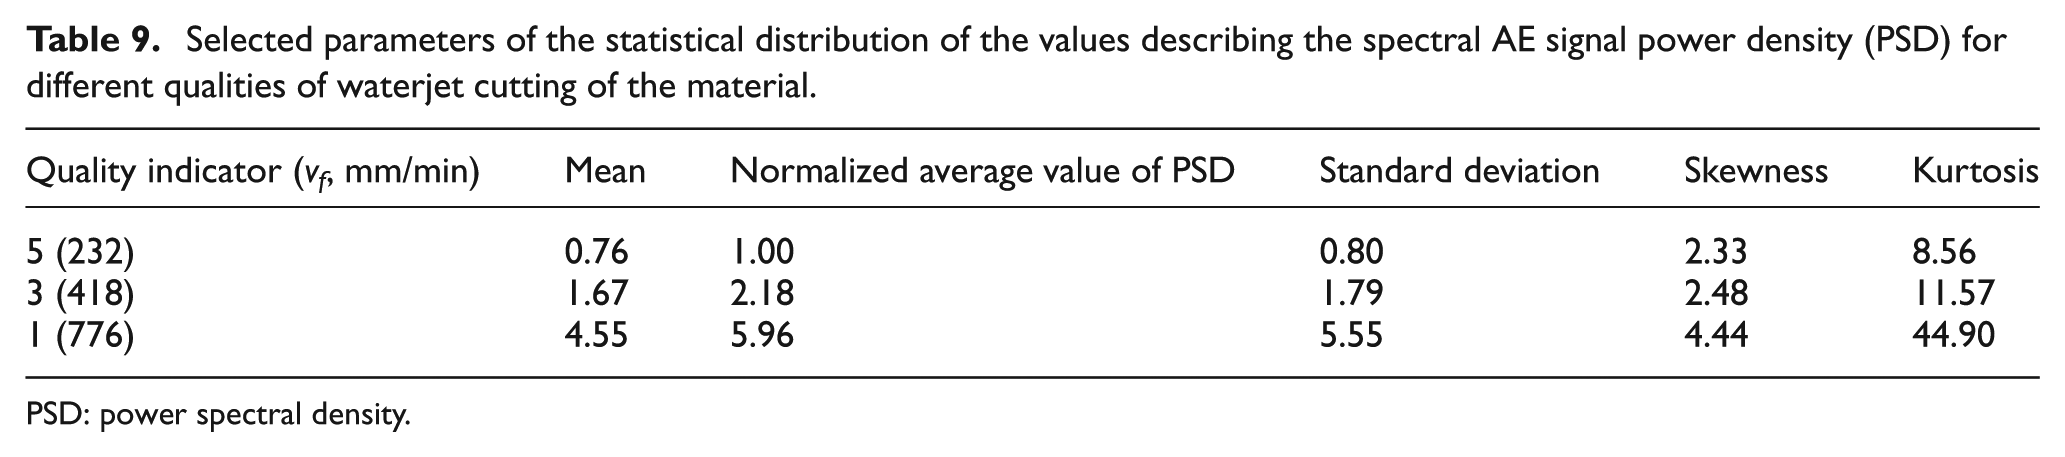
PSD: power spectral density.
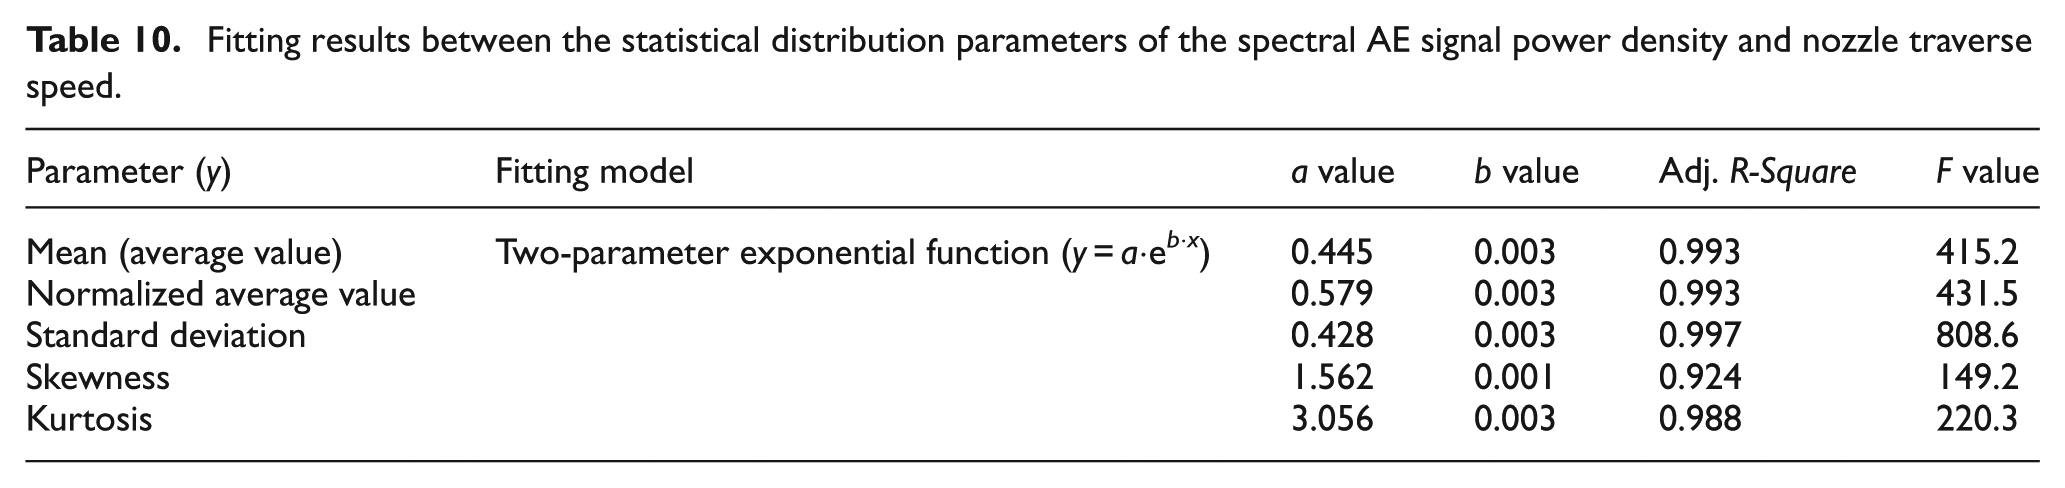
Changing the process quality indicator leads to an increase in the powers of the above-discussed signal harmonic components, also increasing the spread of these values from the mean (almost a sixfold increase in the mean value and approximately a sevenfold increase in the standard deviation are observed). The relationship between relative values observed in the PSD spectrum and traverse speed can be described by the exponential function

where
Fitting results between the statistical distribution parameters of the spectral AE signal power density and nozzle traverse speed.
Shortening of the aluminium alloy 5251 cutting time also causes a twofold increase in the skewness and a fivefold increase in the kurtosis of the distribution of the power of AE signal harmonic components. This means that a growing asymmetry in the distribution of the observed values may be interpreted as undesirable, suggesting a deterioration in the quality of the surface obtained in the cutting process. A similar conclusion may be drawn from the analysis of changes in the distribution-flattening values. In all cases, the power distribution was a leptokurtic distribution, which means that the feature’s values were more concentrated than in the case of normal distribution. This concentration increases exponentially, causing considerable increase in the descriptor’s value as the traverse speed changes.
At the significance level of α = 0.05, the hypothesis stating the lack of a relationship between the analysed values should be rejected as the values of F significantly exceed the critical value F0.05,2,2 = 19.0. The above results indicate that regression equations may be used to estimate the mean value, as well as a characteristic of the PSD distribution of an acoustic signal on the basis of the known value of the traverse speed vf. The speed has a high impact not only on the course of the process (characteristics of the acquired AE signal) but also on the results of the cutting process. In Table 11, exemplary statistical models showing the relationship between the traverse speed vf and the surface texture, described by the selected flatness, roughness and waviness parameters, are given.
Fitting results between selected surface texture parameters and nozzle traverse speed (vf).
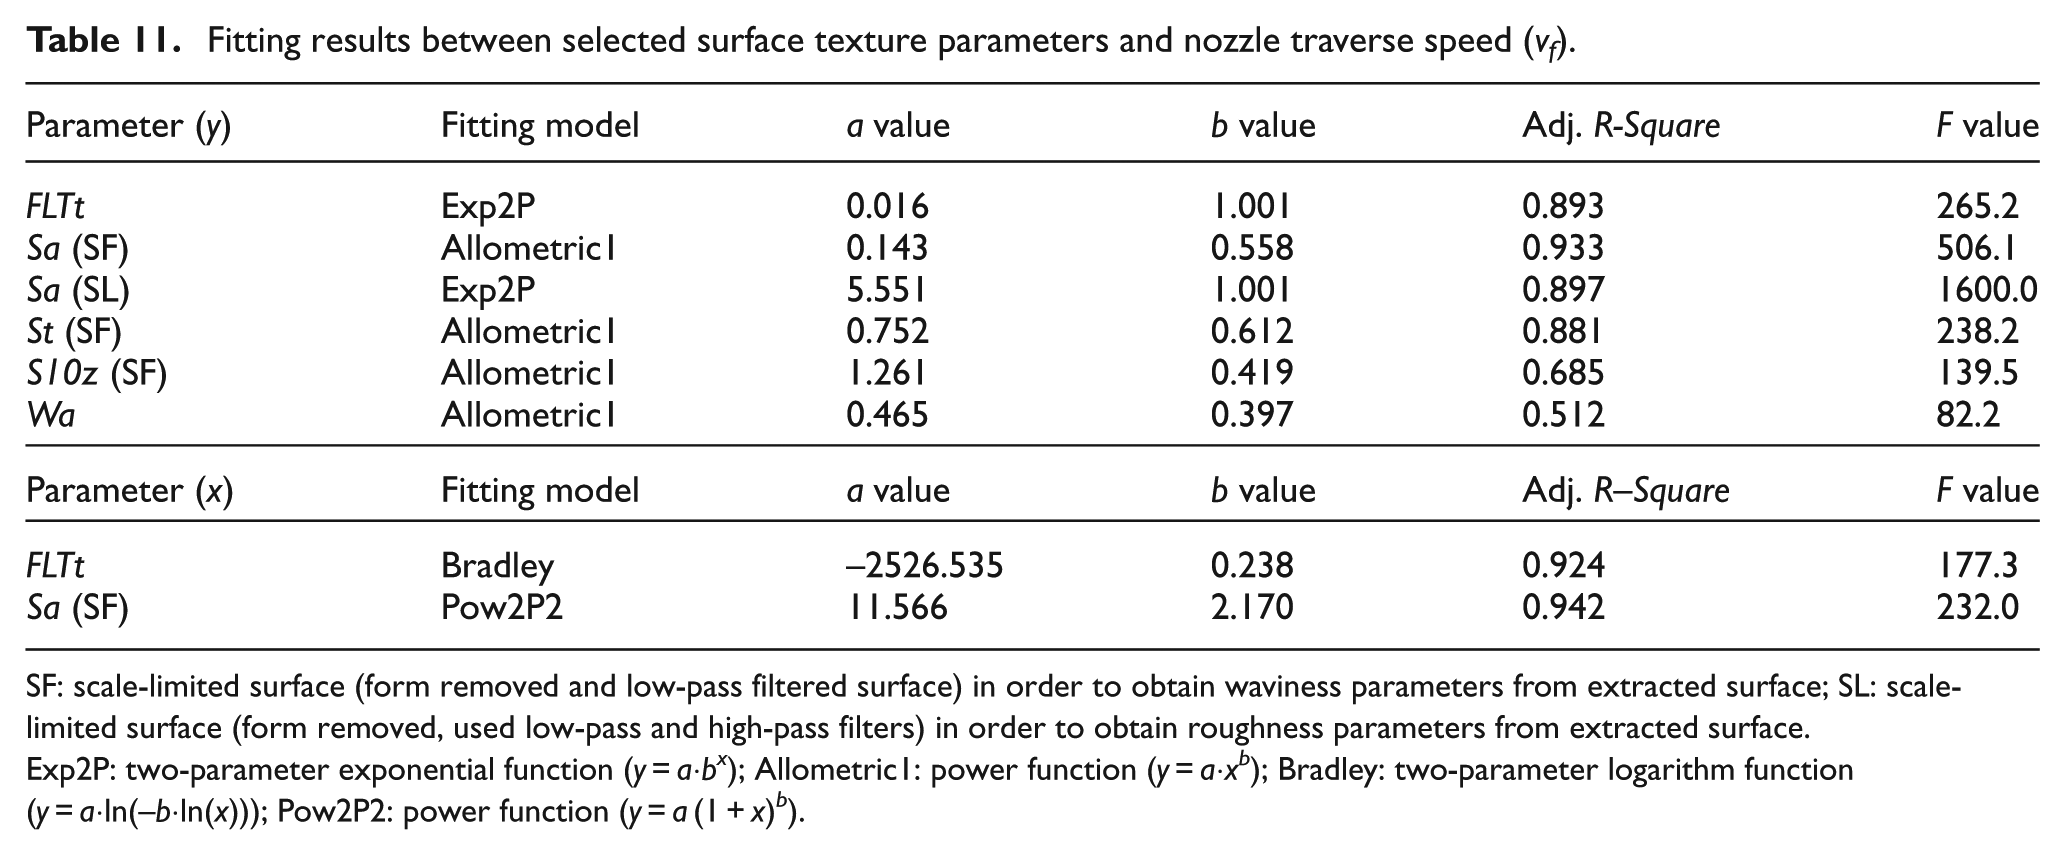
SF: scale-limited surface (form removed and low-pass filtered surface) in order to obtain waviness parameters from extracted surface; SL: scale-limited surface (form removed, used low-pass and high-pass filters) in order to obtain roughness parameters from extracted surface.
Exp2P: two-parameter exponential function (y = a·bx); Allometric1: power function (y = a·xb); Bradley: two-parameter logarithm function (y = a·ln(−b·ln(x))); Pow2P2: power function (y = a (1 + x) b ).
From the various tested two-parametric models, the exponential, logarithmic and power functions were included. The best fit of the model to the empirical data was obtained for the power function – for the model representing the changes of the Sa parameter regarding components representing waviness (SF filter). The fit of the model to the data expressed as the coefficient of determination was at a level of 0.933, whereas for the exponential function describing the changes in FLTt parameter, the coefficient of determination was 0.893.
Determination of the inverse mathematical relationships allowed one to establish prediction models of traverse speed according to waviness. These models were described by both the Bradley function (FLTt parameter) and the power function (Sa parameter). Both models were characterized by high compatibility with the empirical data. The adjusted values of the determination index were 0.924 and 0.942, respectively.
For monitoring the cutting process by the use of an AE signal, prediction of flatness models (FLTt parameter) and waviness (Sa parameter) of the machined surface were developed based on descriptors of the PSD signal (Table 12).
Surface quality two-parameter models based on FLTt and Sa geometry parameters and standard deviation of AE signal power density.
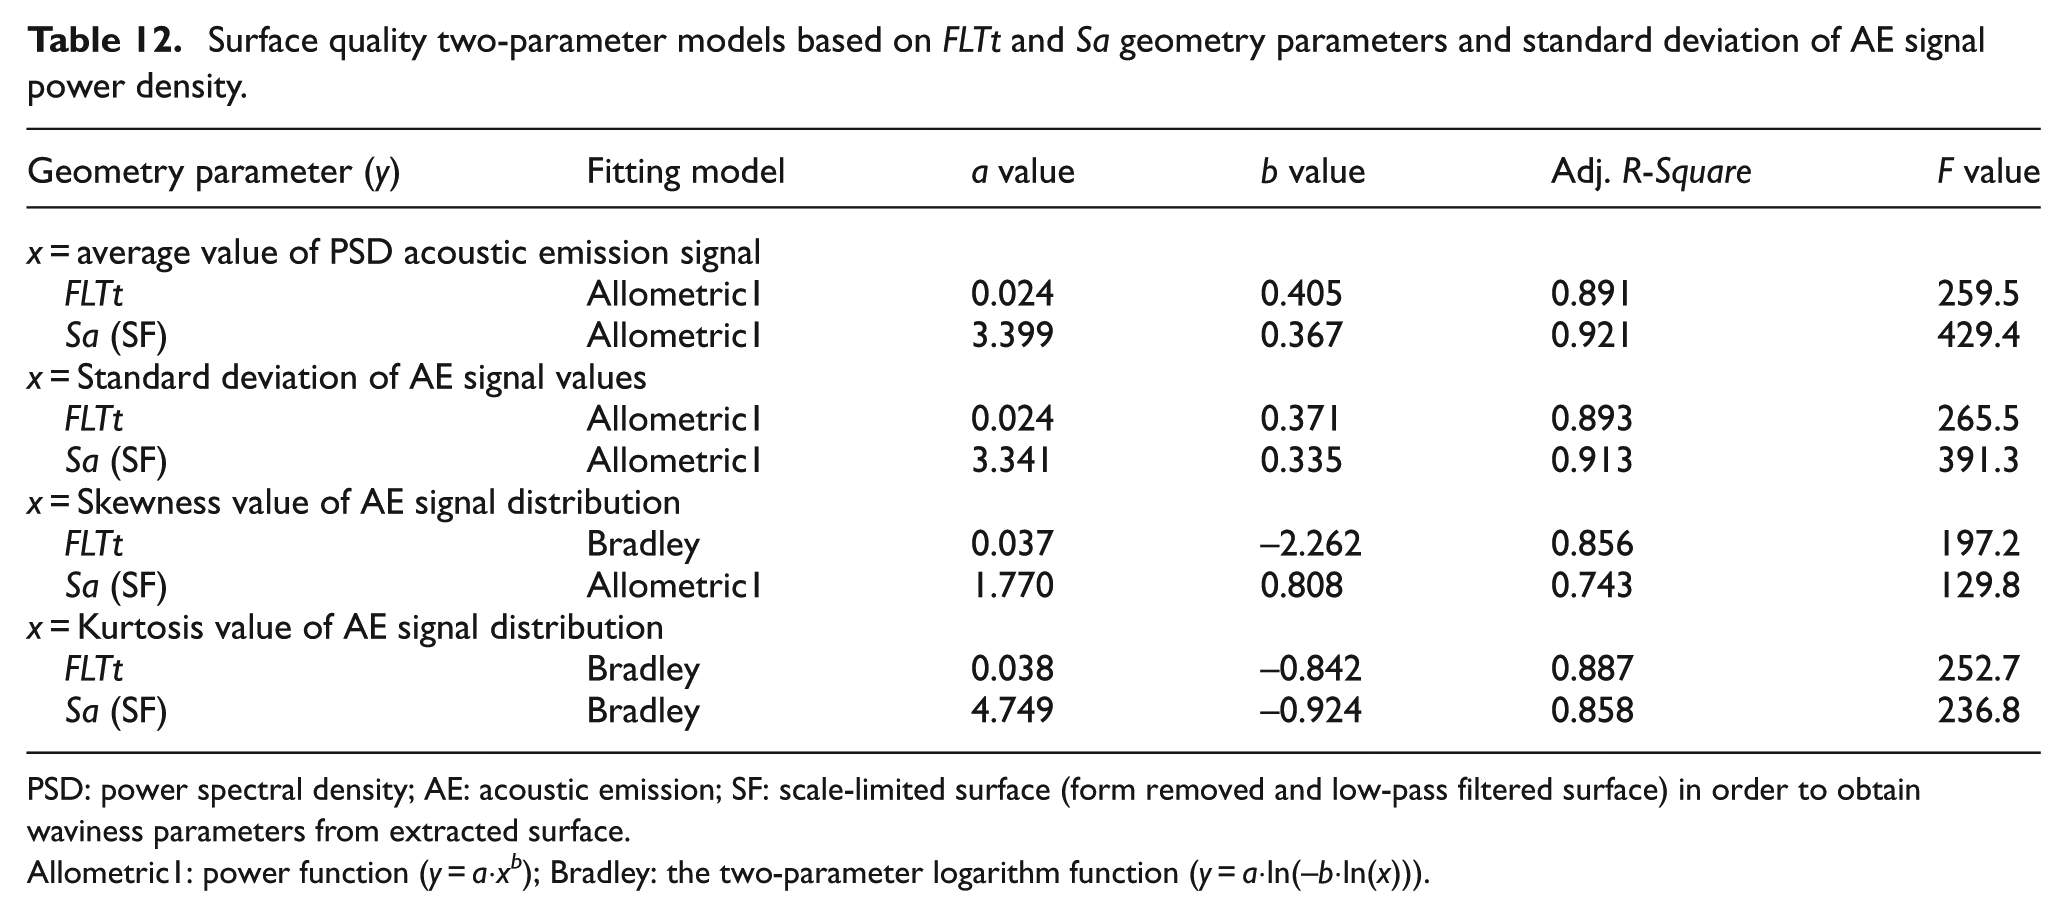
PSD: power spectral density; AE: acoustic emission; SF: scale-limited surface (form removed and low-pass filtered surface) in order to obtain waviness parameters from extracted surface.
Allometric1: power function (y = a·xb); Bradley: the two-parameter logarithm function (y = a·ln(−b·ln(x))).
Finally, the quality of the machined surface can be evaluated by expert system with the use of the following equations


and determine approximate value of the traverse speed on the basis of below model
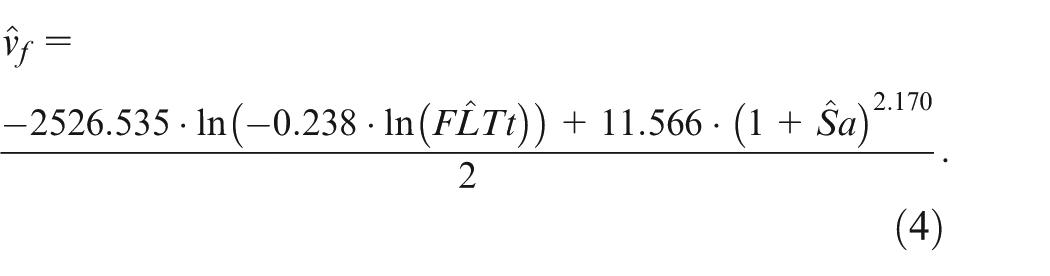
The implementation of models from Table 11 allows one to specify the expected surface quality (described by the parameters of waviness and flatness) in the control software unit and before process is started. If the AE sensor and analysis of the signal could be integrated with the machine control panel, similarly to the Tool Monitor (Nordmann GmbH & Co., Hürth, Germany), the operator would receive a solution in order to find out information about expected quality and the suggested nozzle traverse speed from the control unit. On the basis of formulas (2)–(4), the operator will gain a simple expert system which will inform them (after a complicated evaluation of data) that the machine is cutting with higher or lower quality results than they expected.
Conclusion
The obtained results of the experimental studies on use of the analysis of high-frequency AE signals in assessing the quality of aluminium alloy 5251 surfaces after the AWJ cutting process point to the existence of the influence of the machining conditions on the surface texture and values of the selected descriptors of the emitted signal. In both cases, the relationships are unambiguous.
Deterioration of the quality of surfaces cut with a waterjet contributes to increasing values of the above-mentioned statistical distribution parameter that describe the spectral density of the AE signal. This relationship may be successfully used, at least in selected conditions, for the more precise prediction of the surface texture parameter values, than in situations when such information is unavailable.
Determining the statistical models between the quality indicator of the given process and parameters of AE signal in the field of frequency has been the first step to project expert system oriented to predict the surface texture of the obtained cuts on the basis of the AE signal emitted during machining. Authors propose to develop experiments and build prototype of working system. The machining tool operator will gain an expert system that informs them of an unexpected machining result. In a broader perspective, the suggested monitoring method offers one the chance to steer the waterjet cutting process in order to provide the required quality of the cut surface.
Footnotes
Appendix 1
Declaration of conflicting interests
The author(s) declared no potential conflicts of interest with respect to the research, authorship and/or publication of this article.
Funding
The author(s) received no financial support for the research, authorship and/or publication of this article.