
Abstract
Traffic information is rather helpful to travelers in the non-recurrent traffic incident such as emergency evacuation. Unfortunately, the most concerned information—intersection traffic signal—cannot be directly shown on the medium, for example, variable message sign, because of its large size and incomprehensible content. Thus, this article mines the signal data as well as queue length to generate a well-understood content named probabilistic route delay. In addition, this article combines both route delays and real-time travel time to obtain minimal dynamic route cost. These delays and costs are components of dynamic probabilistic route cost for information provision. Based on the conveyed dynamic probabilistic route cost information, a revised logit model is used to depict evacuees’ stochastic route-choice behavior, wherein a risk-based prospect value instead of the expected value is found to be a better choice in the non-random fixed utility. This risk-based stochastic evacuation routing strategy can generate more actual flow if it is compared to single prospect-value-based risky strategy or expected-value-based stochastic strategy. A case study on the evacuation of Nanjing Olympic Center is used to apply the risk-based stochastic evacuation routing strategy. A major contribution lies in that the proposed dynamic probabilistic route cost information and the risk-based stochastic evacuation routing strategy are effectively integrated. This integration can be used to determine variable message sign information or optimize signal timings, which would serve for the most efficient evacuation.
Introduction
Natural disasters and man-made emergency events have brought large loss to the world. It had been estimated that the direct economic loss caused by natural disaster has amounted to approximately US$2.5 trillion during the years of 2000–2012 (see the literature). 1 It is believed by traffic managers that improving evacuation efficiency of traffic network is a way to reduce the loss in emergency events. Therefore, the transportation agencies tried various measures such as signal control,2,3 scheduled evacuation,4–6 routing plan,7–9 contraflow lane reversal,10,11 and intersection crossing elimination12,13 to speed up the clearance of network traffic surrounding emergency sites in the past years. The majority of these studies assume that the route-choice behavior is already known. However, during evacuation, travelers have no empirical travel time experience to help choose routes, because the demand is totally different. Traffic information service, such as variable message signs (VMSs), should be used to provide real-time routing information to evacuees before departure. The information on the panels has a potential role in managing the variable demand to match the capacity available so that the evacuation networks have a satisfactory performance.
There are several options with respect to the information that could be displayed, for example, traffic bottleneck, traffic accident, queue situation, travel time, and delay time. Because the size-restricted panel cannot cover all information, one or two elements should be adequate. Wardman et al. 14 stated that people prefer digital information to simple event descriptions. Seeing from the existing researches such as Lam and Chan, 15 Peeta and Ramos, 16 and Basu and Maitra, 17 the most complete digital information would consist of route-related travel time factors. However, the compositions of the generally selected information, average route travel time, are indistinct in the mind of evacuees. It is necessary to publish the composition most concerned by evacuees. In fact, the most time-consuming portion during evacuation is the signal intersection travel time (several articles have affirmed that it occupies great proportion in total travel time, such as Zhu et al. 18 ) along a route. It is more craved by evacuees, because waiting at the red light could make drivers nervous in evacuation. Hence, if traffic signals at intersections have been known by evacuees before departure, they would more likely feel relieved. However, the traffic signal parameters cannot be shown directly because of the large size and incomprehensible content. Thus, it is essential to transform the signal parameters into other readable information to guide evacuees.
An adoptable method to represent the signal parameters is using probabilistic delay. Yang and Miller-Hooks 19 proposed an adaptive routing strategy for drivers. In their model, the duration of each actual signal phase is assumed to be a probabilistic value, and the probabilistic delay is found with respect to each arrival time at the signal intersection. For an emergency evacuation, the demand is so massive that predetermined signal timing rather than actual signal timing is more suitable. Although the duration of the signal phase is given in the predetermined signal timing, the signal delay keeps being an uncertain value due to evacuees’ stochastic arrival at each intersection. Evacuees should wait longer if there is a red light at the arrival time. Thus, it is still feasible to mine the data of stochastic arrival, signal timing, and queue length to generate information about the probabilistic delay. Furthermore, combined with real-time travel time, it may be possible to find the dynamic probabilistic route cost (DPRC) to be displayed as complete route cost information. Although other forms of stochastic cost (for instance, mean speed combined with variance in Chen et al. 20 can depict the complete route cost, its function distribution is attained by historical travel record and thus not applicable in evacuation environment. Therefore, the acquisition process of DPRC should be a focus for VMS publish in evacuation.
Even if the DPRC is published, evacuees would still be unclear about how much actual travel time they should spend because they would not always believe that the information calculated under stochastic network traffic is reliable. There are available methods to consider people’s ambiguity about the route choice which include fuzzy logic, 21 dynamic learning (the majority of these methods are based on dynamic planning theory, as stated by Nakayama et al. 22 ), stochastic utility, 23 and so on. With regard to the former two methods, a large number of empirical traffic data must be prepared in advance. The data will be used to plot the link cost membership function in the first method or to calculate some key variables, such as the state transition matrix, in the second method. Because historical data on the flow records in emergency evacuations are rare, we should better refer to the third method. The logit model is preferred to the probit model, which is more likely to be applied in the third method because its closed-form representation can save the flow-loading calculation time and because its utility parameter can easily be calibrated by the stated preference survey. To overcome the route overlapping issue caused by the simple multinomial logit model, its modified forms (such as C-logit, size-logit, cross-logit, and nest-logit) are also feasible choices.
Ambiguity may not be the sole feature to describe evacuees’ route choice in an emergency evacuation. Some literature studies show that a non-recurrent incident can incur risky decision-making in people. The following statement made by Knight 24 provides further evidence for the existence of risky decisions: when the probabilities of the options are known beforehand, most people make a risky decision. However, the non-random fixed utility in the logit model is generally expressed as an expected route cost, which means that the evacuees are very rational and risk neutral. Thus, it is necessary to seek a risk-related value to replace the expected route cost in this evacuation routing model. According to previous researches,25–33 prospect value could be a better choice.
This research focused on the creation of DPRC and the construction of the routing strategy. Based on the data of traffic signals, the real-time travel time, and queue length, it is found that the minimal dynamic route cost and a single additional probabilistic delay could be used to represent the DPRC. Under the DPRC information, the risk-based stochastic evacuation routing (RSER) strategy is used to be described as a logit model embedded with cumulative prospect theory (CPT; proposed by Tversky and Kahneman 26 ), to depict evacuees’ route-choice behavior. The contribution here is to propose DPRC information for publishing in evacuation condition. The information has two advantages: (1) it is related to traffic signal which is most concerned by evacuees and (2) it can easily be changed to a prospect value which can be used to describe evacuees’ ambiguity and risk about route choice. Note, the DPRC information here is true and not the system optimal information. Although the system optimal information could optimize the evacuation clearance time, it generally publishes limited route traffic information or false traffic information. This kind of information publishing is not quite recommended because of honesty. This article publishes the true information in terms of DPRC and analyzes its influence on users’ route-choice behavior.
The subsequent material is organized as follows. First, the process of the DPRC information creation and RSER strategy construction is elaborated. Second, a field application in the evacuation of the Nanjing Olympic Center is provided to show the application process and demonstrate the weak substitutability of the RSER strategy.
Model process
Given the evacuation network topology, two phases shown in Figure 1 are used to make up the theoretical framework of RSER strategy construction. The sequence of two phases is as follows: DPRC information creation and RSER strategy construction. It is a loop operation among the two phases with the change in discrete time steps, and the simplified probabilistic route cost and route-choice probability are updated separately per ς time interval, within the time interval set T.

Framework for the RSER strategy construction under an emergency evacuation.
The key point of the first phase is combining the current average travel time, queue length, and the known signal control parameters (signal cycle, green split, and green offset) to compute the minimal route cost and additional probabilistic delays, which are the compositions of DPRC. In other words, according to people’s varied chances of encountering red and green signals when arriving at each intersection, as well as the queue length of that moment, the additional probabilistic delays could be obtained; by adding current average travel time into consideration, the minimal route cost could be obtained. In addition, the acquired DPRC may be an integration containing various probabilistic delays; hence, it would be transformed into a simplified style (named simplified DPRC, composed of the minimal route cost and a single additional revised probabilistic delay) to facilitate display and lower the route selection difficulty. It is noted that the DPRC generated in the first phase and CPT introduced in the second phase are the necessary inputs of this conversion process.
In the second phase, two things need to be done. First, investigate route-choice result using the hypothetical case of choosing routes in an evacuation scenario and aim to conduct the consistency analysis between the respondents’ risk attitude of our questionnaire survey and the result of CPT. If they have consistent result, the recommended functions with respect to the value and weight calculations in CPT are employed to calculate prospect value based on a given DPRC. This value can gauge the non-random fixed utility in route-choice model. Second, construct a logit model to reflect people’s ambiguous recognition in the route choice. It is actually a revised model using DPRC-transformed prospect value as the key component of non-random fixed utility to reflect people’s risk attitude. Eventually, the route-choice ratios of the current simulation are attained, which is also the result of the RSER strategy in this period.
Dynamic probabilistic link cost
The dynamic probabilistic link cost is composed of the minimal link cost and a single additional probabilistic link delay. The delay is specifically caused by the intersection ahead of this link. The calculation process is introduced in the following:
1. Assumption. The majority of delays occur at intersections. The information is updated per ς time intervals. The arrival rate obeys to a uniform distribution. The intersection in the evacuation condition is busy and thus always exists queuing even at the end of green time. The average queue length of each time interval among the ς time intervals is the same. In other words, the arrival rate at the intersection in front of link i per signal cycle equals to qi.
2. Definition for two delays. Average green-meeting delay (AGD). If a driver encounters a green signal when he arrives at each intersection along a route, the driver experiences a green-wave signal control. In congested conditions, the driver must queue for several signal cycles, even if he encounters a green signal when joining the queue (or arriving at each intersection under point queue assumption). Thus, we define the gap size between the average link travel time under different green-meeting conditions (called the average green-meeting link cost) and the free-flow link travel time as the AGD at the link. Average red-meeting delay (ARD). For the situation in which a driver encounters a red signal when arriving at an intersection, we define the average delay in the approach of the intersection as the ARD at the corresponding link. However, there is an initial waiting delay (a component of the ARD) before the arrival of the next green signal. Therefore, regarding the signal cycle at an intersection, which begins with green and terminates with red, its ARD must be larger than its AGD under the assumption that the arrival rate during the signal cycle is uniformly distributed (a condition most likely to occur in a congested environment).
3. Computation steps.
Before the deduction, we acquire an interim variable, the current average link travel time, as preparedness. One thing to note is that the traffic flow does not always come from the simulation but sometimes depends on the real-time detected data. Thus, much work should be done to obtain the current average travel time if it is not a simulation condition. In fact, we can use automatic vehicle identification detectors such as Bluetooth and GPS devices to obtain the average short-term travel time as the current average travel time.
Take time interval τ as the current time point for the study. Generally, we assign

Composition of link cost and corresponding computation steps.
4. Deduction of delay-discrimination value.
The link delay is related to both queue length and signal timings, thus take them into the calculation of delay-discrimination values, ARD − AGD and MD − AGD. The cumulative curve of arrival vehicle is shown in Figure 3. A signal cycle is composed of a green time and a red time; the x-coordinate shows the time sequence expressed as the changing of green light and red light; the y-coordinate shows cumulative vehicles. Evacuees arrive at a congested intersection at varied time points, and the corresponding waiting delay of each arrival time is approximately graphed as the horizontal line between arrival and departure curves. Assume the initial queue length is


Stochastic delays according to the arrival time at the intersection in front of link i.
The
A uniform distribution of the arrival rate can guarantee that the red-meeting and green-meeting probabilities equal to 1 − λi. and λi, respectively. Therefore, we can construct the following expectation conservation of the current average link travel time, which is also the function relation between the AGD and MD

After transposition, we can directly obtain the delay-discrimination MD − AGD

If ARD − AGD equals to
5. Minimal link cost and additional probabilistic link delay.
According to the previous definition, the average green-meeting link travel time,

The additional probabilistic link delay is composed of two parts. The first part occurs in the green-meeting conditions, where its value is 0 and probability is λi. The second part occurs in the red-meeting conditions, where it will produce a single additional link delay,
Generation mechanism of DPRC
The following is the process to obtain the minimal route cost and a single additional probabilistic delay for the entire intersection group along a route.
Minimal route cost and additional probabilistic route delays
Once the minimal link cost is obtained, we can sum them up along a route, r, as the minimal route cost,

If the delay scenario of each intersection is designed, the various total delays and probabilities along the route can be obtained. The additional route delay,

where

To make the formulae of the additional route delay (6) and occurrence probability (7) easier to understand, the following special example is shown. If a route is composed of n signal intersections with the classic two-phase signal timing and their signal parameters are the same, the formulae of the additional route delay and probability in terms of the red-meeting number can easily be shown in Figure 4. This representation is identical to the scenario description of formulae (6) and (7), although their specific forms are different.
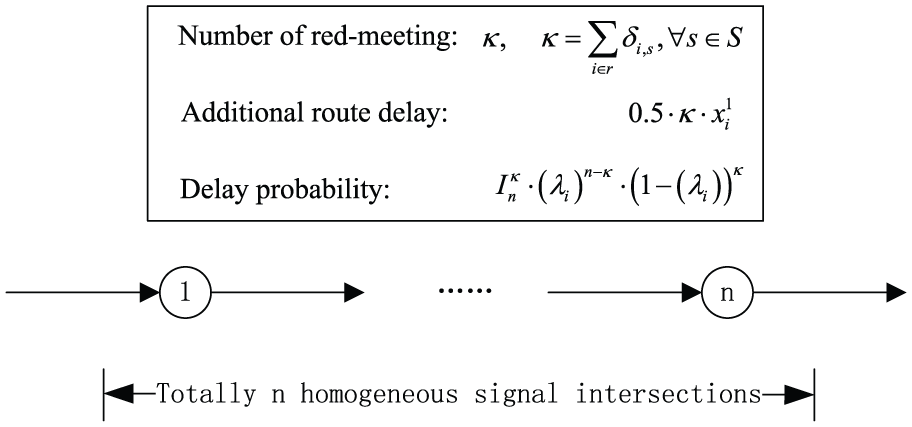
Additional route delay and its probability in a special case.
Representation of standard DPRC
We let the route cost,

The combination of all these scenario probabilities and corresponding route costs is the standard DPRC.
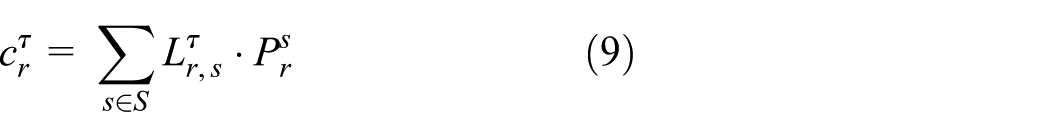
The expected cost of route r according to the expected utility theory can be expressed as formula (9). This value is also equal to
Simplified DPRC
The number of feasible options in the VMS board is required to be few. Otherwise, drivers will be confused. Therefore, before publishing, a concise interface where each route has only a minimal route cost plus a single additional probabilistic delay for evacuees to choose a route is created. This identical delay value is solved by establishing the equation for prospects transforming from standard DPRC and the simplified DPRC separately. Before that, evacuees’ risky choice behavior by CPT is proved by questionnaires in Appendix 2. CPT is used to achieve the simplified DPRC in this study. The following case is provided to show the acquisition of a simplified DPRC. For instance, two probabilistic delays in route 1 of question 3 in Appendix 2 should be transformed. Let the total delay probability, 70%, be unchanged and update the delay with 45, which is calculated by the CPT formulae. The eventually simplified display of the probabilistic route cost in question 3 can be shown as follows.
Route 1: minimal cost (180 s) + additional probabilistic delay (45 s, 70%);
Route 2: minimal cost (180 s) + additional probabilistic delay (30 s, 90%).
Revised logit model for RSER strategy
Although CPT can achieve a more reliable utility than that from the expected utility theory, it cannot be applied solely in the evacuation routing strategy because a definite choosing result (0 or 1) is made in this situation. However, even in the surveys, each route in the same question can be chosen by many people. It indicates that the routing decision under uncertainty is also stochastic. Under extreme condition such as evacuation, there exist some factors leading to people’s stochastic decision-making. For instance, published information may be unreliable due to the rough calculation process; unexpected traffic incidents may influence the current traffic condition. If the widely used logit model is chosen to describe this ambiguity feature, the random utility would be an independent Gumbel random variable. Then the eventual probability of people choosing route r can be expressed as follows, which is also the construction of the RSER strategy. This logit model has embedded the prospect value, which could consider not only risk attitude but also ambiguity feature

The above route-choice ratios are also the result of the RSER strategy in this period, where ω is the set of routes of the origin-destination (OD) pair and θ is the scale coefficient. According to Train,
34
the scale coefficient is influenced by the variance of Gumbel-distributed random term. If the variance is
Some literature studies state other non-linear utility forms, such as the square and cube of the expected value, which may consider risk attitude. For example, the composite path disutility proposed in Watling 35 is a type of risk-based utility. However, embedded CPT is more accurate with respect to risk consideration. For instance, if the expected values are equal, the model here can obtain a more reasonable biased result, whereas other forms can only obtain the half and half choice result. Furthermore, the weak substitutability of our model is analyzed in the case study.
Application in stadium evacuation
Here, construct a logit model to reflect people’s ambiguous recognition in the route choice. It is actually a revised model using DPRC-transformed prospect value as the key component of non-random fixed utility to reflect people’s risk attitude. To show the computation process of RSER strategy and the weak substitutability of this model, the evacuation route choice of Nanjing Olympic Center (Figure 5(a)) in China is the application issue, where the traffic loading process relies on software VISSIM4.3. This application is mainly used to compare the route flow ratios between RSER strategy and other non-linear routing strategies.

Evacuation network in Nanjing Olympic Center: (a) road reconfiguration and (b) traffic simulation.
Experimental background
The Nanjing Olympic Center (Figure 5(a)) in China, with a capacity of 87,000 people, is assumed to be under the threat of a terrorist incident. Spectators should be evacuated as soon as possible. The analysts reconfigure the road direction and traffic signal in the surrounding network to restrict the traffic inflow. In other words, the roads within the network constitute a closed area that allows only a northeast bound flow. The Jiangdong Road (south-to-north direction) paralleling the subway line (red mark) and the Mengdu Street (west-to-east direction) are the corridors for vehicle evacuation. Majority of the vehicles depart at the north exit of the stadium. This case investigates which of the blue lines (Jiangdong Road or Mengdu Street) would they choose after the release of DPRC information.
Destination setting. If the vehicles get out of the South River (in the right side of Figure 5 (a)) or the interchange of the Yingtian Street, we deem they are safe. Hence, these two points are set as destinations.
Road reconfiguration. The vehicles departing from other exits may use green lines (Yuean Street, Xinglong Street, Jiangdong Road, Lushan Road, and Huangshan Road) to converge into the corridors. The utilization of other branch roads is forbidden. Therefore, whatever the route is chosen by the drivers of north exit, only two signal intersections are left for them to pass when being at the intersection of two corridors.
Other inputs. To match the initial road network, the simulation interface of VISSIM4.3 is shown in Figure 5(b). Other input data, such as the distances from the decision point to two destinations, lane number of all the roads, intersection signal parameters, simulation time, time-varying evacuation demands, are shown in Tables 1 and 2.
Data provision of evacuation network.

Time-varying evacuation demands at each exit (/veh).

To guarantee the equity when comparing varied strategies, the diverging flow ratios at west approach of intersection #1 are set as 1:1 at the initial three time intervals. Aside from these three time intervals, routing strategy should be implemented to determine the diverging flow ratios in the remaining six time intervals.
Calculation of DPRC
Minimal route cost
The delay-discrimination value of MD − AGD,
Time-varying route costs and prospects in Mengdu Street and Jiangdong Road (/s).

Additional probabilistic route delay
The additional route delays of the scenarios listed among the second lines of columns 2–5 of Table 3 are calculated by formula (6), which are 36 (48), 18 (24), 18 (24), and 0 (0) (s), respectively. Their occurrence probabilities are 0.09 (0.16), 0.21 (0.24), 0.21 (0.24), and 0.49 (0.36), respectively, according to formula (7).
Standard DPRC
Combining the minimal route cost and additional probabilistic route delay, we can attain route costs of different scenarios shown in columns 2–5 of Table 3. These route costs and the corresponding occurrence probabilities compose of standard DPRC.
Simplified DPRC
Based on the standard DPRC, the prospect values of Jiangdong Road and Mengdu Street at different time intervals can be attained using formula (22). These prospect values are shown in the last column of Table 3, which would be used to deduce the simplified DPRC.
The simplified DPRC is composed of minimal route cost and a single additional probabilistic delay; its simple form facilitates the information release. The sole additional probabilistic delay is composed of two terms as follows.
Probability of additional delay. This sole probability is specified to be the summation of the probabilities in all the delay scenarios except for the green-meeting conditions in both signal intersections. These probabilities are 0.51 and 0.64 in Mengdu Street and Jiangdong Road, respectively.
Additional delay value. Constructing the equation between previous prospect and transformed prospect by CPT, we can solve the sole additional delay value. These values in Mengdu Street and Jiangdong Road are almost unchanged with time and approximately equal to 90 and 75 s, respectively.
Comparison of non-linear routing strategies
Route-choice ratio
The prospects in Table 3 can influence the route-choice ratios by the revised logit model in formula (10), and the ratios of choosing Mengdu Street in the six time intervals are 0.27, 0.23, 0.14, 0.11, 0.15, and 0.1, respectively, which can be shown in Figure 6(a). We wonder whether the route-choice ratios of other non-linear routing strategies be the same as the results of RSER strategy. If the non-linear form is used to replace our prospect in the non-random fixed utility, it can be expressed as the weighted summation of expected travel time and its variance. The weight rate of these two components is 0.2:0.8, and the standard deviation is expressed as a deviation coefficient θ0 multiplying expectation. We investigate the route-choice ratios under the conditions of θ0 = 0.01, 0.03, and 0.05. Their vertical trim bars are attained as shown in Figure 6(b)–(d). Compared to the result of our strategy, they showed different ratios. Even though the route-choice ratios in some time intervals are equal to that of our strategy (e.g. Figure 6(d)), the ratios in other time intervals are still different. It indicates that the general non-linear routing strategies differ from RSER model with respect to the perception of probabilistic loss, although these strategies can reflect some levels of non-rationality in people’s mind. Hence, the weak substitutability exists between RSER strategy and other non-linear strategies, even though some relative coefficients change. In addition, the route-choice ratios change a lot at different time intervals when using our strategy. This feature differs from that of other non-linear strategies whose routing results almost cannot reflect the dynamic influence of congestion information on evacuees.

Route-choice ratio comparison between RSER and other non-linear strategies: (a) route-choice ratio under RSER strategy, (b) route-choice ratio under non-linear strategy (θ0 = 0.01), (c) route-choice ratio under non-linear strategy (θ0 = 0.03), and (d) route-choice ratio under non-linear strategy (θ0 = 0.05).
System performance
The aforementioned non-linear value is inputted as the component of non-random fixed utility of the logit model to compare the total travel time and delay with that of our model. The total demand in this test is changed in the range of 10,000–20,000 vehicles, where each changing gap is 500 vehicles and the assignment ratios of the demand in terms of different time intervals and exits are the same as the previous setting.
As seen from the system performance comparison between our strategy and other strategies in Figure 7 (DC means deviation coefficient θ0 and the red line describes the changing range of the performance index), there is no sign showing the similarity between these corresponding results and that of our model. Therefore, it indicates that differentiation would not disappear, even though the number of samples grows, and it furthermore demonstrates that the RSER strategy cannot be easily replaced by other non-linear logit models. Eventually, it reveals that the RSER strategy can be not only significant but also identical in the future application.
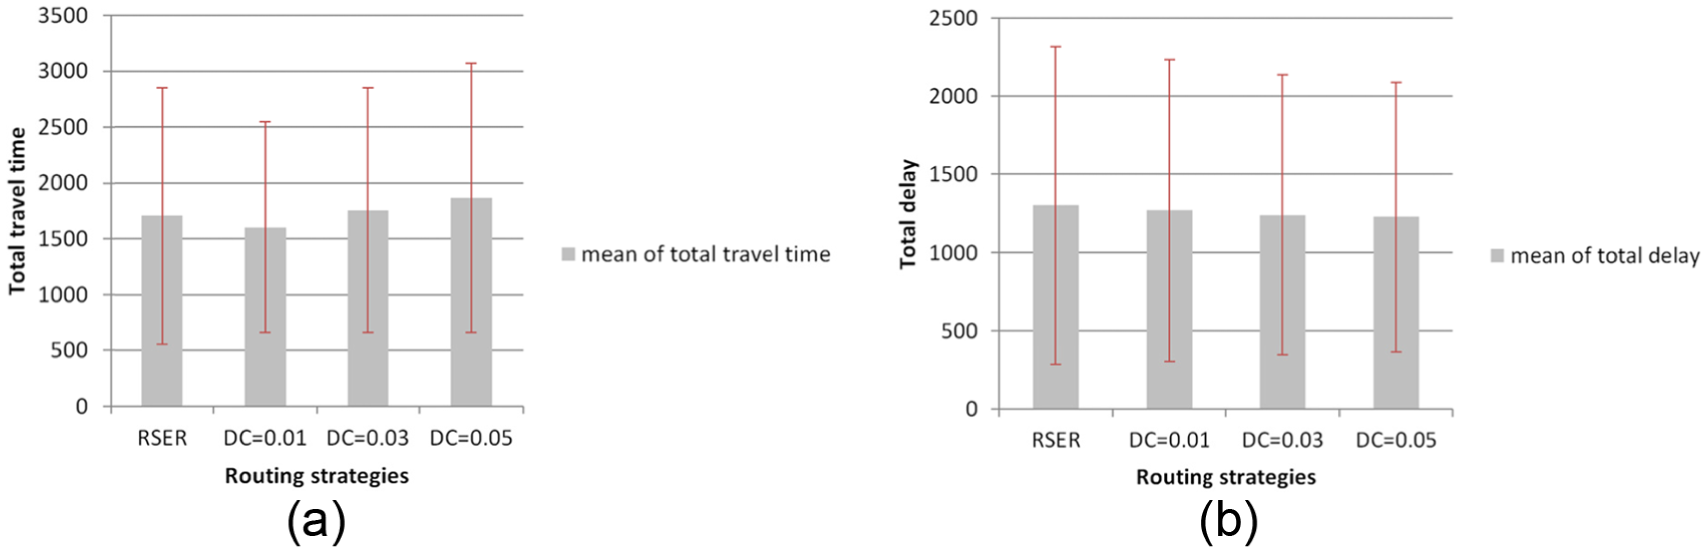
System performance comparison of RSER and other non-linear strategies: (a) total travel time comparison (s) and (b) total delay comparison (s).
Conclusion and future work
To serve strategies and on-line management for evacuation traffic, DPRC is proposed to be shown as VMS information to guide evacuees. Specifically, the most focused delay-related traffic signal parameters are used to be mined to form the DPRC. According to the DPRC information, the method about how to obtain RSER strategy is described. In this work, the presentation of DPRC is an innovative step. This DPRC contributes to convenient expression of VMS information as well as easy generation of prospect value. Therefore, the deduction of DPRC is the focused work: link case is tried first and then the route case. Overall, our work is helpful in the VMS information determination or signal timing optimization in evacuation.
The application of stadium evacuation is provided, where the RSER strategy is calculated and the comparison with other non-linear routing strategies is conducted. Actually, both these two strategies could describe evacuees’ ambiguity and risky features about route choice. By both route-choice ratio and system performance comparisons, it demonstrates that the RSER strategy cannot be easily replaced by other non-linear logit models. Eventually, it reveals that the RSER strategy can be not only significant but also identical in the future application.
There are several near-future works:
The vehicle arrival rate is assumed to be uniformly distributed in this study, and then the delay-discrimination is deduced. If the arrival rate obeys to Gamma or negative exponential distribution, the result should be different. This work is significant in the future research.
The parameters inside the prospect value are borrowed directly from the classic studies, which do not influence the test in this study. In future real-world application, the parameters ought to be attained by the combination of large-scale investigation and regression fitting.
We update the information once per fixed time span. Determining the best information-updating frequency for the application of RSER strategy is also the near-future expanded study.
Footnotes
Appendix 1
Appendix 2
Acknowledgements
The authors appreciate those students from the Southeast University in Nanjing, P. R. China, who participated in data collection and processing.
Academic Editor: Teen-Hang Meen
Declaration of conflicting interests
The author(s) declared no potential conflicts of interest with respect to the research, authorship, and/or publication of this article.
Funding
The author(s) disclosed receipt of the following financial support for the research, authorship, and/or publication of this article: This research was supported by the National Natural Science Foundation of China (nos 51408321, 51578149 and 51408190), and Zhejiang Social Science Planning Program (no. 16NDJC015Z), and Zhejiang Provincial Natural Science Foundation (no. Y15E080035), and Ningbo Natural Science Foundation (no. 2015A610162), and K.C. Wong Magna Fund in Ningbo University.