
Abstract
A micromechanical model was established based on the fluid dynamics theory. This model could be used to calculate several kinds of data when the asphalt pavement under the influence of traffic loading is in water-saturated condition. The results showed that the maximum pressure inside the effective pore was located at the junction between exit slits and the pore wall. There was a positive correlation between the pressure and the vehicle speed. Therefore, the repeated traffic loading could cause emulsification, shift and even peeling of the asphalt membrane. Moreover, the bigger size of the exit slit is, the higher velocity of the fluid has. The high velocity flow keeps scouring both the exit slit and the lower boundary of pore wall. It will cause a bigger slit. Pressure distribution inside the effective pore is related to the number of the exit slit which connect with the pore. More exit slits means bigger pressure inside the effective pore. In addition, if asphalt membranes at exit slits have micro-cracking, the cumulative damage could appear easily and asphalt membranes could be peeled easily. Finally, a test was conducted so as to obtain the bonding strength and adhesion strength between asphalt and aggregate. Then, we can get accurate damage form and position during the scour process by comparing the numerical simulation results with experiment results.
Keywords
Introduction
Moisture damage is a complex process that is influenced by material factors, their combinations, construction and external effects such as environment and loading. 1 Pore water is an important factor for the cause of moisture damage. Continuous traffic loading causes high velocity flow of pore water. Pump suction phenomenon caused by high flowing velocity of pore water leads to moisture damages directly. Meanwhile, continuance action of moisture induced weakening of material and traffic load induced mechanical damage which will cause progressive dislodgement of the aggregates. In some cases, this damage pattern becomes a dominant mode of failure and a cause for diminished road safety. Therefore, it has great significance to research moisture damage of asphalt pavement.
Over the years, many elaborate studies have been performed to study this topic.2–8 Specifically, academician Sha 9 systematically studied the reasons of the early stage moisture damages in asphalt pavement and proposed the corresponding solution. Some research had calculated and analysed moisture damage problems of asphalt pavement by creating numerical simulation model. Kringos et al. 6 have developed an analysis model to approximate the physical and mechanical aspects of moisture damage to asphalt materials. The finite element tool RoAM is a sub-system of the CAPA-3D developed by Scarpas. 10 Luo 11 had used axis symmetry finite element method to analyse the changing pattern of pore water pressure in asphalt concrete pavement layers under different loading conditions. Considering the asphalt pavement’s pore water saturation condition, Zhou 12 had calculated the space and time distribution of pore fluid pressure in asphalt pavement using temperature-dependent viscoelastic theory and Biot dynamic consolidation theory.
The former finite element calculation mostly assumed asphalt pavement as porous media, and the macro-model of the asphalt pavement was calculated based on Biot dynamic consolidation theory. Therefore, the results of the calculation could not indicate the fluid stress condition inside the pore of asphalt pavement and specific damage positions of the surrounding mixture. Distinguished with the macro-model of asphalt pavement in previous researches, the micromechanical model of asphalt pavement effective pores was established in this article. Based on the computational fluid dynamics (CFD) theory, this model could be used to explore the damage rules of asphalt pavement structure by calculating and analysing flowing fluid pressure of asphalt pavement under condition of both water-saturated state and the traffic loading. Meanwhile, a test was conducted so as to obtain the bonding strength and adhesion strength between asphalt and aggregate. Then, accurate damage form and position can be deduced during the scour process by comparing the numerical simulation results with experiment results.
Calculation model
The macro-model of asphalt pavement which was used in most of the current researches was established based on porous media theory. In the macro-model, traffic loading was exerted on the pavement. Stress in different layers of the pavement was calculated. However, few people studied the flow condition of fluid and damage of asphalt membrance in a single pore under traffic loading from microscopic viewpoint. Hence, it has great meaning to research the flowing status of pore water in asphalt pavement under the traffic loading.
Analysis of pavement void
A calculation model of internal pore in asphalt pavement was established based on the asphalt pavement observation and the analysis of computed tomography (CT) scan images of asphalt mixture specimens. According to the standard Marshall Test of asphalt mixture, three Marshall specimens were made. Their porosity is between 3% and 6%. These specimens were scanned by CT equipment. The photos of specimen’s surface and bottom were taken. The specimen’s internal photos were taken every 10 mm from their surfaces. Each specimen was taken 8 photos, and totally 24 pictures were taken. Two images of them are shown in Figure 1.

Two CT images of specimen: (a) image 1 and (b) image 2.
The CT photos show that the distributions of effective pores inside each specimen are not uniform. The Image-pro Plus 6.0 software is used to deal with CT images. The method of threshold segmentation is employed to extract the quantity of different size effective pores in CT image. Then, we obtain that the effective pores have various shapes such as triangle, elongate, circular, polygonal and so on. The width of most pores is from 1 to 3 mm. The number of effective pores which has 3–5 mm width is apparently less than the number of effective pores which has 1–3 mm width. Meanwhile, a few pore widths are bigger than 10 mm.
Establishment of the standard model
In order to simplify the calculation, we assume that the pavement has an effective pore under 1 cm depth with the diameter of 10 mm. Considering the variety of pore shape by the CT images, different trial models were established respectively. The size of pore for different shapes is all set to nearly 10 mm. Because the majority of effective pores are between 1 and 3 mm, we apply a slit connected with the pore instead of these numerous small effective pores. Then, standard model can be determined after calculation. In the end, some rules can be summarised by calculation of different conditions.
Each pore has three slits. The vertical slit is the water entrance. The dynamic water pressure caused by wheel loading is applied on it. The horizontal slit on the left is closed, and the right horizontal slit is free exit. The diagrams of specific models are shown in Figure 2.
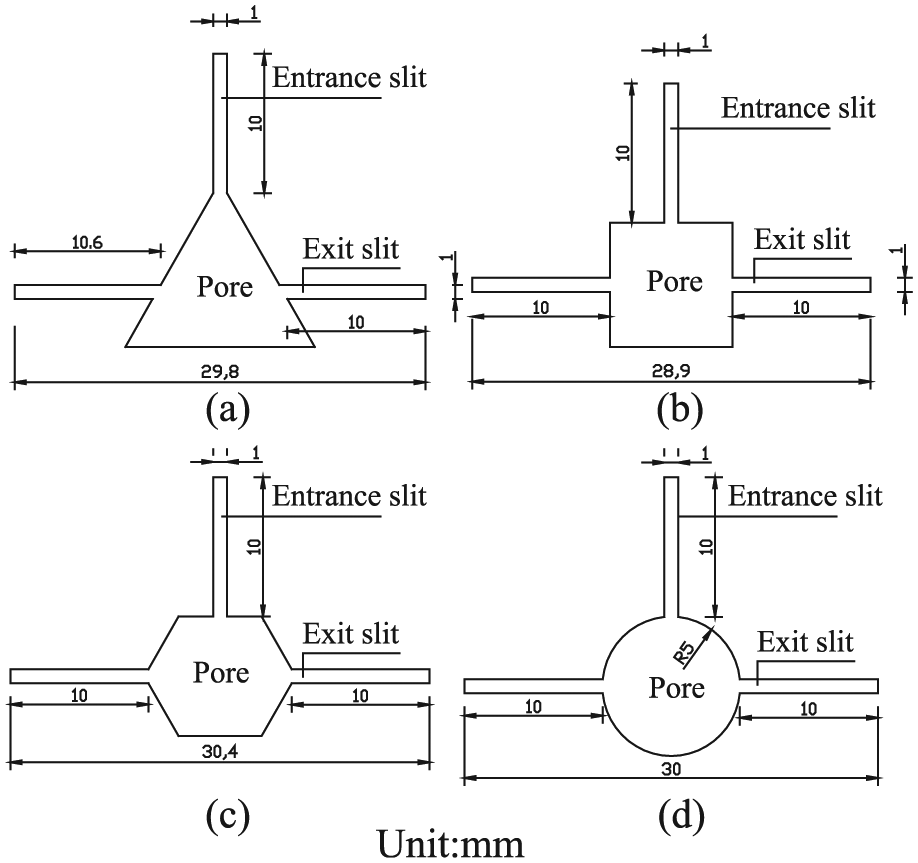
The size of four models: (a) triangle model, (b) quadrilateral model, (c) hexagon model and (d) circular model.
The density of pore water in the model is 1000 kg/m3. The dynamic viscosity at 20°C was chosen as the viscosity which is 1.003 × 10³ Pa S. The initial pressure at the entrance slit is set to 0.7 MPa of all models in Figure 2. After the calculations, the distribution diagrams of internal pore pressure of four kinds of models are shown in Figure 3.

The pressure distribution figure of four models: (a) triangle model, (b) quadrilateral model, (c) hexagon model and (d) circular model.
The pressure distribution inside the effective pores of four models has some difference under the same loading condition. But the maximum pressure inside the pore all generate at the junction of exit slits and the lower pore wall. The maximum pressure mainly appears at the sharp points in triangle and quadrilateral models. The pressure on sharp points and the stress on solid mixture need to be calculated specially. Finally, it is found that the circular model has optimal convergence condition during the calculating process. In order to guarantee the calculation precision, circular model is selected as the standard calculating model in this article.
Basic assumption and boundary condition
In this section, the situation of the pore in the asphalt pavement includes the following conditions. After raining, rainwater penetrates into the asphalt pavement and it cannot be eliminated promptly. It is assumed that effective pores in the asphalt pavement are water saturated. At the same time, the following assumptions about pavement structure are made:
It is assumed that the deformation of the asphalt pavement under traffic loading is very slight. It means the change of pore water pressure which is caused by the deformation of the asphalt pavement under the traffic loading could be ignored.
It is assumed that pore models have entrance slits and exit slits. Meanwhile, the air pressure at exit slit in pore models is 0. It means it is not affected by the changes of pressure caused by internal air compression or the slits are long enough so that the internal air pressure remains the same at the exit slit when rainwater flows in.
It is supposed that the flowing water inside the pore caused by the vehicle loading is isotropic turbulence. The standard k-ε model is applied and the wall function method is used for calculation.
The fluid velocity at entrance slit in the pore model is set 0, and the speed of model internal fluid is also 0. It is assumed that the fluid remains stationary state within a short time.
This article uses the turbulence module in the calculating process. The value of pulsation kinetic energy k and discrete rate

where

where Cu is a constant which usually takes 0.09 and l is the turbulence scale.
Steady-state calculation and analysis
In order to accurately describe asphalt pavement performance in water-saturated state, steady-state analysis of the finite element software CFD-ACE+ is used to analyse the distribution of pore water pressure in asphalt pavement. The flowing velocity, direction of fluid and the viscous shear stress inside the pore can also be obtained. Based on the analysis of pressure and flow field, some developing rule of moisture damage in asphalt pavement could be obtained.
The steady-state analysis results of the standard model
The steady-state calculation of the standard model was conducted. The inlet pressure in the entrance slit appears when pavement water was extruded into the entrance slit by traffic loading. Bernoulli equation as equation (3) was used to calculate the initial water pressure at the entrance slit. We know that the inlet pressure in the entrance slit is related with the vehicle speed. By the calculation of standard model, we obtain data such as pressure velocity and shear force inside pore. These data could be used to analyse the failure process of asphalt mixture caused by the dynamic pore water

where p is the dynamic water pressure caused by wheel load at entrance slit,
We obtain the maximum pressure inside the pore for different speeds by adjusting the inlet pressure. The calculated data and fitting curve of the relationship between vehicle speed and maximum pressure inside the pore are shown in Figure 4.

The calculated data of the relationship between speed and maximum water pressure.
Formula (4) was obtained by regression analysis of calculating data. It could be used to calculate the dynamic water pressure inside pavement effective pores caused by the extrusion of high-speed tyres at any vehicle speed

Then, the distribution of hydrodynamic pressure, velocity and viscous shear stress in pavement effective pores at the vehicle speed of 135 km/h was concretely analysed. The pressure distribution diagram of the standard model is shown in Figure 5.

Pressure distribution.
From Figure 5, it is clear that the distribution of the internal pressure values is not uniform. The maximum pressure is 0.968 MPa which appeared below the junction of exit slit and the pore wall. The value of fluid pressure generated inside the pore is larger than the compressive stress applied at the entrance.
Positive and negative pressures inside the pore exist at the same time. The negative pressure is generated at a small area in exit slit. The maximum negative pressure is −0.358 MPa. That leads to a great pressure difference at both ends of exit. It is because the sizes of exit slit decrease sharply. Part of the fluid is blocked by the pore wall. Flowing direction of fluid at exit slit is not horizontal and an angle exists between the exit slit and the flowing direction. Therefore, high-speed whirlpool generates when fluid flows through the exit slit, and that is why the negative pressure form. The velocity distribution diagram of standard model is shown in Figure 6.
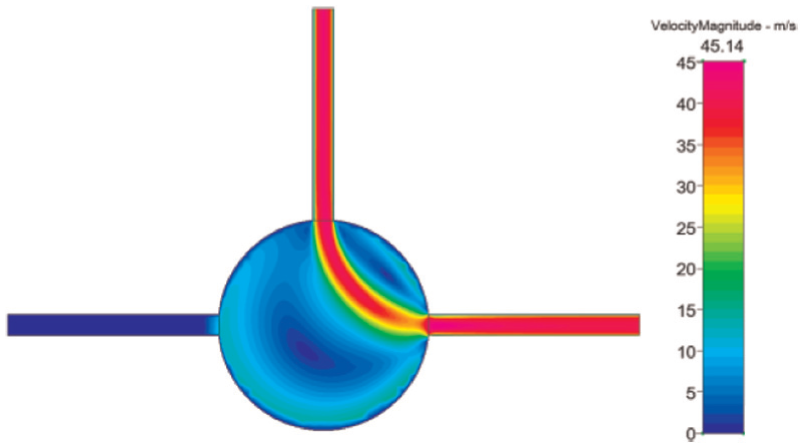
Velocity distribution.
It can be seen from Figure 6 that high velocity flow appears from entrance to exit slit. The maximum fluid velocity is up to 45.14 m/s. When the fluid passes the entrance slit and flows into the pore, the watershed turns wide and the flowing velocity decreases. While when the fluid passes the exit slit and flows out, the watershed turns narrow and the flowing velocity increases. Part of the fluid is blocked by the pore wall at both sides of exit slit.
The pressure at the exit slit is greater than the pressure at other positions. This is because the exit slit is directly scoured by fluid. Fluid in the pore flows along the wall surface. According to the boundary layer theory, the fluid velocity at pore wall is not large. Thus, the viscous shear stress is small. But the biggest viscous shear stress is located at the exit slit. As shown in Figure 7, the maximum viscous shear stress is up to 0.0466 MPa.

The viscous shear stress distribution.
It is inferred that the inner damage of the pore will generate at the exit slit first. Fluid scours the pore wall continuously which will cause fatigue damage of the aggregate. Moreover, the width of the slit which connect with the pore becomes wider and wider.
Analysis effect of connecting slits size on calculating results
Since the exit slit was damaged, the width of the exit slit will increase constantly because the asphalt was stripped and aggregate was peeled off. The increasing slit width could make certain influence on the pore’s internal stress, flowing velocity and flowing direction. With the peeling off of the aggregate, width of the pore slit in asphalt pavement will gradually increase. Thus, local failure happens in a large area.
In order to accurately analyse how slit size influences the internal pressure and other factors, the standard model was selected as calculating model. The size of entrance and exit slits is adjusted. Four kinds of size, 0.5, 1, 1.5 and 2 mm, are chosen individually for calculation. Based on equation (3), different loads from 0.05 to 0.7 MPa could be applied as inlet pressure. The calculation is shown in Figure 8.

The maximum pressure of fluid in the pore.
Figure 8 shows that if the traffic loading is consistent, the maximum pressure inside the pore increases when the size of exit slit increases. Maybe it is because the velocity of pore water is very low or even close to static. Thus, internal pressure of the pore is very close to or as same with the inlet pressure. Based on the calculation of model whose slit width is 0.5 mm, the maximum pressure is almost the same with the load applied at entrance. This is because exit slits of the pore are very small so that fluid velocity is small. The loading at entrance slit is transferred inside the pore by flowing water. It causes fluid pressures inside effective pores. The fluid volume at exit slits and the fluid velocity in the pore gradually increase as the size of pore slit becomes bigger. At that time, pore walls bear the impact which is caused by the delivered loading and scouring pressure which is caused by the flowing fluid. The maximum pressure of the pore increases as well. Due to the obstruction of pore walls which are near exit slits, the pore walls should bear not only the pressure delivered by fluid, but also the fluid scouring pressure. Therefore, the maximum pressure appears at this position.
The maximum pressure inside the pore increases when the load applied at the entrance gradually increases. This conclusion indicates that the possibility of the early stage moisture damage inside the effective pores in asphalt pavement could be increased under the influence of high-speed wheel loading. It could lead to accelerated damage of asphalt pavement. In addition, due to the increase in fluid velocity in pore slits at the same time, the fluid viscous shear stress at slit connections also increases constantly. The direction of maximum stress inside effective pores is perpendicular to the pore walls. Although it will not cause direct drift or tensile failure in asphalt membranes, it is obvious that the moisture damage easily appeared in the area where two forces act repeatedly in a long term.
A model is established to do a further research on the process of moisture damage. This model is mainly used to analyse the change of pressure when size of exit slit is changed. The pore diameter of the model is 10 mm. The number of slits which connect with the pore of model is three. The width of vertical slit is 1 mm. It is an entrance slit. And the left lateral slit is closed, and its width is 1 mm. The slit on the right is free exit. The width of the transverse slit at the position which connects with the pore wall is 2 mm and its length is 5 mm. Then, the width of transverse slit turns to 1 mm and length of this part is 10 mm. The calculation results are shown in Figure 9.

Pressure distribution.
Figure 9 shows that the maximum pressure appears at the junction between the exit slit and the pore wall, and it is 0.908 MPa. Fluid constantly scours this position due to the pressure caused by traffic loading. It leads to the damage of asphalt mixture and then causes the increase in the exit slit size. Eventually, the surrounding pore wall will wreck entirely. The pressure at the position where width of transverse slit changed is also large which is up to 0.77 MPa. The damage at this position leads to an increasing width of the pore slit. In the end, the pore slit will extend. When pore fluid flows through the wider pore slit, its velocity and pressure also increase. Thus, the destruction process of pore will accelerate.
Analysis effect of pore connectivity on calculating results
In order to research how the number and location of exit slits influenced the pressure of pore fluid, six models were selected to calculate it. Their calculations were compared and analysed. All of these six models were established based on the standard model. Diameters of pore slit in six models are all 10 mm. Their widths of slit are all 1 mm, and their lengths of slit are all 10 mm. The six models can be distinguished by the number and position of exit slits. The models were calculated when their inlet pressure was 0.7 MPa. Model 1 has one entrance slit and one exit slit. Models 2, 3 and 4 all have one entrance and two exits. Models 5 and 6 all have one entrance and three exits. According to the calculations of six models, pressure distribution diagrams of fluid inside effective pores are shown in Figure 10.

The pressure distribution figures of six models: (a) model 1, (b) model 2, (c) model 3, (d) model 4, (e) model 5 and (f) model 6.
The pressure distribution diagrams indicate that differences in pressure distribution inside the pore exist in these models. The number and positions of exit slits could affect the distribution of inner pressure of effective pores if the initial conditions are same. In order to analyse the specific pressure distribution, the calculations of six models are listed in Table 1.
Calculation results of connectivity analysis.
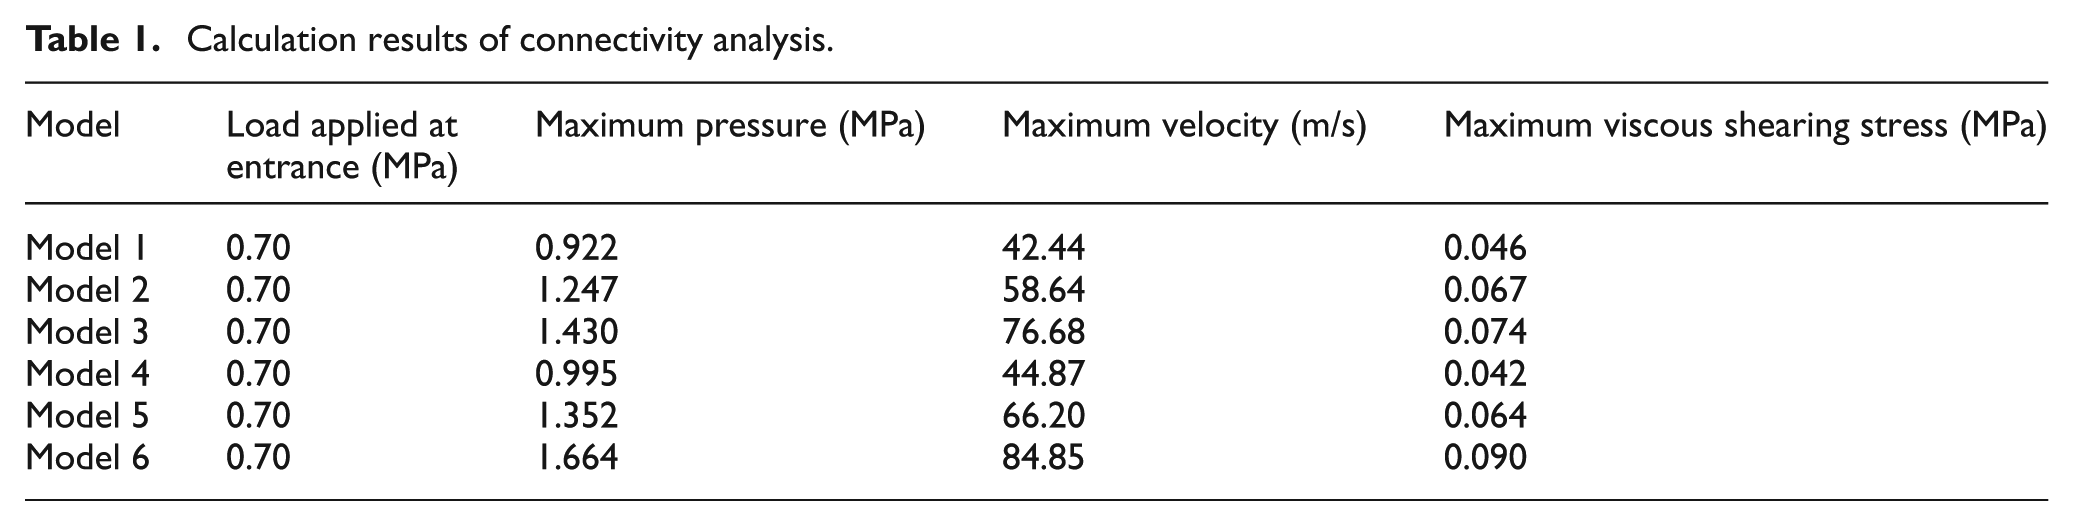
Model 1 has one entrance slit and one exit slit. Model 4 has one entrance and two exits. It can be found that the maximum pressure of the pore in model 4 is larger than model 1. Similar comparison was done between the calculations of models 2 and 5 and models 3 and 6. Both models 5 and 6 have one more exit slit on the left side than models 2 and 3; similarly, models 5 and 6 also have larger maximum pressure. Therefore, it can be concluded that more exit slit number means larger maximum pressure inside pore.
The entrance pressure applied at model 1 is 0.7 MPa. The maximum pressure inside the pore is 0.922 MPa. The pressure inside the pore is mainly related to the transmission of liquid pressure. However, the maximum pressure in model 6 which has three exit slits is 1.664 MPa. It means that the maximum pressure of the pore also has relationship with the impact force which is generated by the high velocity flow. The magnitude of maximum viscous shear stress near pore wall has a positive correlation relationship with the fluid velocity in the pore. The position of maximum viscous shear stress mostly is located at the exit slit where fluid velocity is largest. Model 4 has the smallest maximum shear stress of all models as its maximum fluid velocity at exit slits is smallest.
The magnitude of maximum pressure is also related to the position of slits. The pressure of slit at lower position is larger than the slit at higher position by contrast with the pressure distribution of models 2, 3 and 4. Maybe it is just because the scouring force at the junction between pore wall and exit slit is stronger if the position of slit is lower. The same conclusion could be achieved by contrast model 5 with model 6. The result indicates that the fluid velocity is higher and the scouring force at the junction is stronger if exit slit is located at lower part of the pore.
The research contents mentioned above show that the increase in exit slit number and fluid velocity could lead to the increase in inner pressure when the same wheel loading is applied. This phenomenon accelerates the moisture damage of asphalt pavement. The larger maximum pressure will exist when exit slit is located at lower position. The continuous scouring of pore water could erode the asphalt mixture from top to bottom if downward exit slit exists. When the fluid reaches the position between two layers, the bond performance between two layers would decrease. When the downward erosion reaches the base course, the cement fine material or fly ashes fine material could be sucked out gradually under the action of the vehicle loading. And then the pumping phenomenon will begin to appear.
Transient-state calculating model
Transient calculation is more close to the actual condition of the action of vehicle loading. The standard k–ε model and wall function method were used for solving the problem of turbulence.
Establishing the transient-state calculating model
The length of the asphalt pavement model is 300 mm. The thickness of surface course of asphalt pavement is chosen as 40 mm. The model of the pore inside asphalt pavement lies in the middle of the pavement. It is a round pore whose diameter is 10 mm. There is an entrance slit which connects with the top of the pore in the vertical direction. The entrance slit is 10 mm long and 1 mm wide. An exit slit was set on the right side of the pore. It is long enough and it reaches the right edge of pavement model. A closed 5 mm-long slit was set on the left of the pore, as shown in Figure 11.

The dimension of the transient calculation model.
Material parameter and boundary condition
The density of pore water in the model is 1000 kg/m3. The dynamic viscosity at 20°C was chosen as the viscosity which is 1.003 × 10³ Pa S.
The parameters of asphalt pavement material in this article are chosen according to common asphalt pavement structure of highway in China. The pavement thickness is 40 mm, the elastic modulus of the surface course is 1400 MPa, the Poisson ratio is 0.35 and the density is 2400 kg/m3.
This article adopts the design parameters of standard axle BZZ-100 in the highway asphalt pavement design criteria. The uniform load is defined as qmax and the loading period is defined as T. The effect of the action of vehicle loading at the pore entrance is the same as action of half sine distributed load on the top of the pore, as shown in equation (5)


where T is the loading period, D is the circle diameter of single wheel transferring pressure surface, V is the vehicle velocity and t is the time.
The function curve of dynamic load is shown in Figure 12.

Time history curve of dynamic load.
Fixed boundary conditions were applied on the left side boundary and the lower side boundary of the fundamental model. The left side boundary and the lower side boundary were confined so that no displacement exists there. Symmetry boundary condition was applied on the right boundary. It meant the right boundary is regarded as a symmetric boundary. Y-direction has no displacement, while X-direction has. The contact boundary of pore slit and solid model was set as fluid–solid coupling boundary. It meant the force on the liquid could act on the solid. The above dynamic load was applied at the entrance slits. The pressure at the exit slits is 0. The initial fluid velocity inside the pore is also 0.
Transient-state calculation and analysis
The fluid–solid coupling model of asphalt pavement was established. We choose the uniflow fluid–solid coupling, namely force only transfer from fluid to solid by the coupling boundary. The damage status of asphalt mixture and possible positions of moisture damage at early stage could be estimated by transient-state calculation.
The stress analysis of cracking gap inside the exit slit
It is assumed that the exit slit has cracking gaps as shown in Figure 13. The gaps maybe exist only in asphalt or exist between asphalt and aggregate. The fluid velocity decreased sharply when the fluid flows through the cracking gaps. The mixture around the gaps may suffer from great impact force. Therefore, it has great significance to explore emerging and development law of early stage moisture damage in asphalt pavement by researching this kind of cracking gap.

The transient calculation model with cracking gap inside the exit slit.
According to Figure 14(a), the fluid velocity inside the cracking gap is zero and there is a deceleration process existing at this position. Thus, if this kind of cracking gap existed in the flowing area inside the pore, the momentum of the fluid would be converted into a force acted on this position.

The result of the calculation: (a) the map of velocity distribution and (b) the map of equivalent stress distribution.
As shown in Figure 14, the cups at right side of cracking gap bear stronger pressure relative to the left boundary. It explains that the flowing liquid caused a serious destruction of asphalt mixture, and the maximum equivalent stress is located at the right lower cusp.
Based on Figure 15, it is known that the right boundary of the cracking gap was compressed in both X- and Y-directions. And its bottom boundary was compressed in Y-direction. It means the rightward and upward forces exist on the right boundary and the downward force exists on the lower boundary. All forces acted at the cusp of the cracking gap together so that a stronger force was emerged at the cusp.

The map of stress distribution in X-direction and Y-direction.
The stress analysis of cracking gap inside the pore of pavement
Closed gaps in three locations were chosen to analyse the stress of asphalt mixture around the gap. These positions include the upper left, the middle bottom and the lower right of the boundary. These analyses could be used to make sure the location of the maximum stress and the position where the first damage emerges.
As shown in Figure 16(a), the maximum stress emerged at the pore wall bottom. The value of equivalent stress at the closed gap is between 0.285 and 0.34 MPa. The equivalent stress at the closed gap is apparently lower than the maximum stress which is 1.261 MPa. Figure 16(b) shows that the location of the maximum equivalent stress is just below the closed gap. It is because those directions of pressure are always vertical to the pore walls and a larger fluid pressure emerges at this position. Therefore, the maximum equivalent stress is located at the position where it is just below the closed gap. Its value is between 2.8 and 4.2 MPa. The location of the maximum equivalent stress in Figure 16(c) lies in the lower right of the closed gap. Its value is between 1.8 and 3.6 MPa.

The distribution map of stress of closed gap: (a) closed gap is at top left corner, (b) closed gap is at the underneath and (c) closed gap is at the down-right corner.
According to these calculations, the maximum equivalent stress emerges when the cracking gap of asphalt mixture is just below the pore slit. Because the directions of inner fluid pressure of the pore are always perpendicular to the pore wall, left and right sides of the lower semi-circular wall bear the pressure in opposite directions. All of these lead to strong tensile stress in horizontal direction at this position. Downward fluid pressures act at the bottom of the closed gap. Meanwhile, large tensile stresses were emerged at vertical direction. Thus, when the shape of asphalt pavement pore is round or nearly round and the pore has several closed gaps, initial damages on cracking gaps would emerge if slits exist at lower place of the pore wall. If the cracking gaps exist at the upper half of the pore wall, the maximum force would emerge at the bottom of the pore wall.
Test analysis
The bonding strength and adhesion strength can be obtained through test. Then, we can get accurate damage form and position during the scour process by comparing the numerical simulation results with experiment results.
Nowadays, some kinds of test methods have been invented which could measure adhesion between asphalt and aggregate directly. Mo 14 did the dynamic mechanical analysis (DMA) tensile test between the interface of asphalt and aggregate. Zhao 15 developed pull-off test about asphalt paste untreated aggregate bonding properties to reveal the meso-mechanism of asphalt pavement damage caused by condensate ice according to actual pavement condition. It is generally believed that bonding property of asphalt mixture is the main factor which affects water stability of asphalt pavement. The test in this article adopts HC-40 Hydraulic Pressure Measuring Device invented by professor Zheng et al. 16 from Jilin University.
The principle of the test
The principle of this test can be summarised as follows: adhesion failure and cohesion failure could emerge at the contact surface of the asphalt mixture due to the tensile load. The separation area of asphalt and aggregate is defined as adhesion failure area Sa, and asphalt’s own separation area is defined as the cohesion failure area Sc. The relationship between tensile failure load F and the overall tensile strength Rt could be expressed by formula (7). While relationship among tensile failure load F, strength of adhesion Ra, failure area of adhesion Sa, strength of cohesion Rc and failure area of cohesion Sc could be expressed by formula (8)


where Ra is the adhesion force between asphalt and aggregate and Rc is the cohesive force of asphalt materials.
The process and results of the test
The thicknesses of asphalt membrane were selected as 1, 0.45 and 0.25 mm for testing. The test process is shown in Figure 17.

The process of the test: (a) the test specimens, (b) the applied load process, (c) specimens tensile process, (d) specimens were parted, (e) the tensile failure surface of 1 mm thickness specimens and (f) the tensile failure surface of 0.25 mm thickness specimens.
The test results are shown in Tables 2–4.
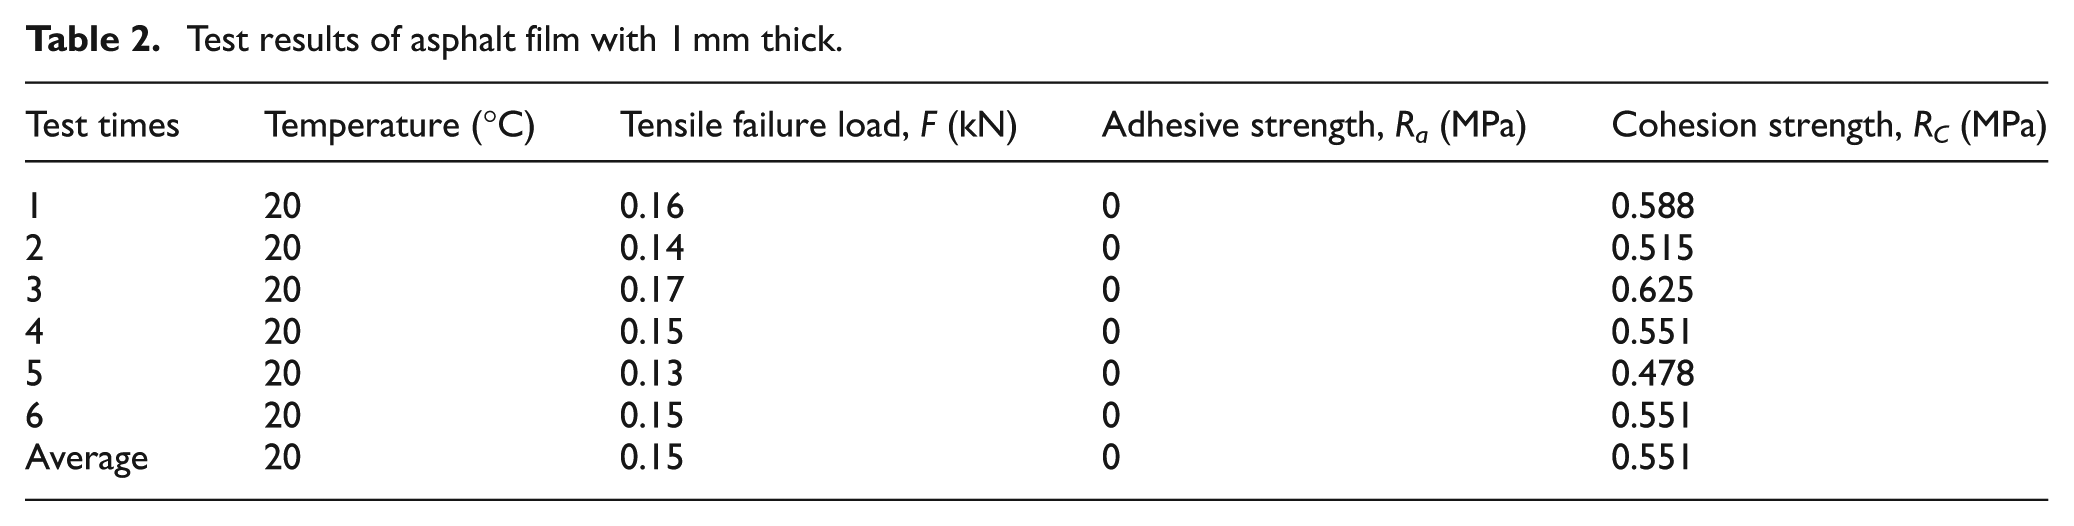
Test results of asphalt film with 1 mm thick.
Test results of asphalt film with 0.45 mm thick.

Test results of asphalt film with 0.25 mm thick.

From Tables 2 and 3, the average asphalt bond strength Rc could be gained. It is 0.551 MPa in Table 2 and 0.521 MPa in Table 3. No cohesion failure emerged in these situations. Based on the calculated adhesive strength Ra which exists between asphalt and aggregate, the average Ra is 0.349 MPa.
Compared with the calculation in section ‘The stress analysis of cracking gap inside the exit slit’, if cracking gaps exist in the asphalt mixture exit slit, a wall in the cracking gap faces to the flowing fluid. It obstructs the flowing of the fluid. And the inner liquid pressure of cracking gap is from 0.52 to 0.54 MPa. The mixture located at the right cusp of gap bears the maximum stress in X-direction and Y-direction. The maximum stress in X-direction is 0.781 MPa and the maximum stress in Y-direction is 0.786 MPa. A shear stress was acted on the asphalt mixture in horizontal direction due to the stress in X-direction. An upward tensile stress caused by the stress in Y-direction was acted on the asphalt mixture in the vertical direction. In other words, the direction of the stress applied is the direction which the asphalt membrane was torn. The stress value is bigger than the bond strength, 0.349 MPa. Therefore, if there are cracking gaps or other defects existing in the asphalt membranes inside the pore, pore water could cause micro-damage of the asphalt membrane when the vehicle loading applies. Since long-term repeated load acts on the pavement pore, the cracking or defect in asphalt membrane will increase gradually until the asphalt membrane desquamates from the aggregate surface.
At the right cusp of cracking gap, all the maximum stresses in X-direction and Y-direction are larger than the asphalt bond strength and adhesive strength. Thus, if similar gaps exist in fluid flow area like this model, the cracking gap will be broken and micro-damage will gradually accumulate. Finally, new cracking gaps will be generated under the influence of long-term repeated load at this position.
The calculation model in section ‘The stress analysis of cracking gap inside the pore of pavement’ simulates the situation that the pore has cracking gap which does not penetrate the whole surface course. The magnitude of the stress which acted on asphalt mixture around the pore is related with the location of cracking gap. When the cracking gap is located at upper half of the pore, the maximum equivalent stress appears on the pore wall just below the pore. Its value is 1.261 MPa. The range of stress value in X-direction is from 0.7 to 0.75 MPa and in Y-direction is from −0.76 to −0.82 MPa. The minus sign means pressure, so the stress in Y-direction is pressure stress which will not cause cracking failure directly. While the stress in X-direction is tensile stress, the asphalt mixture at the bottom of the pore may be pulled a seam by instantaneous stress in X-direction, and new cracking gap gradually emerges which will continue to extend downwards.
When the cracking gap is located at lower part of the pore, the maximum stress inside the pore will emerge at the same position. The value of equivalent stress is from 2.5 to 4.2 MPa. The distribution of stress value in X-direction is from 2.5 to 4.2 MPa, and in Y-direction is from −0.61 to 1.54 MPa. The stress in X-direction is distributed at the bottom of the cracking gap. It is larger than the bond strength of asphalt which is 0.536 MPa. Thus, the cracking gap will extend downwards by the action of the stress in X-direction.
Conclusion
Moisture damage of asphalt pavement was researched based on meso-level in this article. Specific conclusions are stated as follows:
Based on the calculations and analyses of the standard model, the maximum pressure inside the pore emerges at the junction between pore wall and the exit slit. It is inferred that the damage of asphalt mixture could first emerge at this position. The fluid has viscous characteristics, and viscous shear stress could be found at the pore wall and slit boundary. A conclusion could be inferred that the scouring pressure of fluid inside the pore could act at the position where diameter of the exit slit changes. The damage can also emerge at this position.
The maximum pressure inside the pore increases when the load applied at the entrance gradually increases. The maximum inner pressure of the pore in these four models was compared when same load applied at the entrance. It could be found that the fluid velocity increases when the size of exit slit increases. Meanwhile the increasing of fluid velocity will lead to larger pressure inside the pore. Therefore, the damage of asphalt mixture becomes more serious.
A model was established by changing the diameter of exit slit. This model could be used to simulate the possible position of the moisture damage when the exit slit had already been damaged. The calculation result showed that the flowing fluid will continuously scour exit slit and pore wall. This led to the extension of the slit. The pressure at the position of slit diameter changing also caused a serious damage. The gap inside the pore was widened. The pressure inside the pore increased when the exit slit turned wider.
The inner pressure distribution is related to the number of exit slits connected with the pore. More exit slits means larger maximum pressure inside the pore. The pressure distribution inside the pore is also related to the position of slits. The lower position of exit slit represents the larger maximum pressure inside the pore. Moreover, the viscous shear stress at the exit slit is bigger than other positions. Therefore, damage position can easily happen here.
If exit slit has micro cracking gap, the asphalt membrane at this position will strip. The maximum stress acts on the asphalt mixture at the pore bottom, especially the closed gaps exist here. Therefore, the cracking gaps will continuously extend under the dynamic water pressure.
Footnotes
Academic Editor: Ming-Jyh Chern
Declaration of conflicting interests
The author(s) declared no potential conflicts of interest with respect to the research, authorship, and/or publication of this article.
Funding
The author(s) disclosed receipt of the following financial support for the research, authorship, and/or publication of this article: The research work described herein was funded by the National Nature Science Foundation of China (NSFC) (Grant No. 51178204). This financial support is gratefully acknowledged.