
Abstract
To study the effect of different milled surfaces on shot peening surface integrity (roughness, residual stress, hardness, and microstructure), research on the change of surface integrity is carried out using the same shot peening process for different milling surfaces of 7055-T77 aluminum alloy. Surface integrity measurements, fatigue fracture analysis, and fatigue life tests are conducted to reveal the effect of surface integrity on crack initiation and fatigue life. The results show that shot peening can reduce the dispersion and instability of surface integrity brought by milling processing, although it increases the surface roughness; the maximum residual compressive stress and depth of residual stress layer increase significantly after shot peening, and the residual stress and hardening distribution are very good; larger surface roughness and irregular surface scratches of milling samples before shot peening easily lead to cracks and gouges produced on shot peening surface.
Introduction
Due to the advantage of high strength, low density, and satisfactory processing performance, high-strength aluminum alloy is widely used in the manufacture of the main structure and load bearing components in the aerospace industry. 1 7055 aluminum alloy is an outstanding representative of a high-strength aluminum alloy in aircraft; compared to 7050 aluminum alloy, 7055 aluminum alloy has higher strength, better fracture toughness, and higher resistance to stress corrosion cracking. 2
Surface integrity adopts surface geometric features, micromechanical properties, and microstructure of surface metamorphic layer to measure the comprehensive performance of machined parts. It contains several indexes, such as surface roughness, surface topography, surface residual stress, surface micro-hardness, and microstructure. 3 The surface integrity must be controlled in the process for the surface integrity has great effect on the fatigue performance for the parts. 4 High speed milling has advantages of good surface quality, high machining precision, and high production efficiency and so on, and is a key technology for surface integrity control. With the high-level concern on working reliability of machined aircraft aluminum alloy structural parts in high-speed machining (HSM), the guarantee of surface integrity becomes primary mission for researchers to accomplish. Zhong et al. 5 focus on surface morphology and crack formation of 7050-T7451 aluminum alloy in high-speed milling, from 3000 to 5000 m/min. Han Huang 6 studied the machining characteristics of nitinol in high-speed milling through a series of systematic high-speed milling experiments; the results show that with the increase in cutting speed, the better will be the surface quality, the smaller will be the magnitude of work hardening. Denkena et al. 7 studied the high-speed milling aluminum alloy and found that the larger feed per tooth, small cutting width, or large blade radius produces deeper residual stress layer at subsurface. Novovic et al. 8 have carried out the system summary analysis, which is based on the previous research on fatigue life, and it was found that the change of the fatigue life of the parts is the combined effect of surface roughness, micro-hardness, residual stress, temperature, and other inclusions; if the correct operating parameters are employed, high-speed milling can provide enhanced fatigue performance. In order to get the optimum milling parameters of high-speed milling 7055 aluminum alloy, Yao et al. 9 conducted the orthogonal experiment and finite element (FE) simulation to research the effect of milling parameters on surface integrity; the results show that when milling speed, feed per tooth, milling depth, and milling width are 1100 m/min, 0.02 mm/z, 0.7 mm, and 6 mm, respectively, good surface quality is obtained and the magnitude of surface metamorphic layer will be larger.
Meanwhile, a large number of scholars have found that shot peening could strengthen the ability for better resistance to fatigue crack initiation of specimen. In the processing of shot peening, enormous quantity of small spherical particles, typically made of hard steel, ceramic, or glass, are made to impact the surface of the structural component at high velocities. As a result, intense local plastic deformation is imposed within a thin layer beneath the surface. Meanwhile, high compressive residual stress and refined grains are introduced within the surface deformation layer, which can enhance the fatigue life and stress corrosion resistance of components. 10 The compressive residual stress is usually regarded as the major factor in increasing fatigue life, which can move the crack initiation from surface to subsurface and resist crack propagation due to the higher level of crack closure effect; thus, the fatigue life can be increased significantly. 11 Hélio et al. 12 studied the influence of surface grooves (peaks and valleys) resulting from machining during the manufacturing process of polished and unpolished nickel-titanium on the fatigue life, and it was found that they were greater for instruments with less pronounced grooves during the rotating bending fatigue test. Kawagoishi et al. 13 conducted a series of shot peening experiments to investigate the influences of shot peening on the fatigue strength and the fracture mechanism. The results show that fatigue life and fatigue strength were improved markedly after shot peening. Mylonas and Labeas 14 carried out the shot peening simulation through the study of a three-dimensional (3D) FE model of aluminum alloy plate and found that shot peening can significantly increase surface roughness, meanwhile generating large residual compressive stress on the surface. Klemenza et al. 15 used a FE simulation model to predict the effect of shot peening on the surface layer characteristics, which were compared with the shot peening experiment and found they are similar. Soady et al. 16 used different methods to quantify plastic strain and yield strength and discussed the distribution of plastic strain and behavior of low cycle fatigue after shot peening through the dislocation theory. Wagner and Mueller 17 studied the influence of shot peening on fatigue behavior of aluminum alloy, and it was found that shot peening could get high dislocation density and high residual compressive stress. Tosha and Lu 18 studied the shot peening effect on the surface integrity, the results show that the maximum hardness of the shot peening process specimens decreases with increasing depth of hardened layer. Yao et al. 19 studied shot peening impact on surface integrity and fatigue behavior of 7055 aluminum alloy, and the results show that compared with the milled parts, the fatigue life of the specimens has been improved after shot peening, due to the generation of residual compressive stress, and fatigue source is transferred from the surface to the subsurface. Dalaei and Karlsson 20 studied the effect of overloads on the stress relaxation and fatigue life time of shot-peened near-pearlitic steels and the results showed that such overloading can reduce the fatigue life time by 25%–60%; because the residual stresses are removed after 1000 strain cycles, corresponding fatigue life times are larger than for the case with unpeened specimens with no overloads. Masaki et al. 21 studied the effects of shot peening on the high-cycle fatigue properties of cast aluminum AC4CH, and the results showed a significant increase in the rotating bending fatigue strength after shot peening. Because of the shot peening, there was residual compressive stress in the surface, which slowed down the surface fatigue crack growth rate of the specimen. S Curtis et al. 22 studied effect residual compressive stress and surface roughness on the rate of crack propagation control law after shot peening processing, so effectively control the shot peening can improve the fatigue life of component.
The objective of this study is to investigate surface integrity under different high-speed milling parameters and same shot peening conditions and surface integrity effects on fatigue life based on the 7055 aluminum alloy. This research carries out surface integrity analysis of peening under different high-speed milling conditions and provides some optimize data to control milling process for aluminum alloy structure.
Material properties and experiment process
Workpiece material
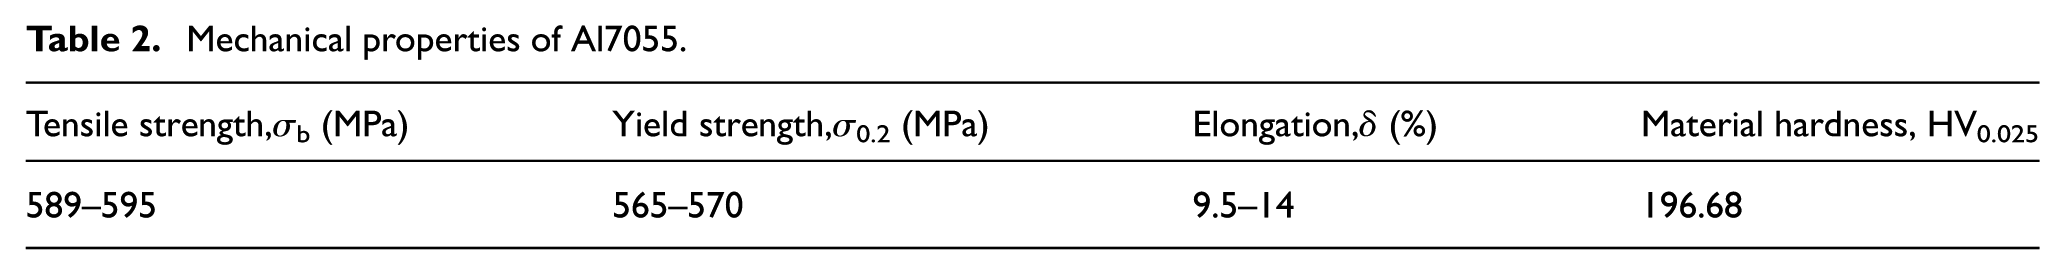
Workpiece material used in all experiments is 7055 aluminum alloy plate, its heat treatment status to T77, chemical compositions and mechanical properties of 7055 aluminum alloy are described in Tables 1 and 2.
Chemical composition of Al7055. 23

Mechanical properties of Al7055.
Experiment process
In order to study shot peening surface integrity under different milling conditions, three kinds of high-speed milling parameters in Table 3 are selected to machine samples, and these three parameters are chosen to get bigger difference in surface integrity.
Milling experiment parameters.

Make an experiment on the Mikron HSM800 with a three-flute uncoated cemented carbide end-milling cutter, with diameter of 12 mm. Dimensions of the specimen are 50 mm × 25 mm × 25 mm as shown in Figure 1. Every specimen, clamped by a fixture, was machined using a new cutter.

End-milling diagram.
After both the specimens, under same conditions, were machined, one was used to test surface integrity and another was used to shot peening. Shot peening experiments were carried out on the air pressure type of Wheelabrator MP4000 shot peening computer numeric control (CNC) machine. Ceramic pellets were used, and shot peening experiment parameters are listed in Table 4. Same conditions were used for peening all three specimens under different milling parameters.
Shot peening experiment parameters.
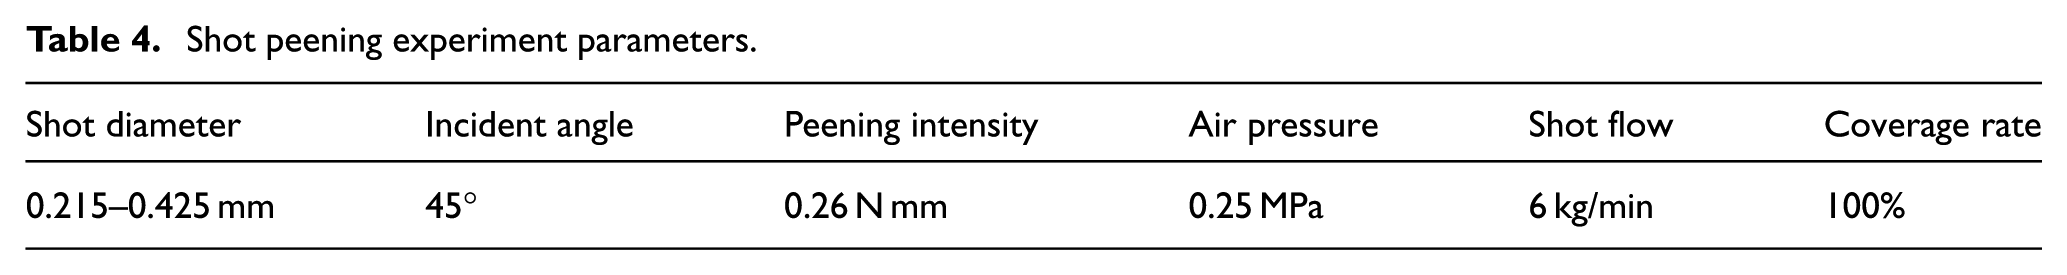
Shot peening intensity is measured by the arc height of Almen specimen (A type) to measure the degree of projectile hit on the metal surface. Shot peening coverage refers to the ratio of the area occupied by bullet marks after shot peening and the total surface area of the part.
Surface integrity testing
Surface integrity tests are conducted for the milled samples and peened samples. Testing method for surface integrity is very important.
Surface roughness and topography
Surface roughness is measured by TR240 rough meter, which is a probe-type portable, and the sampling length is 0.8 mm. Five equidistant points on the specimen surface are selected, and the average value is recorded. The 3D surface topography images were observed by a white light interferometer (Veeco NT 1100), during the scanning process, an objective with ×10 magnification was selected, and the resolution was 736 × 480, the scanning area at every position was 0.4 × 0.4 mm. The regions for testing surface roughness and topography are presented as “A” and “B” in Figure 2, respectively.

Surface integrity test diagram.
Residual stress
Residual stress is tested by LXRD MG2000, a residual stress test analysis system which uses X-ray diffraction with the sin2ψ-method. X-ray diffraction techniques exploit the fact that when a metal is under stress, applied or residual stress, the resulting elastic strains cause the atomic planes in the metallic crystal structure to change their spacing. Using aluminum alloy, block calibrates the instrument before measurement; measured residual stress for zero-stress aluminum of 99.5% is close to 0. When CoKα avg = 1.790Å, 2θ = 148.9°, and 1/2(S2) = 18.56063 × 10⁻⁶ MPa−1, the measured residual stress for proto stress standard is −268 ± 35 MPa. Residual stress is measured along the direction of milling and vertical milling on sample surface. Specimens are stripped using electrochemical method to measure the residual stress that distributed along the direction of cutting depth, in order to obtain the residual stress distribution in deeper region; the thin top layers were removed one by one via successive electrolytic polishing. The region for testing residual stress is presented as “C” in the Figure 2.
Micro-hardness
Vertical section method was used to measure the micro-hardness field. The method is as follows: first, use wire cutting to cut out a small piece from the specimens and then make it into samples. Then, coarse grind, fine grind, and polish the vertical cross section. In the vertical cross section, in the depth direction, test every 10 µm as a layer starting from the surface of the sample. Take measurements at five points equidistantly in each layer, and then take the average. Until the average value is close to the matrix material hardness, obtain the hardness change and its corresponding depth. Use FM-800 hardness measuring instrument to measure micro-hardness field. Select 25 gf as test load force, for a period of 10 s. The region for testing micro-hardness is presented as “D” in Figure 2.
Microstructure
Preparation of metallographic specimen is required for the microstructure test, and etch liquid is used to corrode it. The corrodent was matched as nitrate acid:hydrofluoric acid:water at 1:1:10, respectively. Microstructure of processing cross section was observed and tested with TESCAN MIR3XMU, a field emission scanning electron microscope (SEM). The region for testing microstructures is presented as “D” in Figure 2.
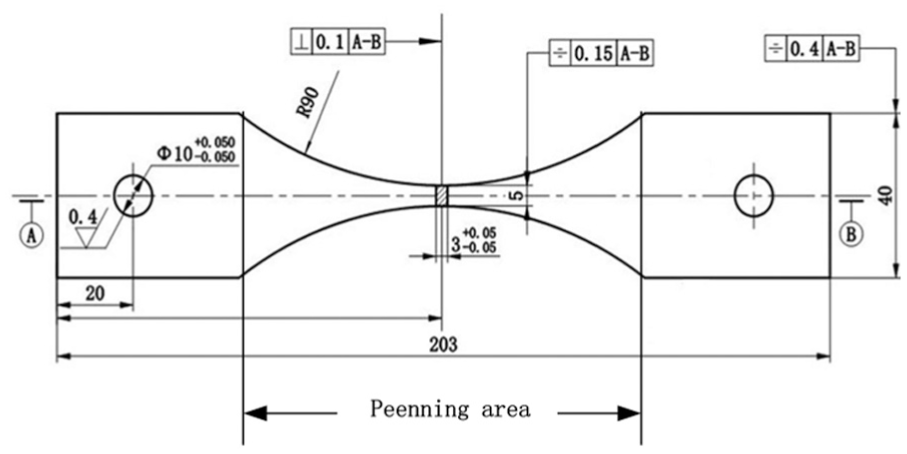
In order to verify the effect of surface integrity after shot peening, fatigue tests were conducted. The thickness of smooth fatigue specimen (K t = 1) is 3 mm, as shown in Figure 3.
Geometry of fatigue specimen.
In total, 10 pieces of fatigue sample were milled and 5 of them were peened after milling. Milling linear speed was 1300 m/min, where the feed of each tooth was 0.02 mm, milling depth was 0.5 mm, and milling width was 6 mm. Milling process was conducted on Mikron HSM800. Shot peening was carried out on MP4000 shot peening machine under the same conditions. Fatigue tests were carried out in a QBG-20, a high-frequency fatigue testing machine, where the loading frequency is 85–87 Hz, the maximum nominal stress is 300 MPa, and the cycle stress ratio is 0.1.
Surface integrity analysis and fatigue
Surface roughness and topography
Figure 4 shows the surface roughness comparison of different milling surface samples before and after shot peening. The results show that the effect of shot peening process on samples is very strong and causes a significant increase in surface roughness; different milling parameters caused huge difference of surface roughness R a from 0.184 to 1.4 µm; surface roughness after shot peening under the same conditions is very close. In the process of shot peening, the continuous random pellets strike the surface of the specimen, the specimen surface craters or pellets are embedded in the surface, resulting in surface roughness increase because of the same shot peening parameters; however, the surface roughness of three different milled surfaces after shot peening is basically the same.

Surface roughness before and after shot peening.
The 3D surface topographies of milled samples are shown in Figure 5(a), (c), and (e). Machining texture along the milling direction exists in all surfaces, formed by the relative motion of the cutter and the sample. Figure 5(b), (d), and (f) shows the surface topography after shot peening, corresponding to milled samples in Figure 5(a), (c), and (e). By comparing, it can be seen that after shot peening, more obvious plastic deformation occurs on the surface, and milling marks on the surface are difficult to identify, forming an uneven distribution of pits and bumps. Pit depths of three samples on peening surface are 12.852, 13.069, and 12 µm, and pit diameters are 0.09, 0.095, and 0.09 mm, respectively. After shot peening, the differences of pit depths among 1#, 2#, and 3# specimens are very small, and so does pit diameters. These may be caused by the usage of same shot peening parameters. So, peening can produce a consistent and isotropic surface texture; because shot peening coverage is 100%, there is no influence between the roughness of shot peening surface and milled surface.
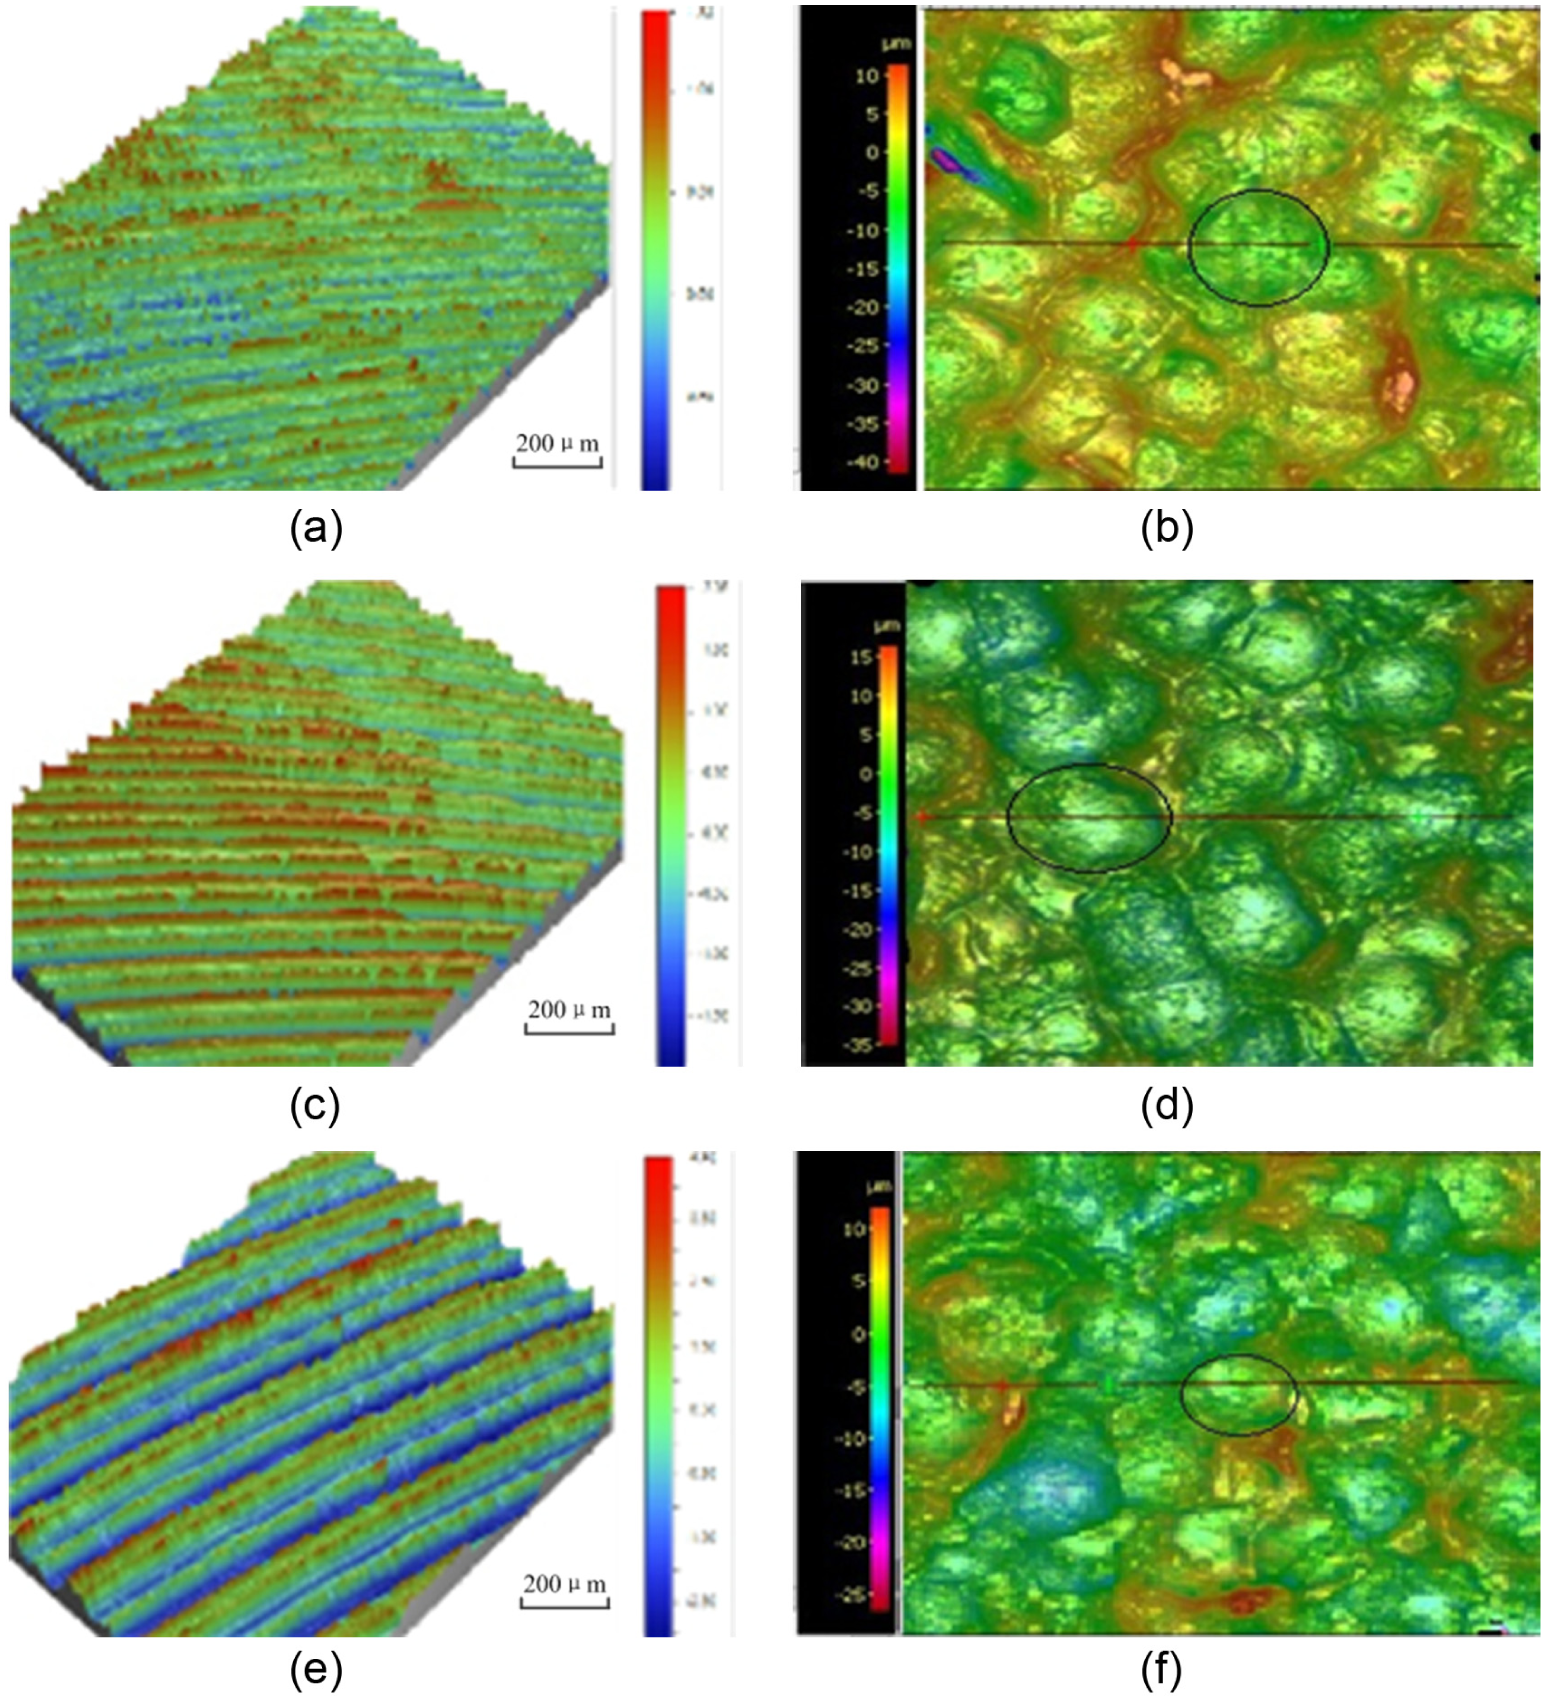
The 3D surface topography after milling and peening: (a) 1# R a = 0.184 µm after milling, (b) 1# R a = 2.568 µm after peening, (c) 2# R a = 0.764 µm after milling, (d) 2# R a = 2.584 µm after peening, (e) 3# R a = 1.400 µm after milling, and (f) 3# R a = 2.678 µm after peening.
Residual stress
Figure 6 shows the residual stress distribution along the depth direction before and after shot peening.

Residual stress distribution before and after peening: (a) σ x and (b) σ y.
From Figure 6, all residual stress in surface before and after peening is compressive, and the compressive residual stress first increases up to the maximum stress, and then decreases to the residual stress of matrix material with the increase in depth. Residual stress difference of milling and peening is shown in Table 5. For milling process, residual stress on the surface ranges from about −50 to −100 MPa; maximum residual stress occurs at the location under the surface, about 10 µm, and the maximum residual stress is about −165 MPa; depth of residual stress layer is about 45 µm. For peening process, residual stress on surface ranges from about −200 to −230 MPa; maximum residual stress occurs at the location under the surface, about less than 10 µm; the maximum residual stress is about −250 MPa; and depth of residual stress layer is about 65 µm.
Residual stress difference of milling and peening.
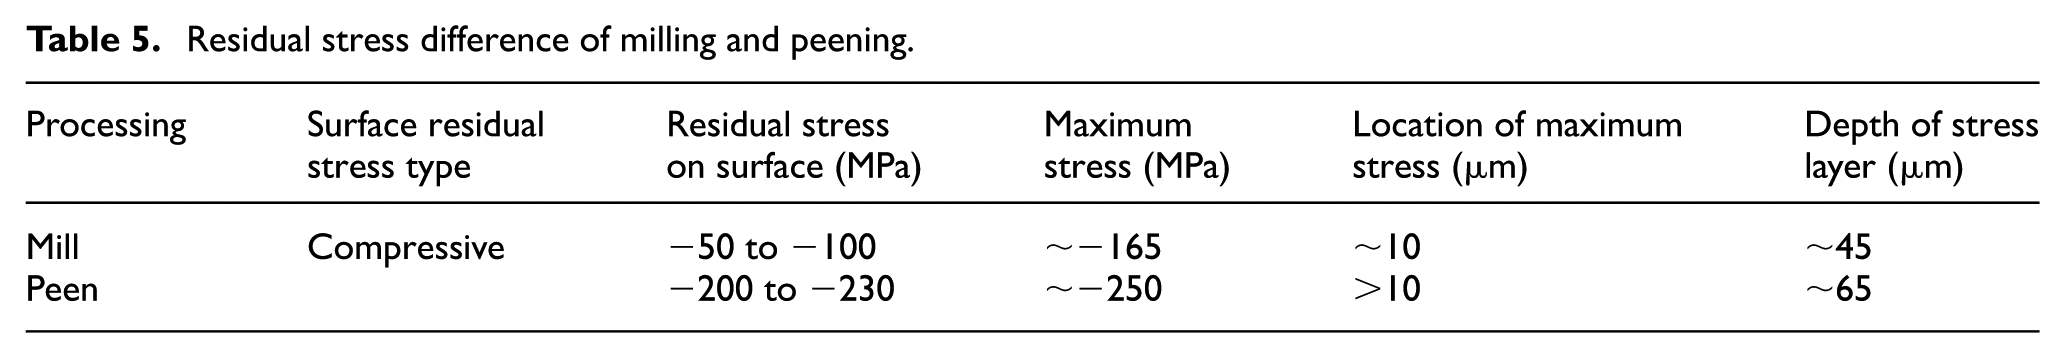
Through comparison of milling and peening residual stress distribution, it can be seen that residual stress on surface, the maximum stress, and the depth of stress layer increase. From the experimental results, it can be found that shot peening can improve the consistency of residual stress distribution. This is mainly reflected in two aspects: residual stress distribution brought by milling shows a big difference in the X and Y directions, but the residual stress distribution in X and Y directions are isotropic after shot peening process.
Micro-hardness
Figure 7 shows micro-hardness distribution along the depth direction before and after peening. Micro-hardness of peening is higher than milling, and the increase range is about 10–20 HV. For micro-hardness distribution before and after peening, micro-hardness first decreases down to the minimum micro-hardness at the location under the surface about 5–10 µm, and then increases to the micro-hardness of matrix material with increasing depth.

Micro-hardness distribution before and after peening.
From Figure 7, for milling process, micro-hardness on the surface is about 190 HV, the minimum micro-hardness at the location under the surface is about 7 µm, and the minimum micro-hardness is about 170 HV. After about 20∼25 µm, micro-hardness reach to the stable value of matrix material. For peening process, micro-hardness on the surface is about 200 HV; the minimum micro-hardness at the location under the surface is about 5 µm, and the minimum micro-hardness is about 178 HV. Also, after about 20∼25 mm, micro-hardness reach to the stable value of matrix material. So, when three milled specimens are strengthened by same peening conditions, micro-hardness of shot peening specimen is higher than that of the milling specimen, and the growth trend of micro-hardness is similar, the value of micro-hardness increases by 10–20 HV. This is mainly because the increase of equivalent static load and enormous impact energy acts on the material, which have a great effect on the plastic deformation and the working hardening layer during shot peening process, and the shot peening process reconstruct the hardened layer state of the milled components.
Microstructure
Figure 8 shows the microstructure of peening specimens for three different milling conditions. Grain refinement, deformation, and elongation are evident in peening direction. Depths of plastic deformation layer of the three specimens in Figure 8 are about 20 µm. Obvious microstructure deformation generated mainly because of the impact of the projectile produced.
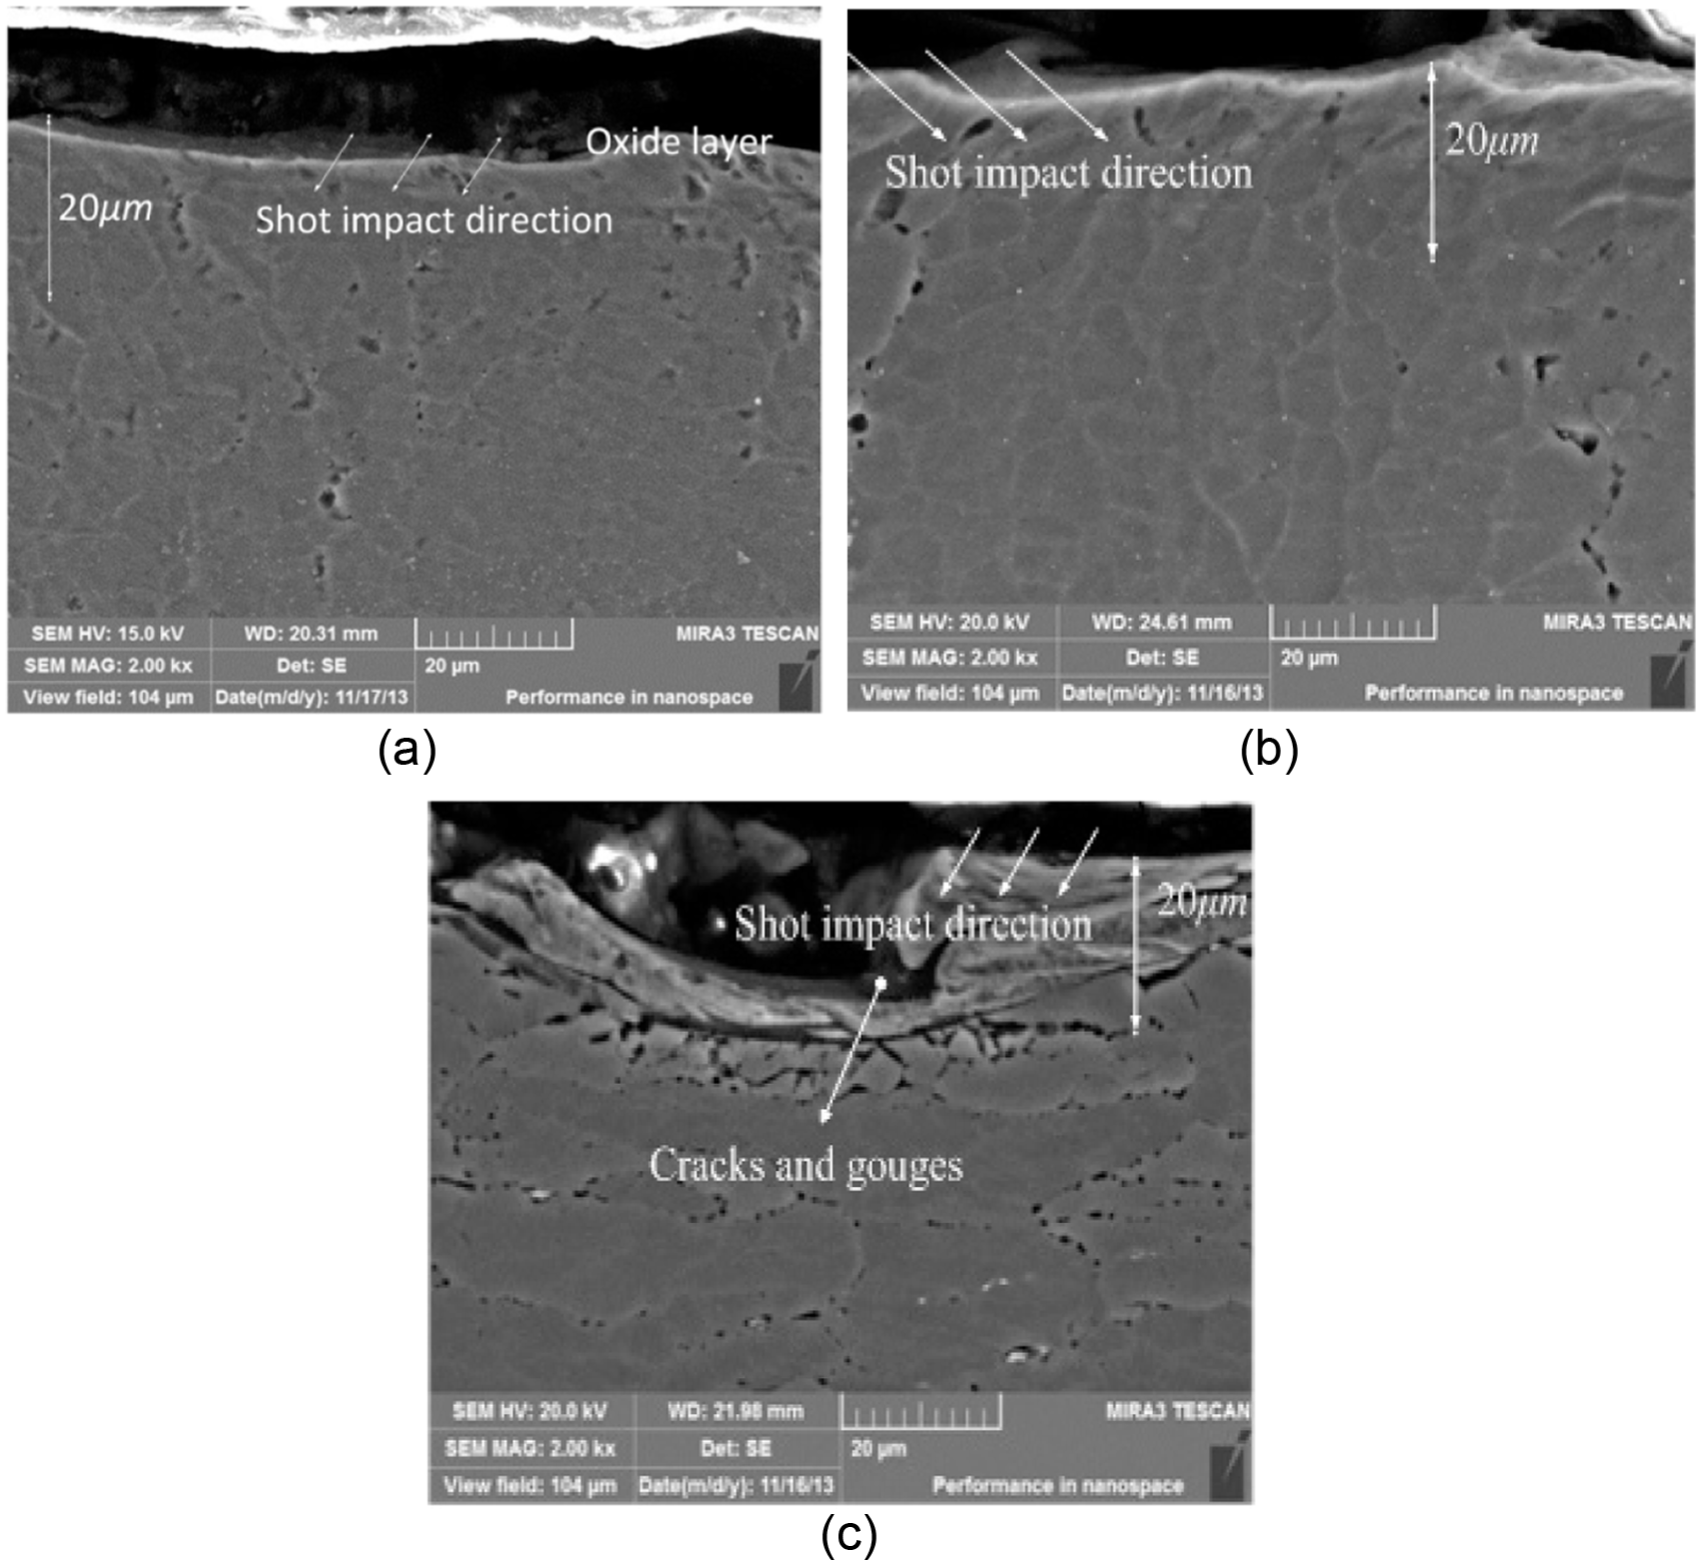
Morphology of microstructure after peening: (a) 1# R a = 2.568 µm, (b) 2# R a = 2.584 µm, and (c) 3# R a = 2.678 µm.
From Figure 8(c), cracks and gouges appear on the peened surface obviously. This is a result of the larger surface roughness, the deeper milling marks, and the obvious surface gully and collapse for milling samples before peening. Thus, the larger surface roughness and surface texture state of milling samples before peening will lead to obvious cracks and gouges appearing on shot peening surface.
Fatigue test
Fatigue life of milled and peened specimens is analyzed. Fatigue life of milled specimen is smaller than that of peened specimen. Shot specimen fatigue life is 23 times the fatigue life of the milled specimen. The fatigue life of the specimen is improved dramatically.
The fatigue fracture morphology was observed to investigate the initiation and growth of fatigue crack under high-cycle fatigue loading for the milled fatigue specimen and the peened fatigue specimen. Figures 9 and 10 show the fracture pictures of the milled fatigue specimen and the peened fatigue specimen. Fatigue fracture contains fatigue source zone, fatigue crack propagation zone, and fatigue-transient fracture zone. Usually, the initial position of crack is in the stress concentration place and then expands. Because the increase in surface roughness causes the high stress concentration, the fatigue specimen fractures quickly.

Fracture pictures of the milled fatigue specimen: (a) morphology of fracture and (b) fatigue source zone.

Fracture pictures of the shot-peened fatigue specimen: (a) morphology of fracture and (b) fatigue source zone.
Figure 9(a) shows the morphology of fracture and Figure 9(b) shows the fatigue source zone for the milled fatigue specimen. Fatigue source locates in the lower-left corner of the fracture, and the fracture surface fluctuates greatly. The fatigue source locates at the sharp edge with higher stress concentration. The fatigue source presented the fan-shaped radioactive expansion; a lot of fatigue strips was found in the fatigue crack propagation zone; Much dimple morphology also was found in the fatigue transient fracture zone. Meanwhile, the fatigue-transient fracture zone area is relatively large, the degree of section undulating is also great. For these non-peened fatigue samples, the average fatigue life is about 5.2 × 10⁴ cycles.
Figure 10(a) shows the morphology of fracture and Figure 10(b) shows the fatigue source zone for the shot-peened fatigue specimen. It’s very interesting that the fatigue source locates in the subsurface, and the fracture surface is relatively flat. For these peened fatigue samples, the average fatigue life is about 1.2 × 10⁶ cycles. From Figure 10(a), it can be seen that the fatigue source zone of specimen is flat. In this small region, a lot of fatigue strips extend outward from the source of fatigue. In the case of amplification, more obvious fatigue stripes are parallel to each other, as shown in Figure 10(b).
Conclusion
First, we studied surface integrity and formation of metamorphic layer in high-speed milling 7055 aluminum alloy; 9 and then, we studied surface integrity and fatigue behavior in shot-peening for high-speed milled 7055 aluminum alloy; 19 now, we studied surface Integrity and fatigue analysis of shot-peening for 7055 aluminum alloy under different high-speed milling conditions. Shot peening process can reconstruct the microstructure and the hardened layer state of components. The surface integrity after peening has some particular characteristics as follows:
Under the same shot diameter and shot peening intensity, surface roughness is similar. Compared with milled surface, surface roughness increases significantly. Obvious plastic deformation appears on the peening specimen surface, and milling marks on the surface are difficult to identify. This is in agreement with our previous studies.
Shot peening process improves the consistency of the residual stress distribution in X and Y directions. Compared with the milling samples, the maximum residual compressive stress and depth of residual stress layer of the shot peening samples increased significantly.
The surface roughness is one of the factors to evaluate the fatigue performance of the specimen. Although surface roughness increased, it is not enough to influence fatigue properties. Shot peening process can identify the fatigue source location in subsurface and improve the fatigue life about 23 times than the milling process.
Footnotes
Academic Editor: Xichun Luo
Declaration of conflicting interests
The author(s) declared no potential conflicts of interest with respect to the research, authorship, and/or publication of this article.
Funding
The author(s) disclosed receipt of the following financial support for the research, authorship, and/or publication of this article: This work was supported by National Natural Science Foundation of China (Grant No. 51375393).