
Abstract
The influence of shot-peening parameters on surface integrity of 7055 aluminum alloy is investigated based on shot-peening experiments. Surface integrity measurements, fatigue fracture analysis and fatigue life tests are conducted to reveal the effect of surface integrity on crack initiation and fatigue life. The results show that surface roughness increases significantly, and irregular pits and bumps appear on surface after shot-peening; grain on subsurface is refined and produces a shift and distortion in the pellets hit direction; compressive stress can be detected on all machined surfaces. Shot-peening parameters have significant impact on micro-hardness. In comparison with the milled specimen, fatigue life of peened specimens is improved by about 23.8, 3.96 and 1.01 times. Fatigue source zone transfers from stress concentration location on surface to subsurface due to the lower surface roughness and lager residual compressive stress.
Introduction
High-strength aluminum alloys are widely used in aerospace, aviation and other areas due to their low density, high strength, strong resistance to corrosion and good processing properties. According to statistics, the amount of high-strength alloys in aircraft and engine structures accounts for the total weight of 70%−80%1,2 and is often used to fabricate main structures and bearing components. 7055 aluminum alloy, an outstanding representative of new high-strength aluminum alloy, has higher strength and fracture toughness than 7050 aluminum alloy.3,4 To meet the needs of aircraft weight and strength, 7055 aluminum alloy is widely used in the manufacture of aircraft skin, spars, bulkheads, stringers, landing gear and so on.
With rapid development of aviation industry and improvement of manufacturing level of aerospace structural parts in recent years, requirements of long life for aircraft, engines and other key components of equipment are growing. In order to improve the fatigue performance, generally, components will be strengthened after precision milling. Shot-peening (SP), as one of the main deformation strengthening technologies, can significantly improve fatigue life of parts by controlling surface integrity. Therefore, it is necessary to study surface integrity in SP and its effects on the fatigue life.
Many scholars conducted positive researches on surface integrity of machining for aluminum alloy material.5–8 Surface roughness and the distribution of residual stress along the depth, the mirco-structure and micro-hardness of strengthening layer were studied. To optimize machining parameters in end-milling 7055 alloy, orthogonal experiments were conducted to investigate the effects of parameters on surface integrity. 9 Meanwhile, many scholars found that SP-treated specimens made of precipitation hardened aluminum alloys showed better resistance to fatigue crack initiation by a factor of 1.2–6.10–12 An analysis of surface integrity after SP is important to provide optimum fatigue properties. Lv et al. found that the fatigue life of the corroded aluminum alloy specimens that were subject to SP was noticeably higher than the nonshot-peened counterpart. The compressive stresses induced on the surface by SP are beneficial for the purpose of enhancing fatigue life of the material. 13 Curtis et al. 14 studied the effect of controlled SP on fatigue damage of high-strength aluminum alloys and analyzed the performance of controlled SP on crack arrest and fatigue life. Trško et al. 15 investigated fatigue life of AW 7075 aluminium alloy after severe shot-peening treatment with different intensities and found that strong shot-peening intensity will cause the increase of number of initialed fatigue cracks. Žagar and Grum 16 investigated surface integrity after mechanical hardening of two types of aluminum alloys, EN AW 2007 and EN AW 6082, and found that the sharpest treatment conditions result in surface deformations which may cause cracks and subsequently lead to the mechanical part’s collapse. Zupanc and Grum studied surface integrity of shot-peened aluminum alloy 7075-T651 and confirmed an increase of fatigue strength after SP treatment due to the compressive residual stress ability to influence fatigue crack nucleation. They believe that the increasing resistance to plastic deformation and the residual stress profiles provided a corresponding fatigue crack closure. 17 Gao 18 and Trdan et al. 19 investigated surface modification of laser- and shot-peened for aluminum alloy.
Currently, most research on aluminum alloy focus on 7050 aluminum alloy. But this new alloy material 7055 aluminum alloy is rarely studied. There is little research on surface integrity and fatigue behavior for SP specimens after high-speed milling. Surface integrity and fatigue fracture for SP specimens after high-speed milling have not been analyzed comprehensively and systematically, especially lacking in the comparison of surface integrity between SP specimens and high-speed milling specimens. Based on 7055 aluminum alloy, the main objective of this investigation is to research surface integrity under different SP parameters and same high-speed milling conditions and surface integrity effects on fatigue life. SP experiments, surface integrity measurements and fatigue tests are conducted, which can provide test data for surface integrity control in 7055 aluminum alloy SP.
Experimental material and procedure
Workpiece material
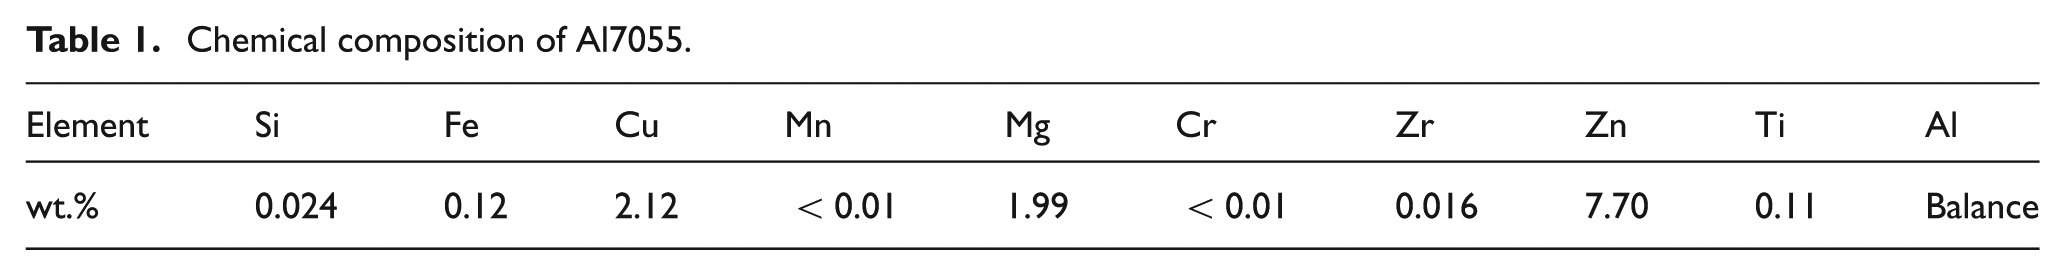
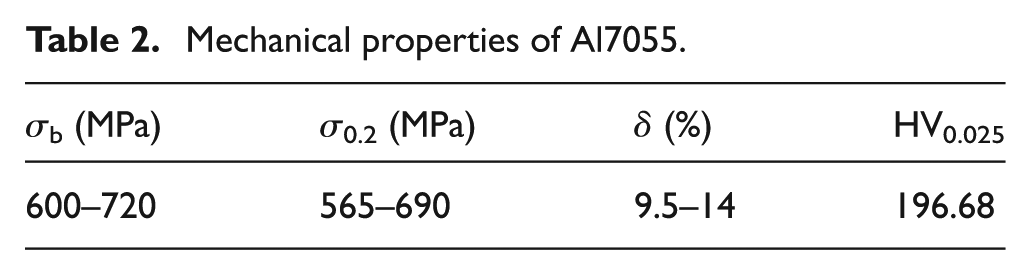
Workpiece material used in all experiments is 7055 aluminum alloy, one kind of high-performance Al-Zn-Mg-Cu aluminum alloys. The higher ratio of Zn-Mg and Cu-Mg and the addition of Zr improve the strength, fracture toughness and stress corrosion resistance properties of the alloy. Chemical compositions and mechanical properties of 7055 aluminum alloy are described in Tables 1 and 2.
Chemical composition of Al7055.
Mechanical properties of Al7055.
Experimental scheme
The dimension of 7055 aluminum alloy specimen is 30 mm × 20 mm × 10 mm. All specimens are machined on Mikron HSM 800 with the maximum spindle speed of 36,000 r/min. The three-flute uncoated cemented carbide end-milling cutter with 12 mm diameter is used by down-milling and end-milling. When machining, spindle speed n = 29,194 r/min, milling speed νc = 1100 m/min, feeding of each tooth fz = 0.04 mm, milling depth ap = 0.5 mm and milling width ae = 6 mm.
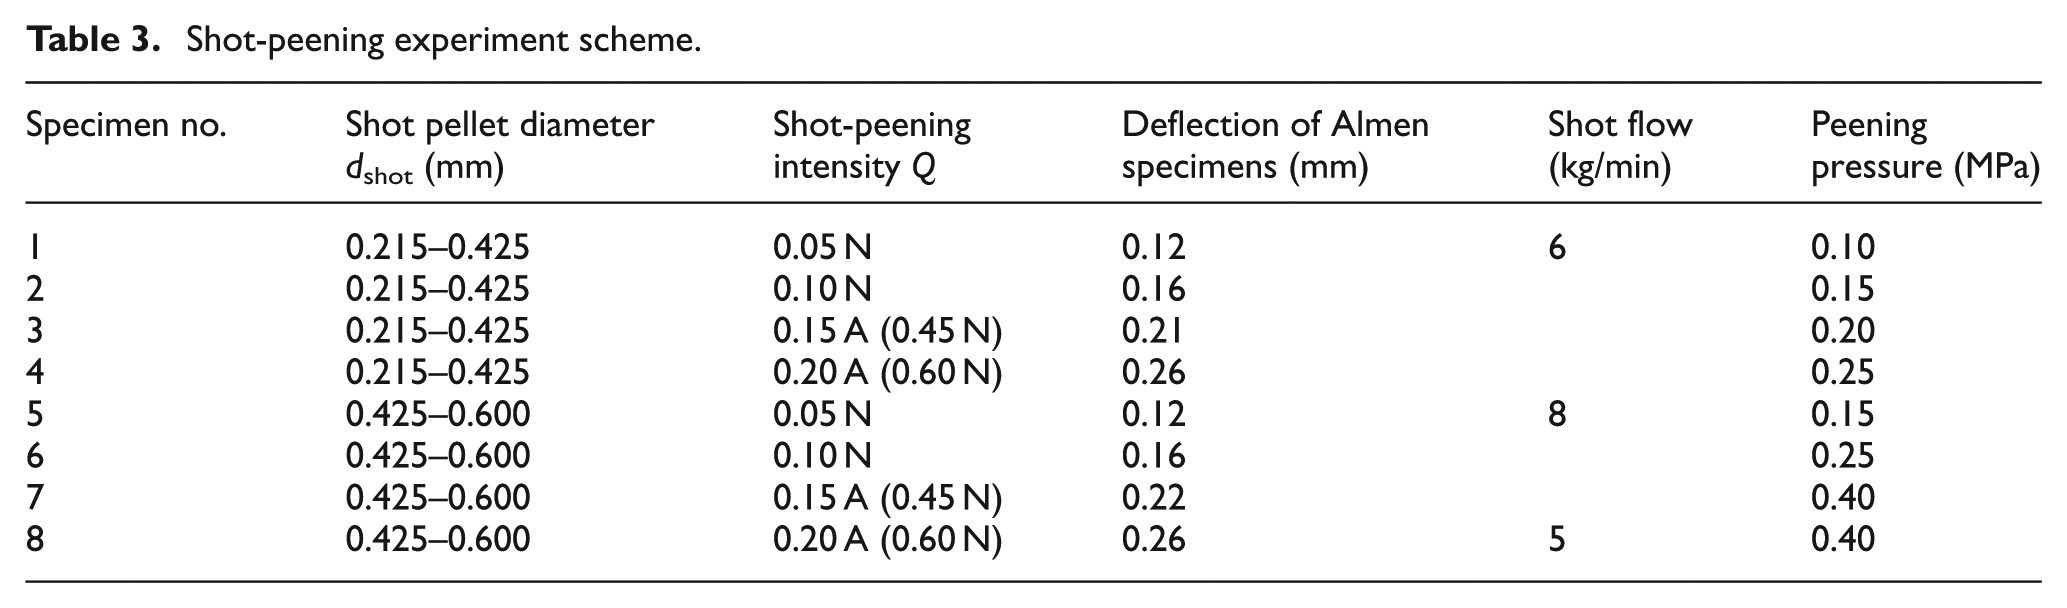
After machining all eight specimens, in order to study peening surface integrity, they are peened on the vacuum type of Wheelabrator MP4000 SP machine. SP uses ceramic pellets. Shot diameter is in the range of 0.215–0.600 mm. Incident angle is 45°. The intensity of SP is in the range of 0.05 mm N–0.2 mm A (3 N = A), and the deflection of Almen specimen is measured and denoted by s. The specific peening parameters for the eight samples are given in Table 3.
Shot-peening experiment scheme.
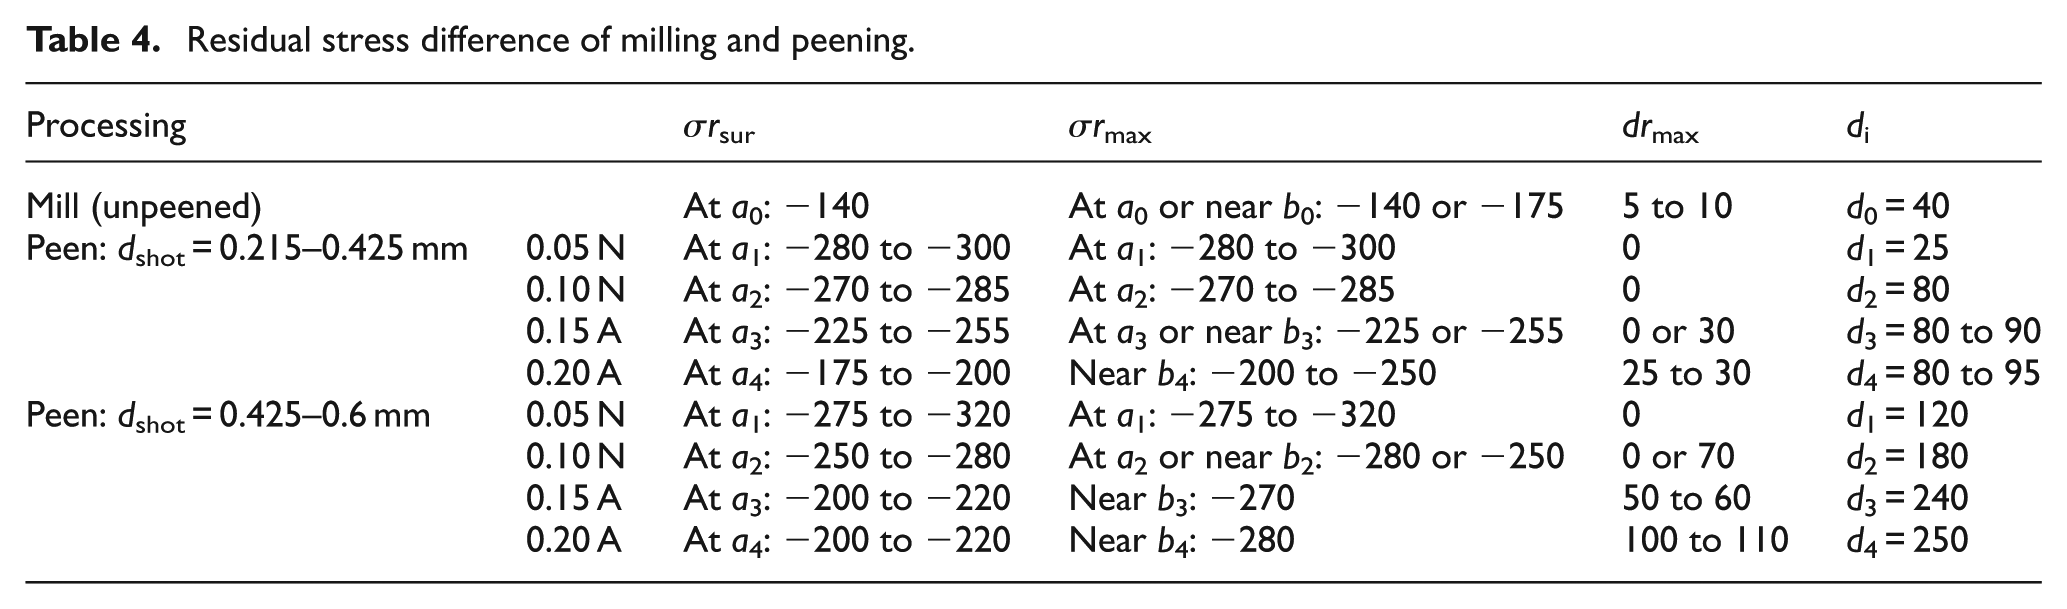
The geometry of the fatigue specimen (structural stress concentration factor Kt = 1) with the thickness of 3 mm is shown in Figure 1, where X direction is milling feed direction and Y direction is vertical milling feed direction, and both corresponding to the residual stresses σx and σy, respectively. With a sinusoidal loading wave, fatigue tests proceed in a QBG-20 high-frequency fatigue testing machine at room temperature. The loading frequency ranges from 85 to 87 Hz, the cycle stress ratio is 0.1 and the maximum nominal stress is 300 MPa. SP parameters of specimens 1, 4 and 8 in Table 4 are selected for the fatigue specimens.
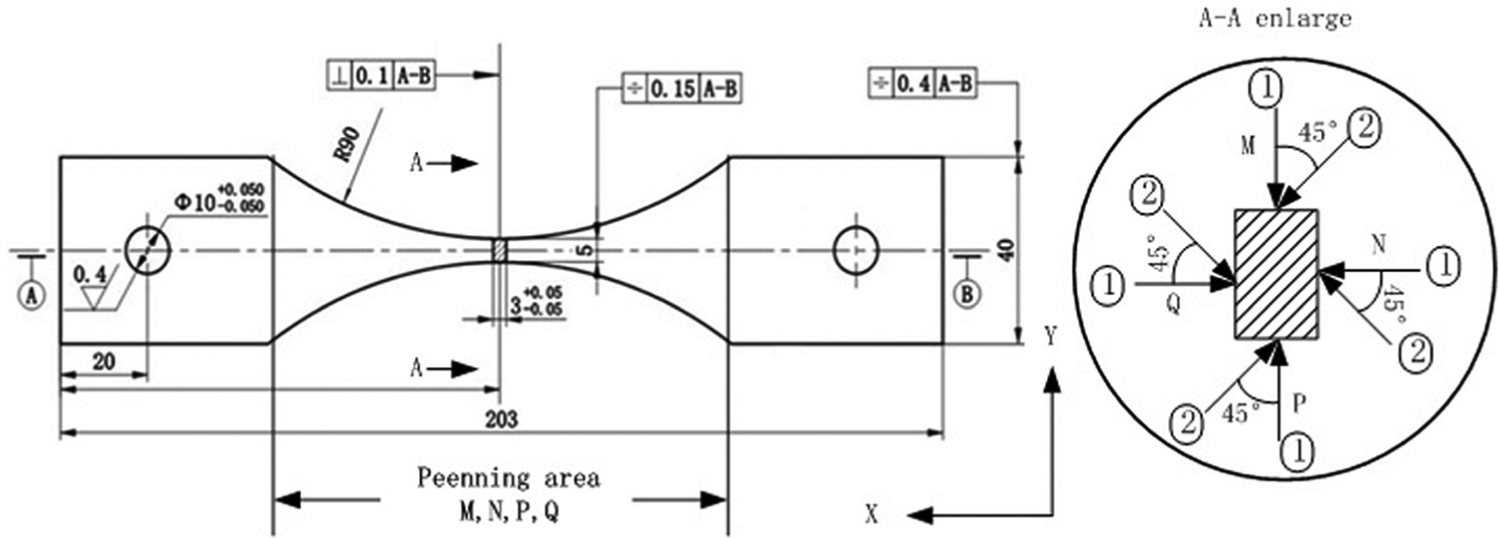
Geometry of fatigue specimen.
Residual stress difference of milling and peening.
Surface integrity testing
Testing method for surface integrity is very important. Surface integrity testing regions for peened surface are shown in Figure 2. For the sake of statistical significance of the repeatability, multiple measurements are made, and the average testing value is computed.
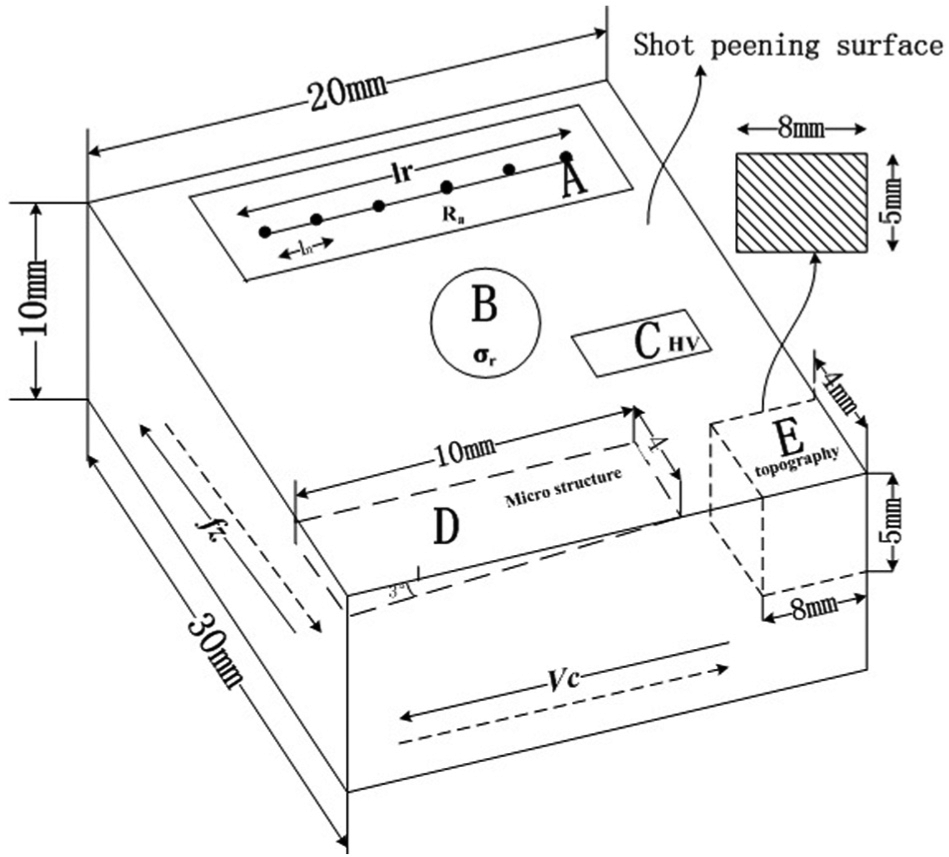
Surface integrity testing regions.
Surface roughness and topography
TR240 rough meter is applied to measure surface roughness choosing six points along the milling feed direction in region A on the machined surface. Each measuring point is tested six times and averaged for the sake of statistical significance of the measurements. Sampling length of measuring is 0.8 mm, and assessment length is 5.6 mm.
Surface topography is tested by Alicona Automatic optical test instrument in region E on the machined surface. When measuring, the magnification is set as five times, and the measuring range is set as 0.42 × 0.4 mm. Selecting a cross-sectional line on the test area of morphology, the maximum pit depth between peaks and valleys and pit diameter can be obtained.
Residual stress
The residual stress on workpiece is tested by PROTO LXRD MG2000 residual stress test system. Aluminum alloy block is used to calibrate the instrument before measurement. Three equidistant points in region B on the machined surface shown in Figure 2 are selected to test the residual stress. In order to obtain the residual stress distribution along the depth, specimens are stripped using electrochemical method, and the stripping depth is 5–10 µm. For specimens stripped, the residual stress is tested until close to the body’s residual stress.
Micro-hardness
Micro-hardness is tested using FEM-8000 semi-automatic digital micro-hardness testing system. Test force is set as 25 gf, and time of keeping load is set as 6 s in the testing process. The selected five equidistant points in region C on the machined surface are set to test the micro-hardness. In order to obtain the micro-hardness distribution in the depth direction, the specimen is mounted in embedded machine. Then, coarse grinding, precise grinding and polishing are done to measure the material micro-hardness. Micro-hardness is measured once by moving 5–10 µm under the surface until close to the body’s hardness.
Microstructure
The metallographic test sample is made through cutting specimen and is shown as region D. Then, the cutting section is corroded after abrading and polishing; The corrodent is matched as HCl:HNO3:HF:H2O = 3:5:2:100. Microstructure of cutting section is observed with TESCAN MIR3XMU field emission scanning electron microscopy (SEM).
Effects of SP parameters on surface integrity
Surface topography and roughness
Surface roughness of eight pieces of high-speed milled samples can almost be controlled in Ra = 0.26 µm, and three-dimensional (3D) surface topography of the milled sample is shown in Figure 3 with the clearly machined surface texture. Surface topographies of 1–8 peened workpieces under different peening parameters in Table 4 are shown in Figure 4. From Figures 3 and 4, due to the impact of the projectile and extrusion in peening, the specimen surface produces obvious plastic deformation and forms pits with different diameters and depths. Pit diameter and depth are also different under different SP parameters. The milling mark has been difficult to identify.
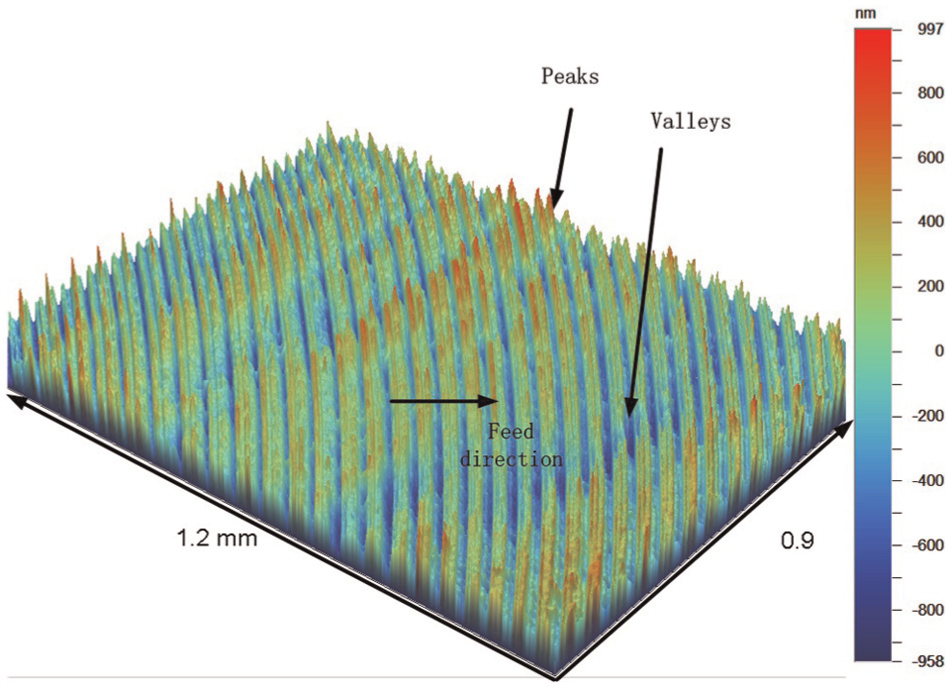
3D surface topography of milled 7055 alloy (Ra = 0.26 µm).
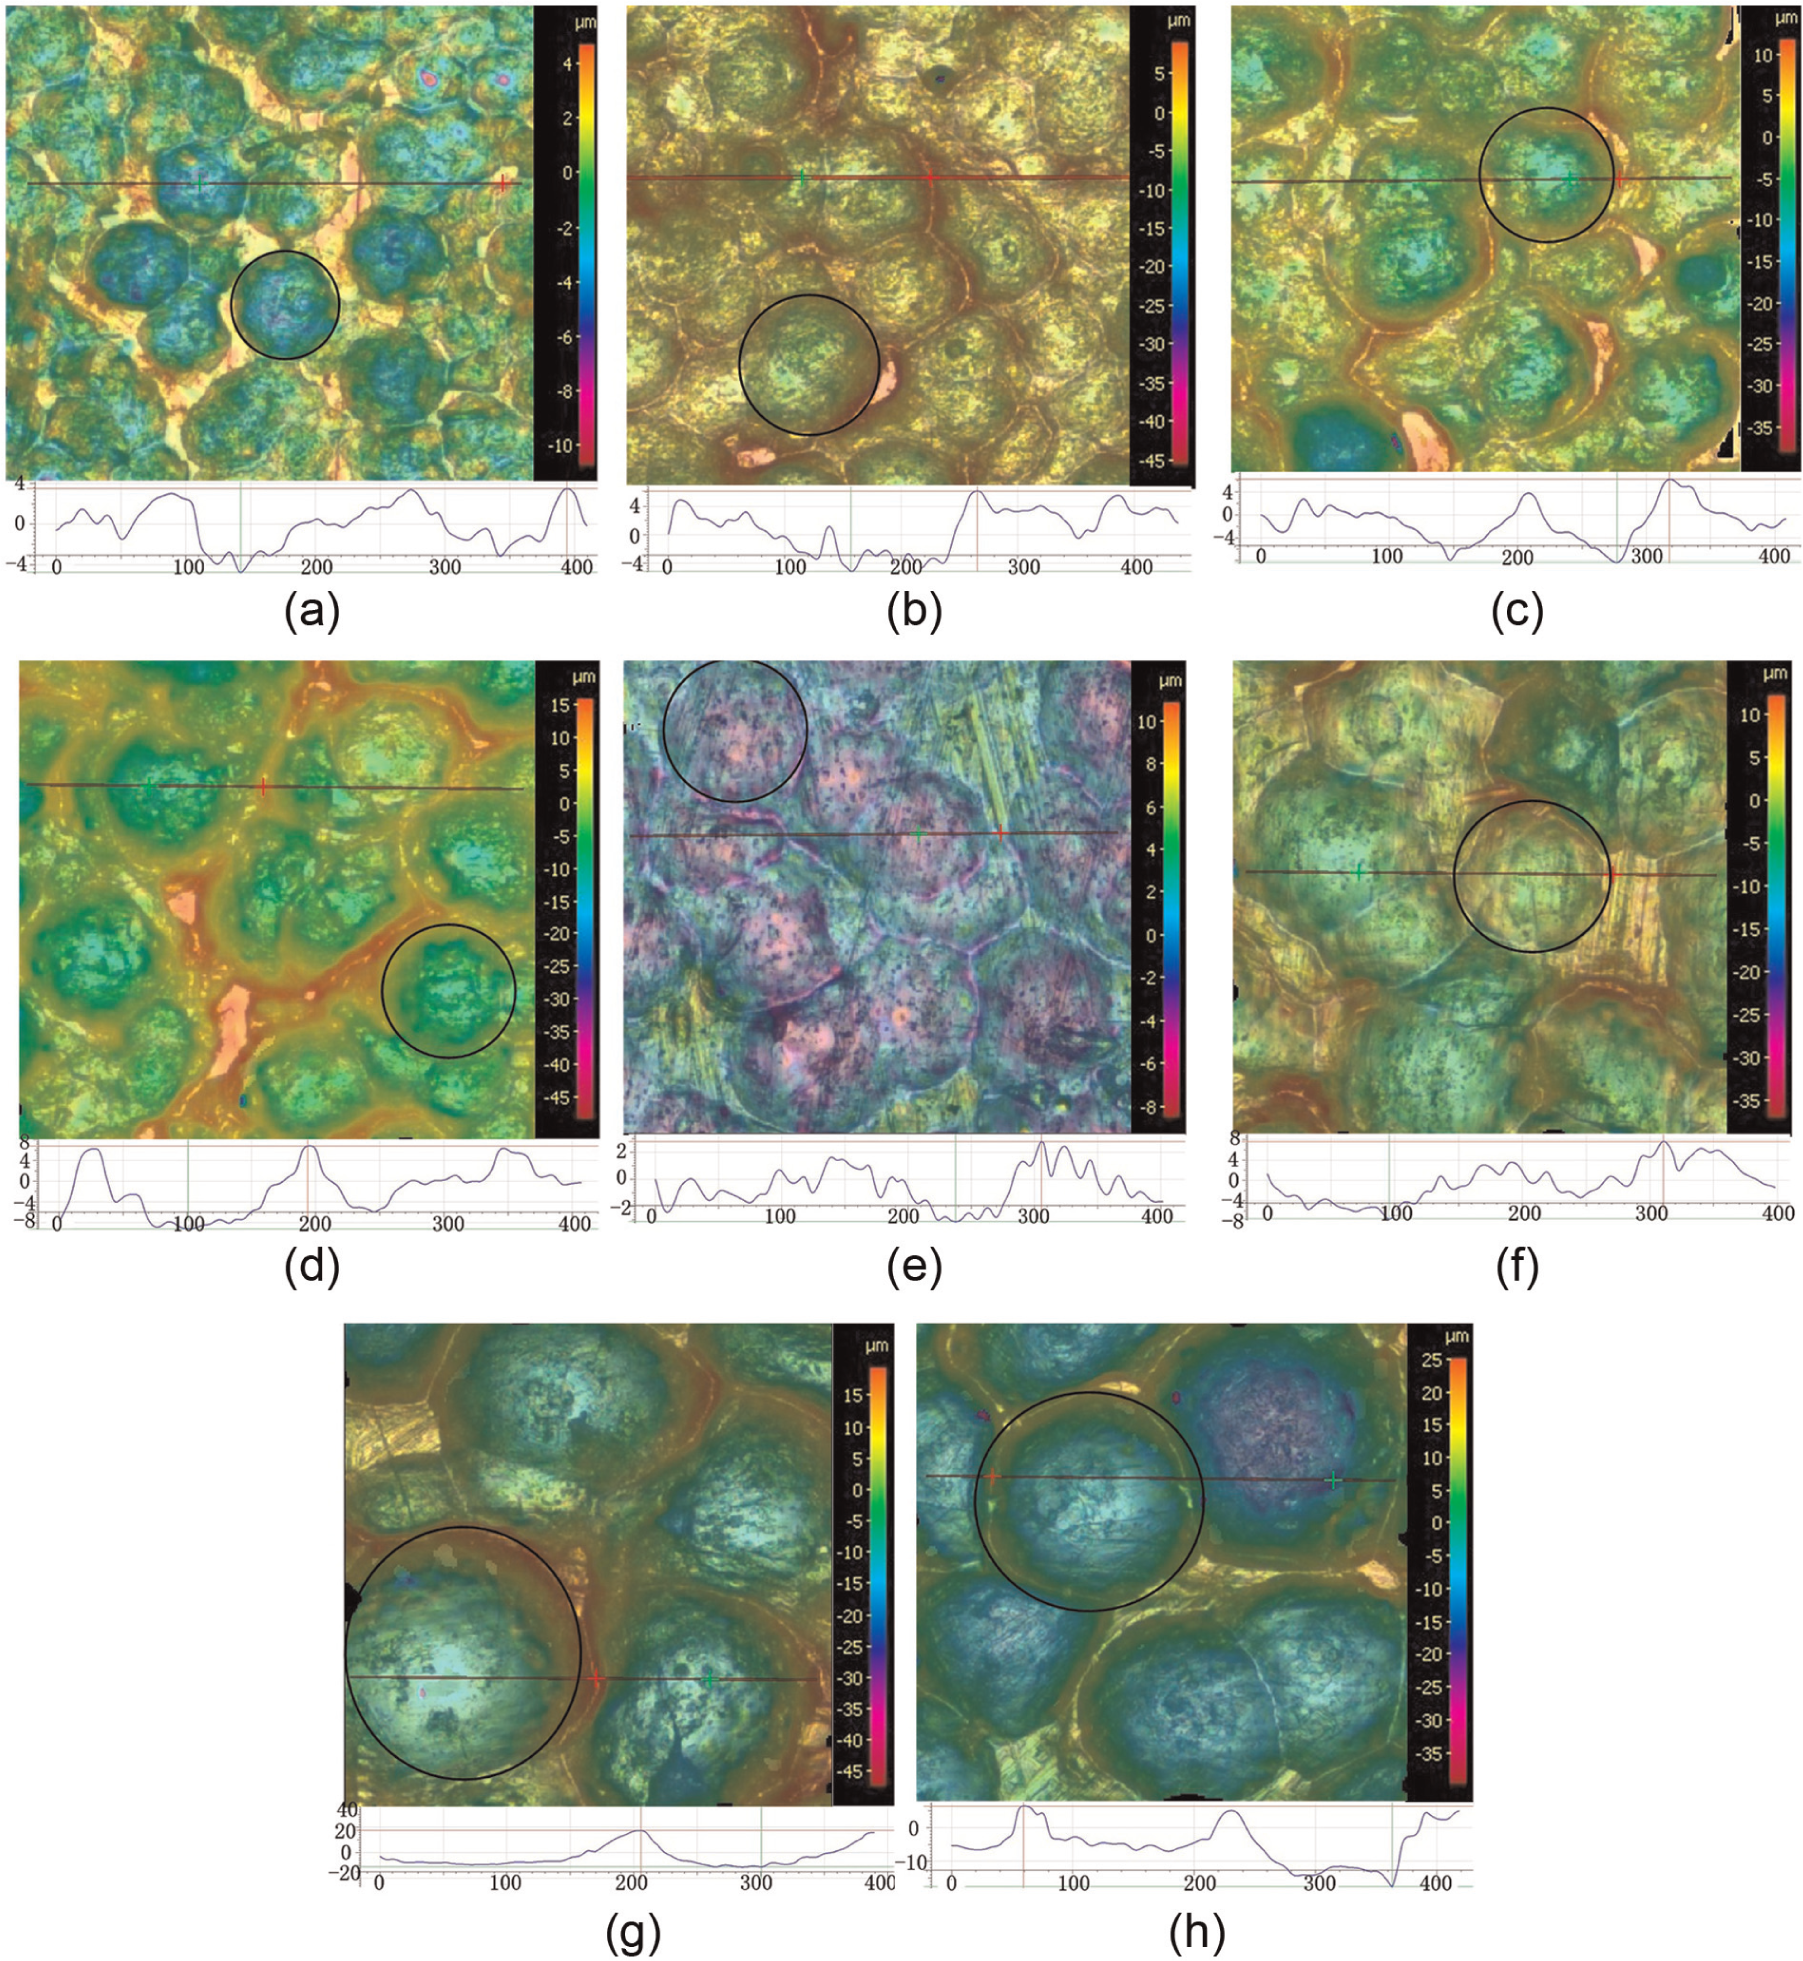
Surface topographies after shot-peening with different parameters: (a) specimen 1 (Ra = 1.22 µm), (b) specimen 2 (Ra = 1.95 µm), (c) specimen 3 (Ra = 2.80 µm), (d) specimen 4 (Ra = 3.91 µm), (e) specimen 5 (Ra = 1.72 µm), (f) specimen 6 (Ra = 3.33 µm), (g) specimen 7 (Ra = 4.85 µm) and (h) specimen 8 (Ra = 5.76 µm).
Figure 4(a)–(d) shows surface topographies under different SP intensities when shot diameter is in the range of 0.215–0.425 mm. Pit depth and diameter gradually increase with increasing SP intensity. Pit distribution becomes sparse, and surface roughness gradually increases. As SP intensity increases from 0.05 to 0.1 mm N, pit depth increases from 8.3 to 11.4 µm, pit diameter increases from 90 to 120 µm and surface roughness increases from Ra = 1.22 to 1.95 µm. When SP intensity increases from 0.15 to 0.2 mm A, pit depth increases from 14. 6 to 16.1 µm, pit diameter increases from 110 to 130 µm and surface roughness increases from Ra = 2.80 to 3.91 µm.
Figure 4(e)–(h) shows surface topographies under different SP intensities when shot diameter is in the range of 0.425–0.6 mm. Surface morphology change laws are almost the same with those in Figure 4(a)–(d). But pit depth and diameter gradually become bigger. Pit distribution becomes more sparse, and surface roughness becomes larger.
In comprehensive contrast of Figure 4(a) and (e), (b) and (f), (c) and (g) or (d) and (h), it can be seen that pit depth decreases from 4.7 to 3.2 µm, and pit diameter increases from 0.09 to 0.15 mm when SP intensity is 0.05 mm N and shot diameter increases from 0.215–0.425 to 0.425–0.6 mm. Pit depth and diameter increase with increasing shot diameter when SP intensity is 0.10 mm N, 0.15 mm A and 0.20 mm A, respectively. Figure 5 shows that surface roughness of peened specimens increases with increasing shot diameter. When shot diameter increases from 0.215–0.425 to 0.425–0.6 mm at 0.20 A SP intensity, surface roughness increases from Ra = 3.91 to 5.76 µm.
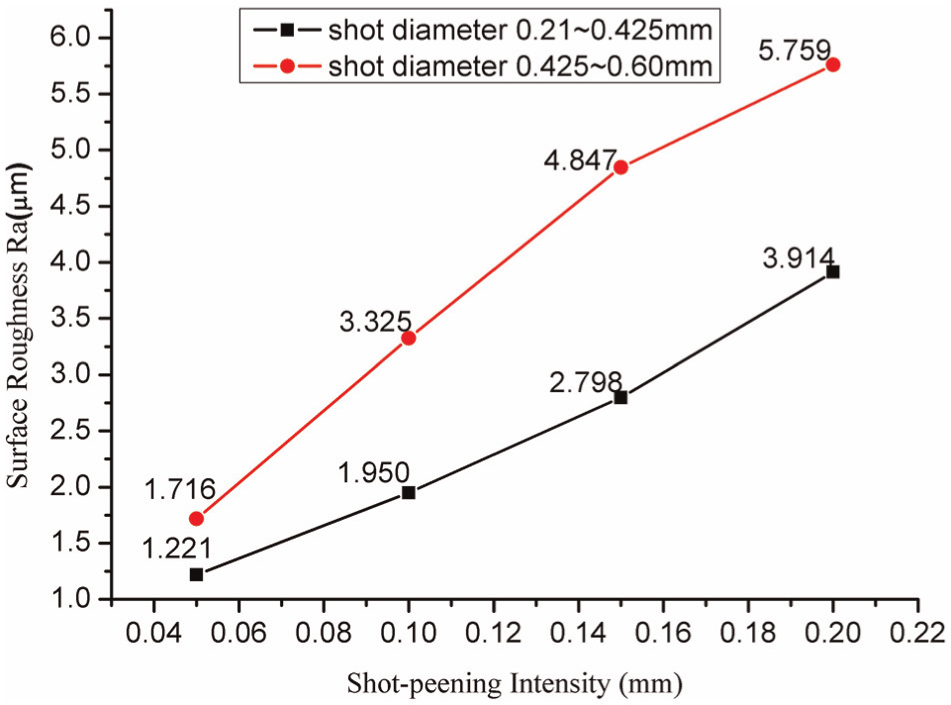
Effects of shot-peening parameters on surface roughness.
Residual stress
Residual stress distribution along the depth of peened and milled specimens in different SP parameters is shown in Figure 6. From Figure 6, the residual stress distribution curves of σx and σy along the depth of the unpeened, namely, milled specimen, can be found. So, for the unpeened specimen, the residual stress increases from the lower surface stress to the maximum residual compressive stress at the point, 5 µm below the surface. Then, the residual stress gradually decreases to the body’s stress. The residual compressive stress layer depth of the unpeened specimen is about 40 µm.
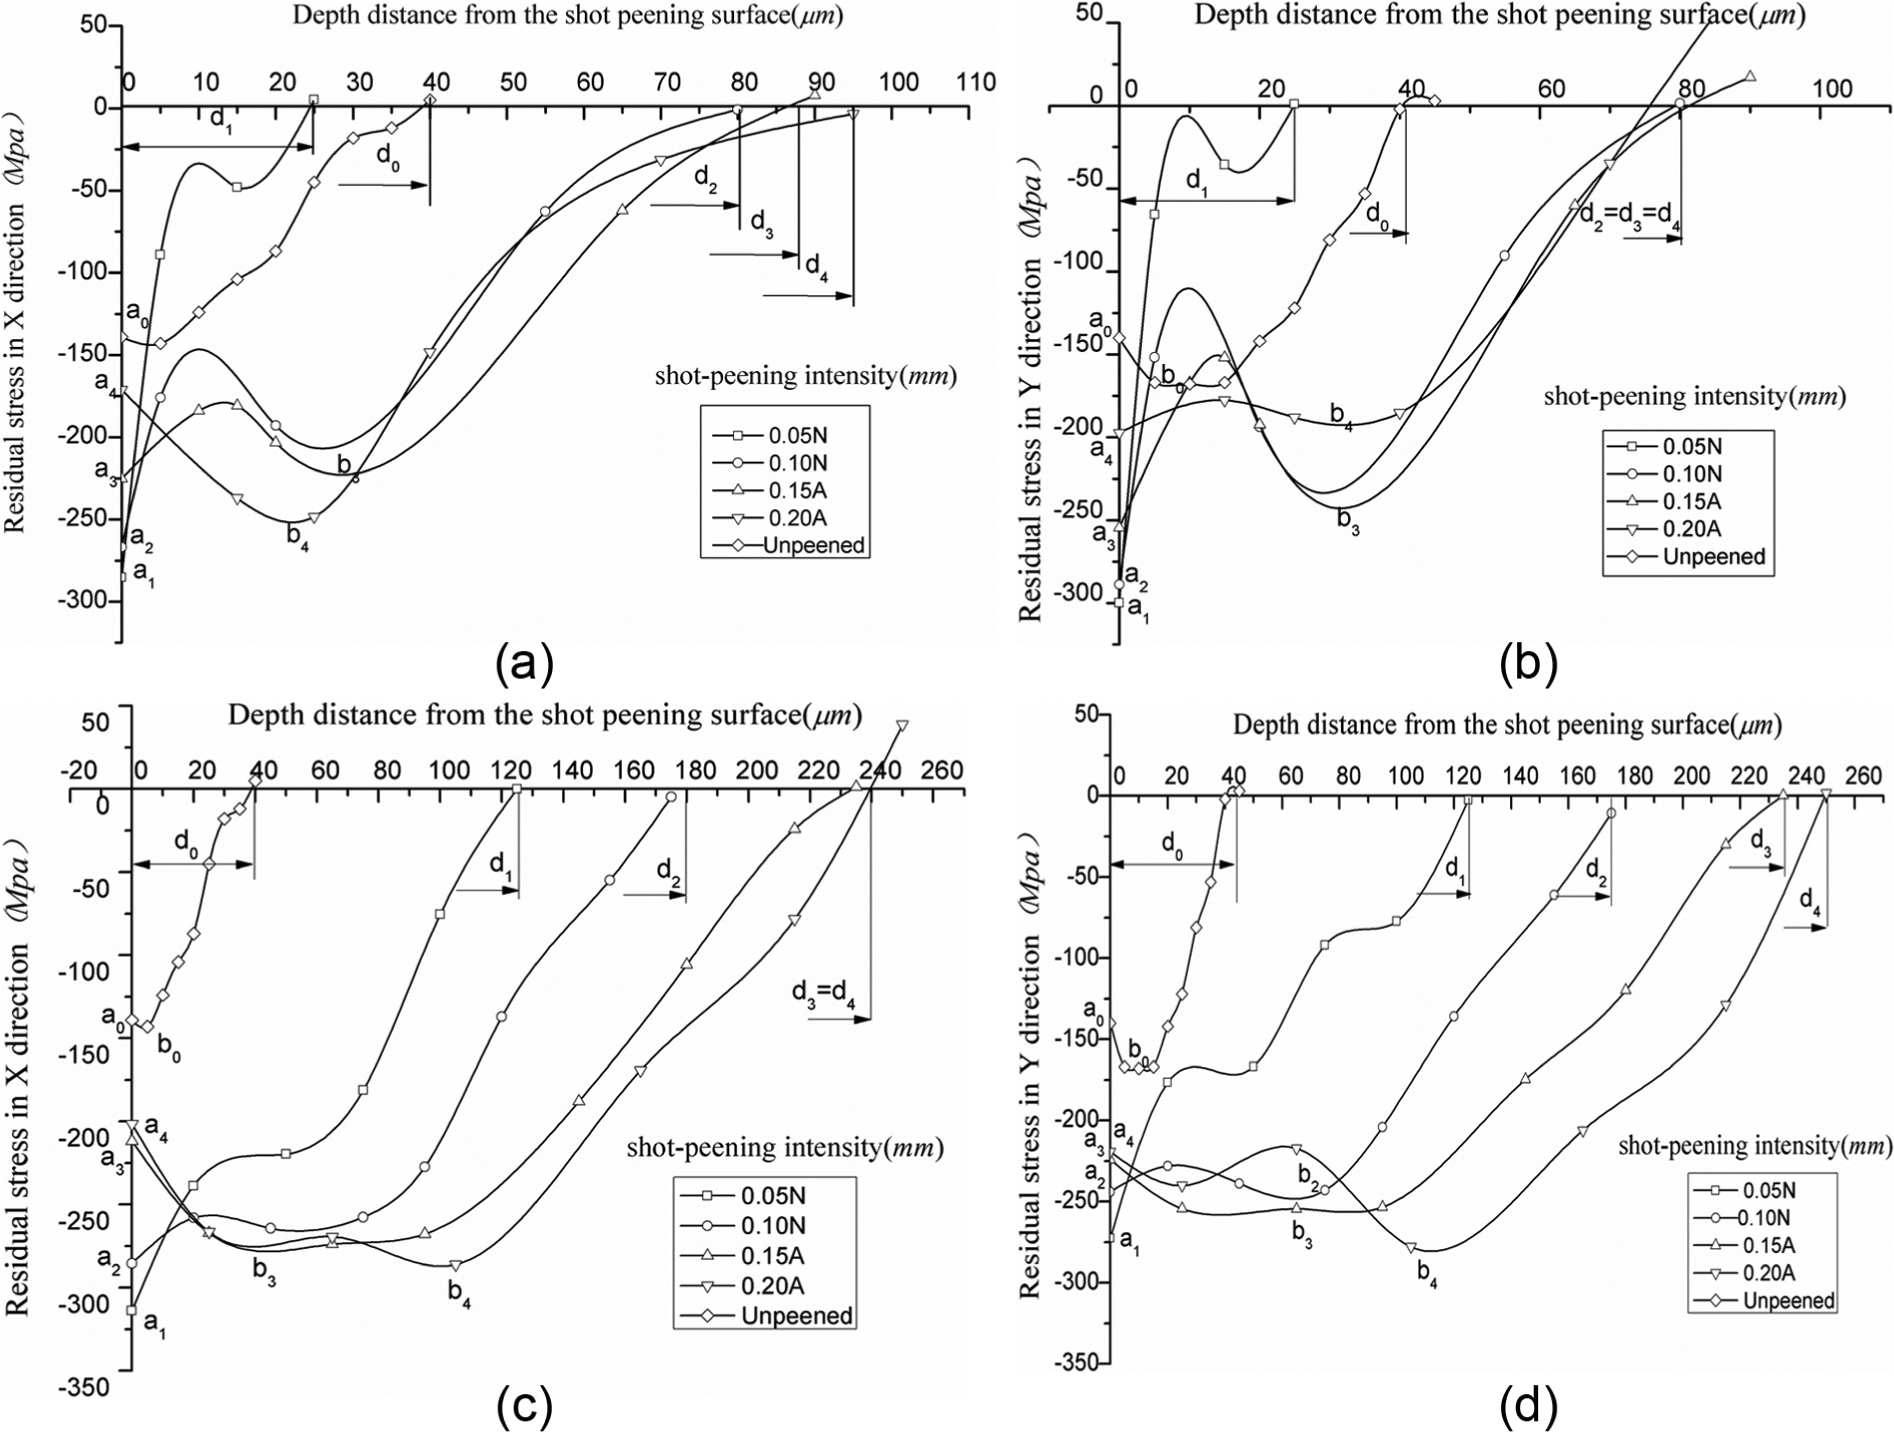
Residual stress distribution along the depth in different shot-peening parameters: (a) dshot = 0.215–0.425 mm, (b) dshot = 0.215–0.425 mm, (c) dshot = 0.425–0.6 mm and (d) dshot = 0.425–0.6 mm.
Residual stress distribution is different under different manufacturing conditions. The difference is shown in Table 4 from the residual stress on surface, the maximum residual stress and the depth of residual stress layer, where a0, a1, a2, a3 and a4 are the locations of σrsur on Figure 6 and b0, b1, b2, b3 are b4 are the locations of σrmax on Figure 6.
From Figure 6 and Table 4, when SP intensity increases from 0.05 mm N to 0.2 mm A, the distributions of σx and σy along the depth have the following rules:
Residual stresses are all compressive stresses. From Figure 6(a), the variation trends of residual stress distribution are almost the same when SP intensity is 0.05 mm N, 0.10 mm N and 0.15 mm A. It decreases from the machined surface to the subsurface at the depth of 10–15 µm first, forming bump point, and then increases and forms concave point; it decreases until it is converted to the body’s stress at a depth of 25, 80 and 80–90 µm, respectively. Figure 6(b) shows that variation of σx is almost the same with that of σy. When the SP intensity is 0.20 mm A, residual stress distribution is relatively different from others.
From Figure 6(a) and (b), with increasing SP intensity, both σrsur and σrmax decrease, the location of σrmax changes from the surface to the subsurface and the depth of residual stress layer di increases from d1 = 25 µm to d4 = 80–95 µm. When SP intensity increases from 0.05 mm N to 0.20 mm A, σrsur decreases from −280 to −300 to −175 to −200 MPa and σrmax also decreases from −280 to −300 to −200 to −250 MPa. These differences may be resulted by the different maximum plastic deformation locations in SP. When the SP intensity is small, the maximum plastic deformation occurs at the near surface, so the maximum residual stress appears on the surface. But for the larger SP intensity, the maximum plastic deformation may occur at the subsurface where the maximum compressive residual stress occurs, rather than at the surface. For the dshot = 0.425–0.6 mm, shown in Figure 6(c) and (d), these differences are more obviously same as the dshot = 0.215–0.425 mm besides σrmax. So, when changing the SP intensity from small to large, the residual stress distribution on subsurface will change, and the surface residual stress σrsur does not express the overall reaction by peening intensity change.
With increasing SP intensity, from Figure 6(a) and (b), σrmax decreases obviously from −280 to −300 to −200 to −250 MPa, and the location of σrmax changes from the surface to the subsurface. From Figure 6(c) and (d), the decrease of σrmax is not obvious from −275 to −320 to −280 MPa, but the location of σrmax changes obviously from the surface to the subsurface about 100–110 µm under surface.
When SP intensity is the same, the larger the pellet diameter, the greater the depth of residual compressive stress layer. When SP intensity is 0.05 mm N, and shot diameters are in the ranges of 0.215–0.425 and 0.425–0.600 mm, the depths of residual compressive stress layer are 25 and 120 µm. These may be resulted by the maximum plastic deformation location. When the shot diameter is small, the maximum plastic deformation occurs at the near surface, and the maximum residual stress appears on the surface. So, the depth of the residual compressive stress layer is very small, but the maximum residual compressive stress is greater. When the shot diameter is larger, the maximum plastic deformation occurs at the subsurface, and the maximum residual stress appears under the surface. So, the depth of the residual compressive stress layer is greater, but the maximum residual compressive stress is not greater.
Micro-hardness
Figure 7 shows the micro-hardness distribution along the depth for milled specimens and shot-peened specimens shown in Table 4. From Figure 7, the micro-hardness distribution along the depth of the unpeened, namely, milled specimen can be found. For the unpeened specimen, the micro-hardness on surface is less than on the body material, and it increases from the minimum micro-hardness about 178 HV0.025 to the body material’s micro-hardness. So, milling has the subsurface softening effects caused by force and temperature in milling process.
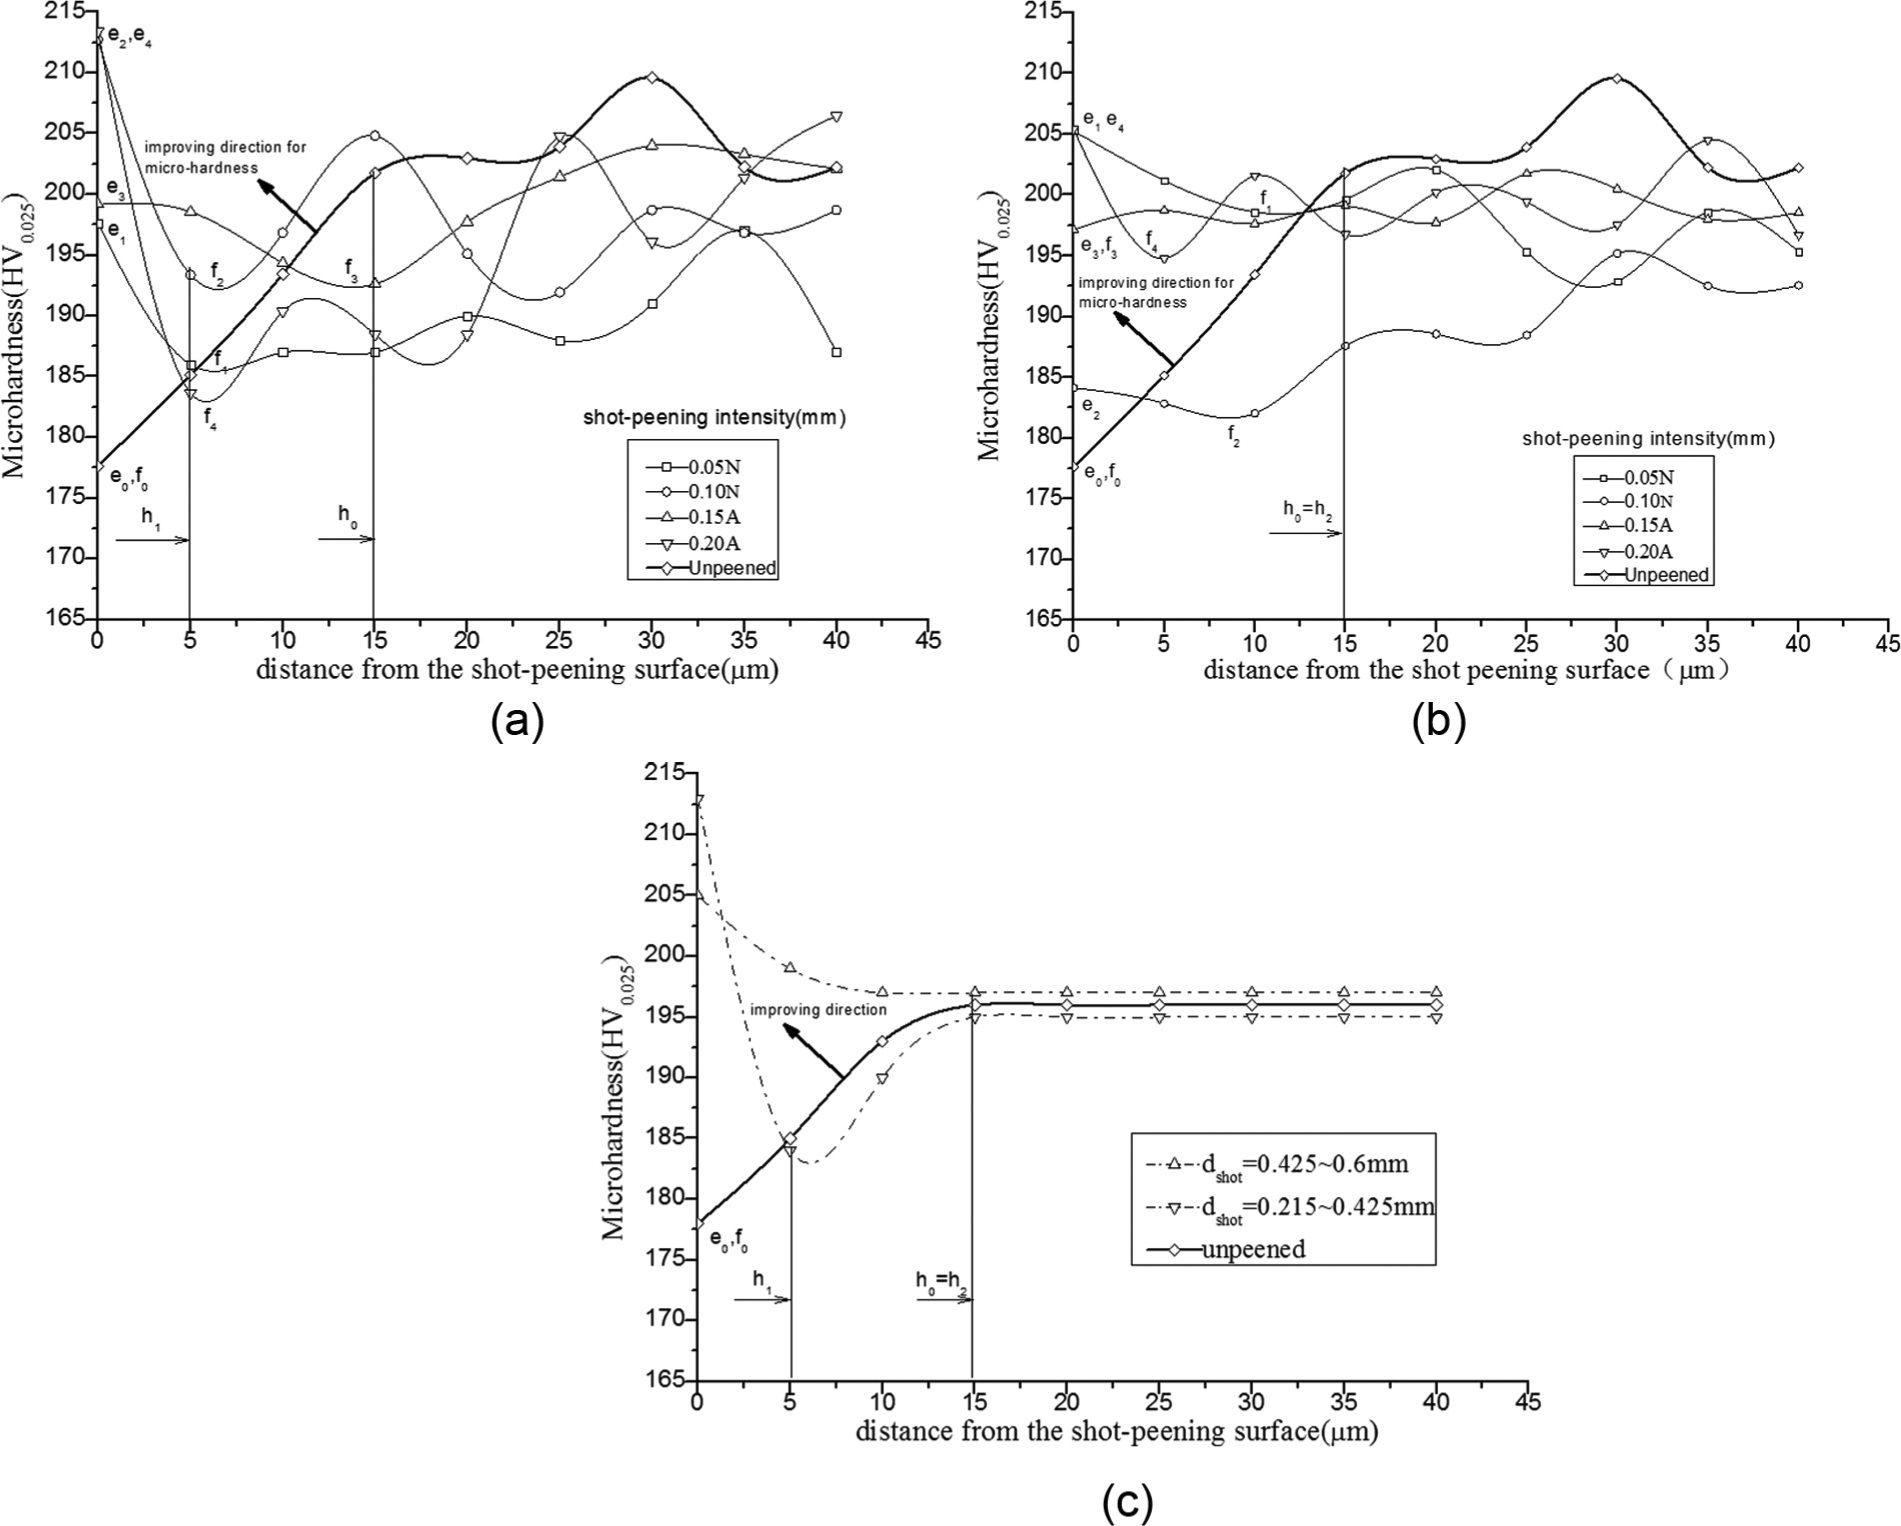
Micro-hardness distribution along the depth in different shot-peening parameters: (a) dshot = 0.215–0.425 mm, (b) dshot = 0.425–0.6 mm and (c) reconstruction law of micro-hardness distribution.
From Figure 7, comparing the micro-hardness distributions of different peening conditions and milling conditions, the following results can be obtained:
In the range of experimental parameters, the peening has impact on the micro-hardness distribution, and hardening phenomenon is obvious. From Figure 7(a) and (b), when shot diameters are same and SP intensities are different, the micro-hardness distributions are consistent. For dshot = 0.215–0.425 mm, surface micro-hardness is about 198–213 HV0.025; for dshot = 0.425–0.6 mm, surface micro-hardness is about 185–205 HV0.025. Surface micro-hardness of peened specimens is larger than 178 HV0.025, surface micro-hardness of the milled specimen. Peening can eliminate subsurface softening effects caused by milling and improve micro-hardness distribution of subsurface for good direction.These are mainly because large stress and strain are produced at the near surface when peening.
When shot diameters are different and SP intensities are same, micro-hardness distributions are different. First, surface micro-hardness of peened specimens at e1, e2, e3 and e4 locations of Figure 7(a) (dshot = 0.215–0.425 mm) is larger than micro-hardness at e1, e2, e3 and e4 locations of Figure 7(b) (dshot = 0.425–0.6 mm). Second, for dshot = 0.215–0.425 mm, the curves of micro-hardness distributions have the maximum micro-hardness on surface (at e1, e2, e3 and e4 locations), the minimum micro-hardness on subsurface (at f1, f2, f3 and f4 locations) and then go up to micro-hardness of body material. These changes are very obvious. Third, for dshot = 0.425–0.6 mm, curves of micro-hardness distributions have the maximum micro-hardness, whose locations are not necessarily all on surface (such as micro-hardness at e2 and e3 are smaller than the micro-hardness of body material), and the minimum micro-hardness on surface (at f3 location) or subsurface (at f1, f2 and f4 locations) and then go up to the micro-hardness of body material. These changes are not obvious. These are because the strain rate on near surface produced by dshot = 0.215–0.425 mm is larger than by dshot = 0.425–0.6 mm. When using the same SP intensity, the smaller the dshot, the larger the velocity, and this produces larger strain rate near surface.
When shot diameters are same and SP intensities are different, with the increasing SP intensity, the larger the velocity, the larger the strain rate produced on near surface. This leads to the larger micro-hardness on surface. For dshot = 0.215–0.425 mm, from Figure 7(a), not considering 0.15 A, when SP intensity is 0.05 N, 0.10 N and 0.20 A, micro-hardness on surface (at e1, e2, e4 location) increases as 197, 212 and 213HV0.025, respectively. For dshot = 0.425–0.6 mm, from Figure 7(b), not considering 0.05 N, when SP intensity is 0.10 N, 0.15 A and 0.20 A, micro-hardness on surface (at e2, e3, e4 location) increases as 184, 197 and 205 HV0.025, respectively. According to statistics law, this is reasonable to some extent.
Comparing Figure 7(a) and (b), by statistics, Figure 7(c) shows reconstruction laws of micro-hardness distribution of different dshot. For dshot = 0.215–0.425 mm, not considering SP intensity, the depth of micro-hardness layer is about 15 µm, same as h0, but the reconstruction depth of micro-hardness layer after peening, namely, h1, is only about 5 µm. The subsurface softening effects caused by milling cannot be eliminated completely. For dshot = 0.425–0.6 mm, not considering SP intensity, the depth of micro-hardness layer is also about 15 µm, same as h0, and the reconstruction depth of micro-hardness layer after peening, namely, h2, is about 15 µm. Obviously, larger dshot produces larger reconstruction depth of micro-hardness layer, because larger dshot brings stress and strain on deeper depth than smaller dshot. So, peening by larger dshot can more likely eliminate subsurface softening effects caused by milling.
Microstructure
Figure 8 shows the microstructure of the high-speed milled specimen. It reveals that plastic deformation depth near the machined surface is not obvious with about 3 µm in milling direction of νf. Grain on subsurface layer presents long and thin strips. Microstructures of peened specimens are shown in Figure 9. It shows that phase transition does not occur after SP. This is mainly due to the fact that heat generated by SP is not sufficient to make phase transition. Grain on subsurface changes to slender strips and produces a shift and distortion in the direction of the pellets impacting.
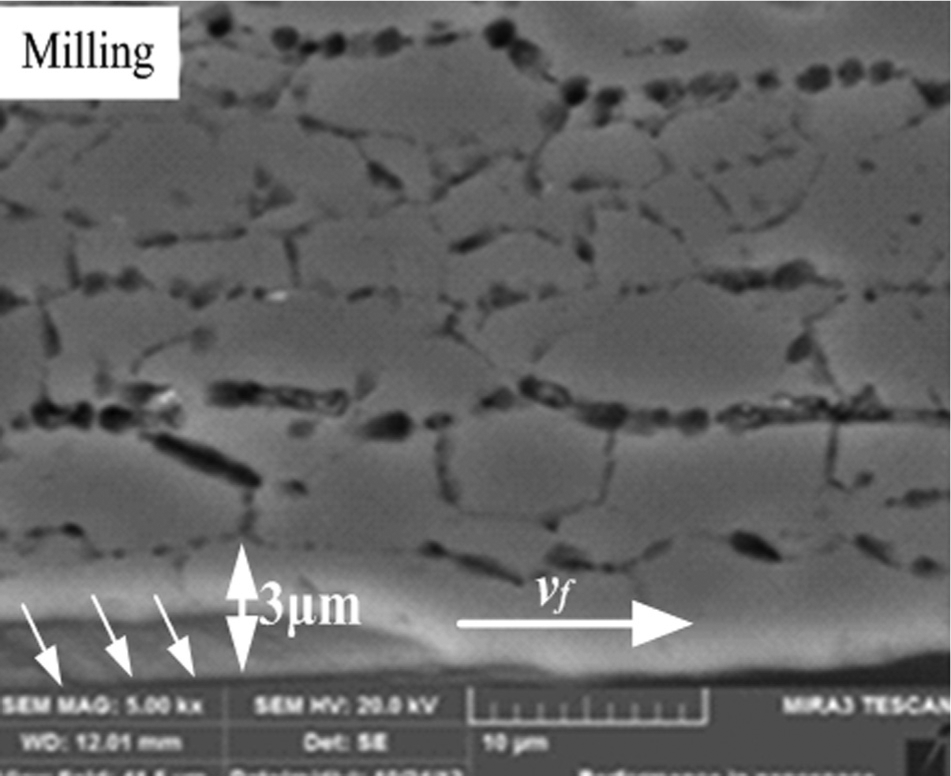
Microstructure of milling specimen.
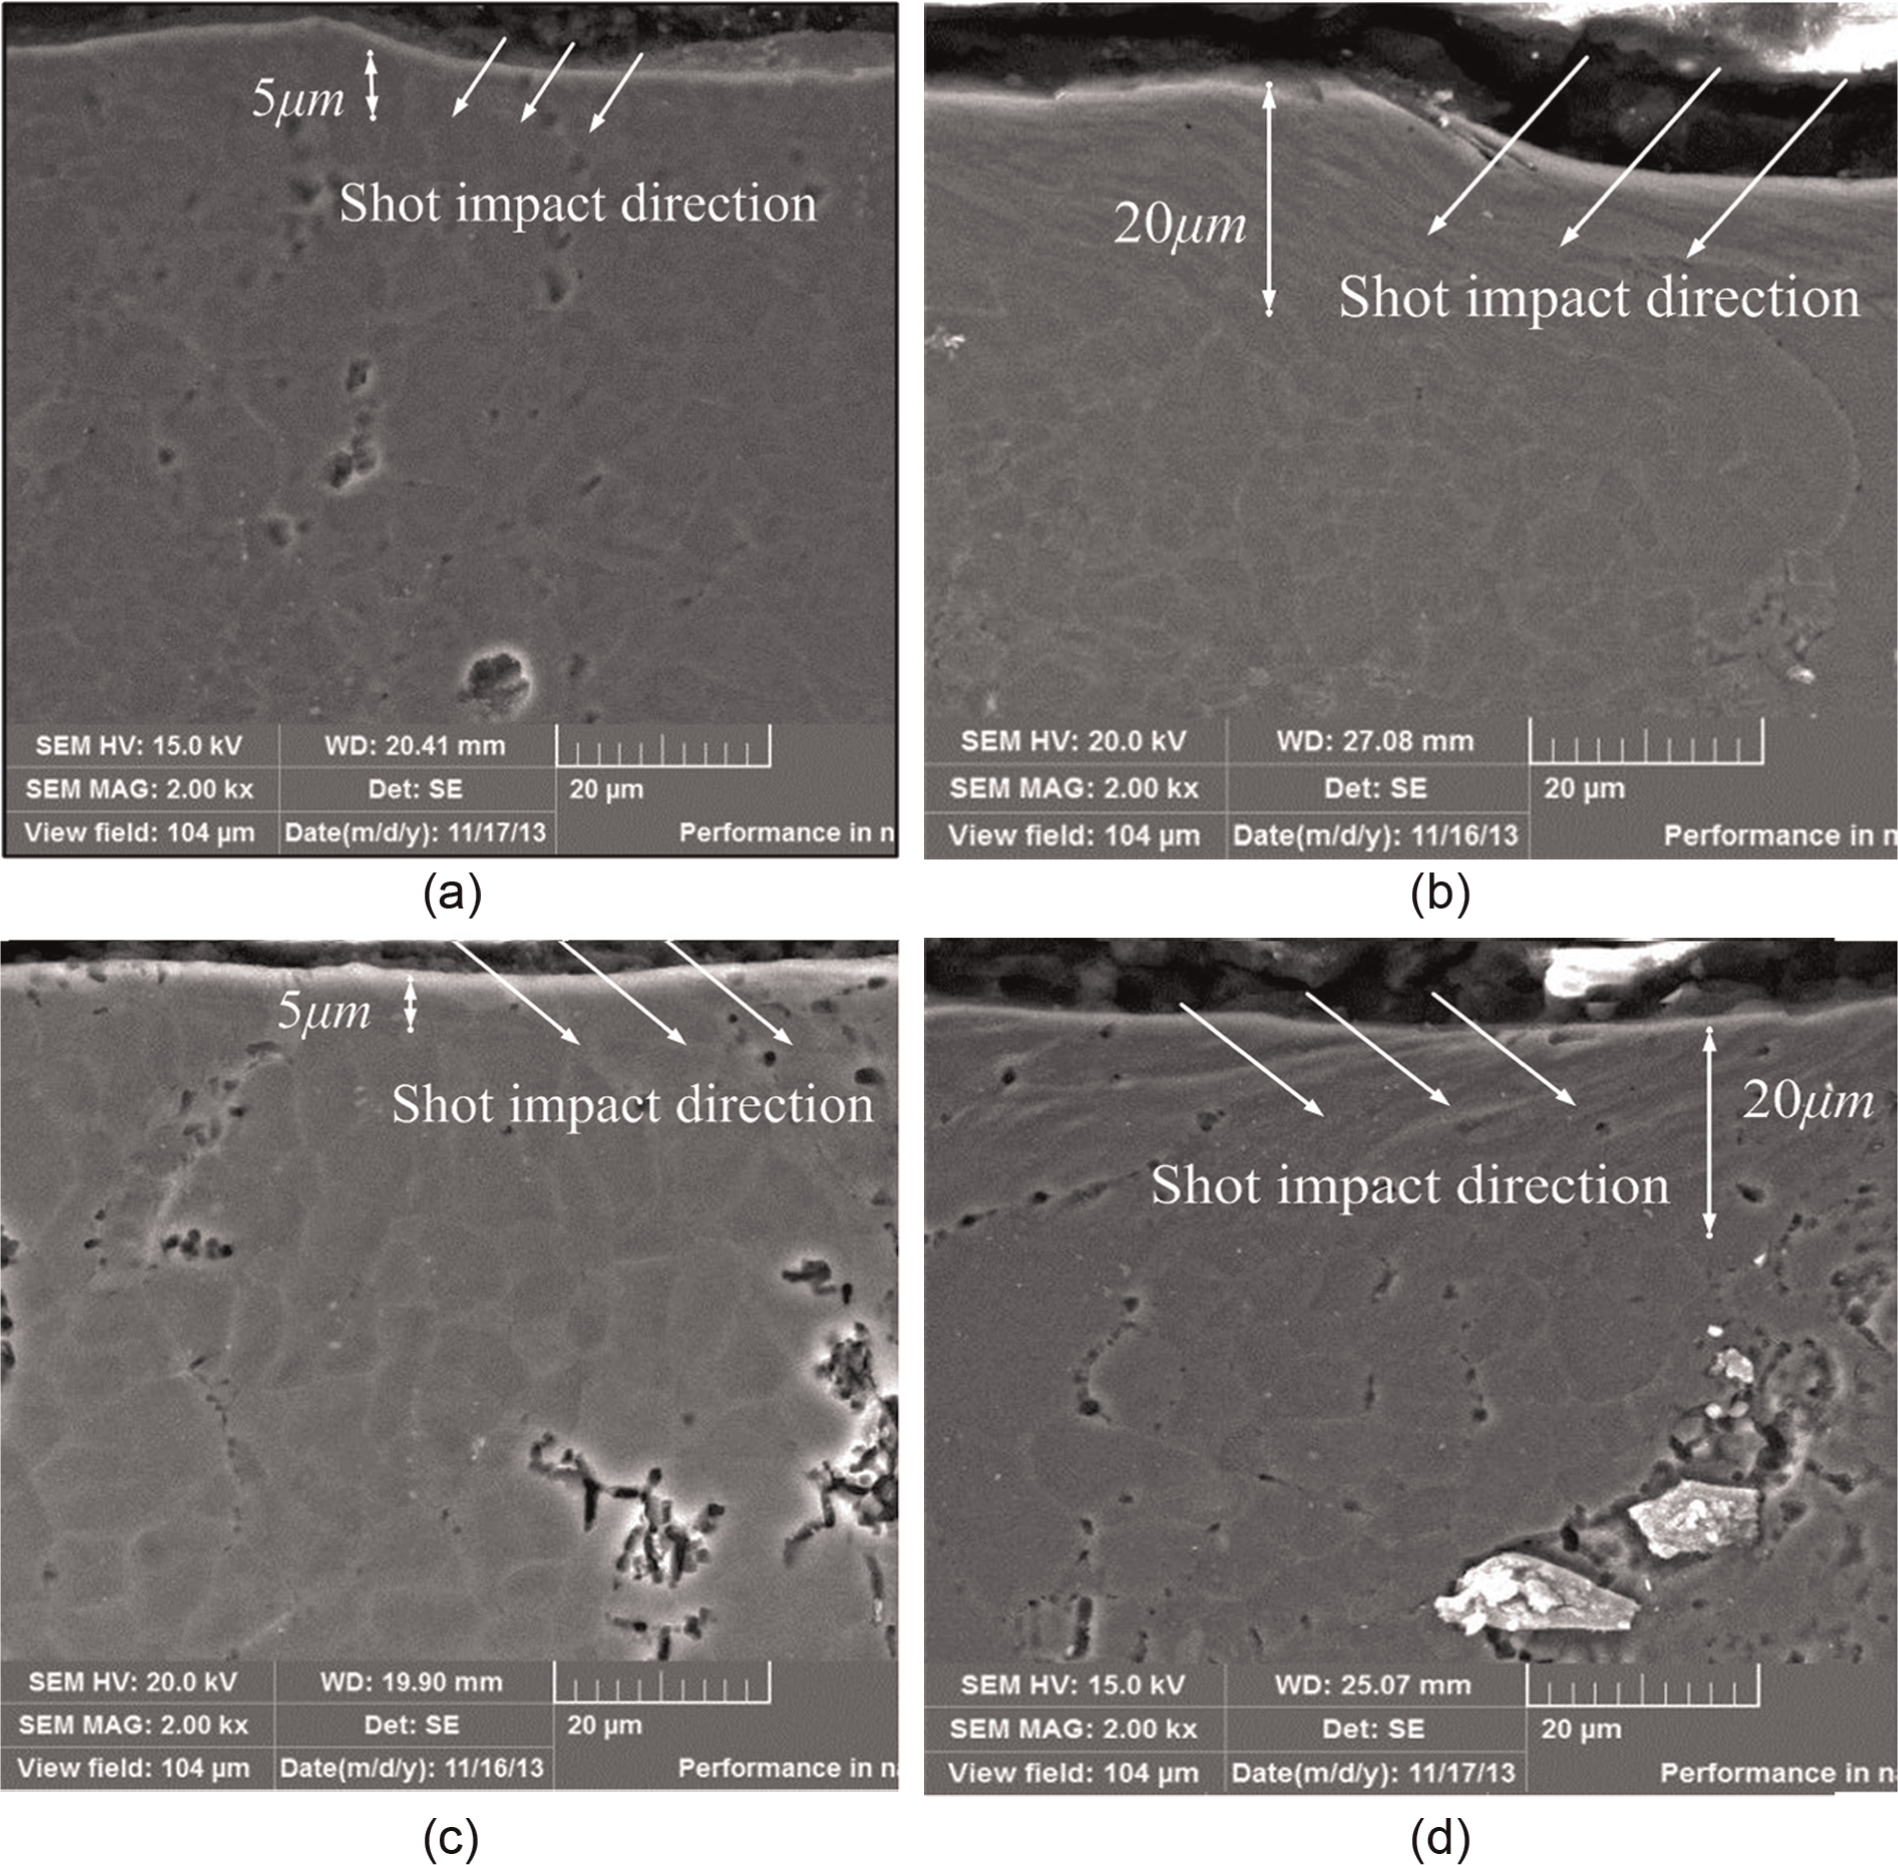
Microstructure in different shot-peening parameters: (a) specimen 1, (b) specimen 4, (c) specimen 5 and (d) specimen 7.
Comparing Figure 9(a) and (c), the depths of plastic deformation layer of specimens 1 and 5 are about 3–5 µm. And from Figure 9(b) and (d), the depths of plastic deformation layer for specimens 4 and 7 are about 20 µm. So, lower SP intensity resulted in smaller plastic deformation on the peened subsurface because of the pellet’s small force on the material. Visibly, when the SP intensity is small, the plastic deformation layer on the peened subsurface is same as that of the milled. Larger SP intensity resulted in obvious plastic deformation on the peened subsurface because of the pellet’s larger force. Therefore, the effect of SP intensity on the microstructure is more significant than that of shot diameter. The larger the SP intensity, the higher the pellet’s kinetic energy, and the stress and strain are more serious.
Effects of mechanism of surface integrity on fatigue life
Influence rules of surface integrity on fatigue life
Figure 10 shows the comparison of fatigue life of peened and milled specimens under different levels of processing. Fatigue life of peened specimen is larger than that of milled specimen. Fatigue life of milled specimen is 5.18 × 10⁴. Fatigue life of the peened specimens 1, 4 and 8 is 1.25 × 10⁶, 2.05 × 10⁵ and 5.25 × 10⁴, respectively. Compared to the milled specimen, fatigue life of peened specimens 1, 4 and 8 is improved by 23.8, 3.96 and 1.01 times, respectively.
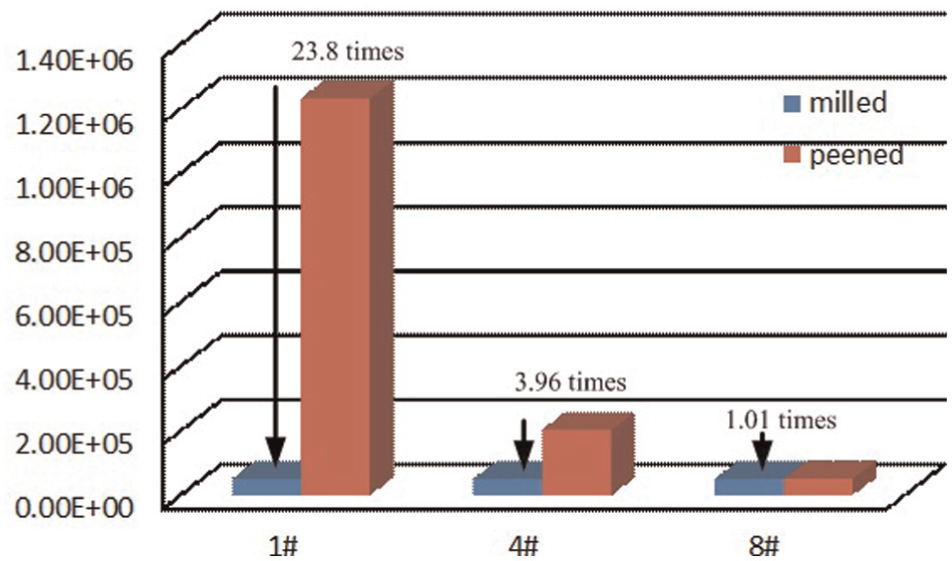
Fatigue life comparison of peened and milled specimens.
The loadings are same for all peened and milled fatigue specimens, but fatigue life varies so much. From the views of previous research, fatigue life of the workpiece is affected by surface roughness, residual stress, micro-hardness and microstructure. From the microstructure of Figure 9, SP makes subsurface plastic deformation and brings grain fibrosis. As usual, fibrous grain on subsurface improves fatigue life. This phenomenon leads to strain hardening and reconstruction of residual stress on subsurface. Therefore, main reasons of different fatigue life are analyzed from three main aspects: surface topography, residual stress on subsurface and micro-hardness. Surface integrity of milled specimens 1, 4 and 8 is shown in Table 5. So, some main influence rules of surface integrity on fatigue life can be obtained:
Surface integrity and fatigue life.
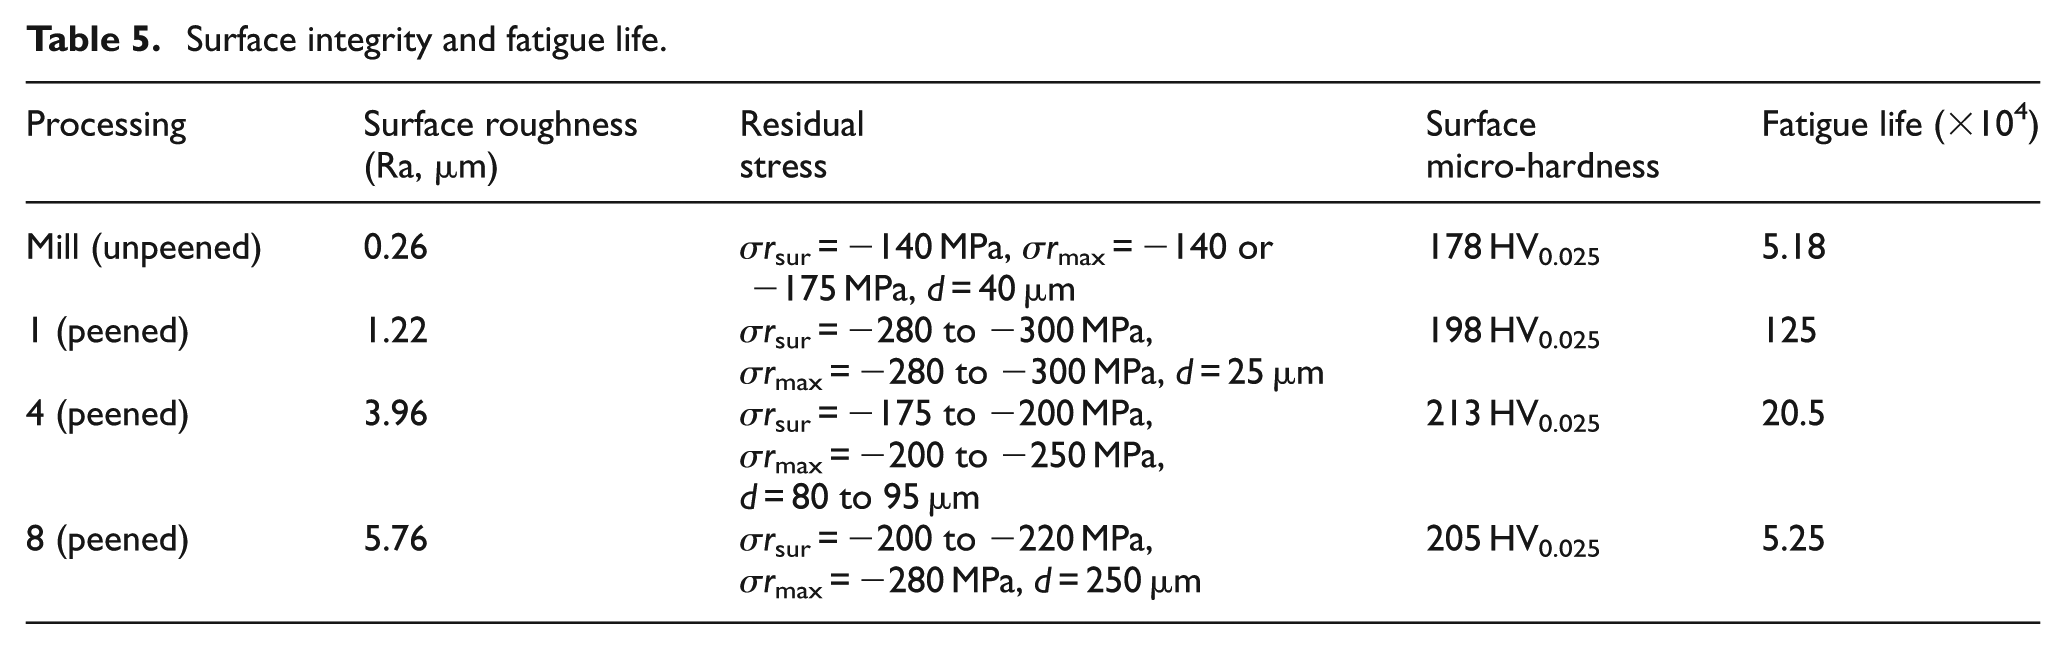
Generally, the smaller the surface roughness, the longer the fatigue life. But comparing the shot-peened specimen with the milled specimen, although the surface roughness increases significantly after SP, fatigue life of peened specimen is higher than milled specimen. Surface roughness of specimen 8 is Ra = 5.76 µm, and surface roughness of milled specimen is Ra = 0.26 µm. The surface roughness is increased by nearly 22 times, but the fatigue life is very similar. So, the surface roughness is not sufficient to reflect the impact on fatigue life. The residual stress distributions and micro-hardness changes on metamorphic layer have more important impacts on the fatigue life.
The surface roughness is comprehensive effects of surface geometry status on the fatigue properties. Comparing surface topography of four specimens, from view of surface stress concentration, the smaller the radius of curvature of the valley bottom, the more prominent the stress concentration. So, the valley bottom curvature radius of the surface topography cannot be ignored. Figure 11 shows the surface topography and valley bottom curvature radius for these four fatigue specimens. Peening process can change the valley bottom state of the surface texture. But since machining marks left by tools are small, smaller pellets in SP can almost cover all machining marks. Smaller pellets slightly increase surface roughness and can improve the valley bottom state of the surface texture. Larger pellets will not only severely increase surface roughness but also cover a little machining marks. It cannot improve the valley bottom state of the surface texture. Therefore, the smaller shot pellets are better to reduce the stress concentration effect. For these four fatigue specimens, the radii of curvature of the valley bottom are 33.9, 34, 26.7 and 17.3 µm. So, fatigue life of specimen 1 is the largest among fatigue specimens due to lower surface roughness, the largest curvature radius of valley bottom and other changes on metamorphic layer.
The fatigue life of a component is a combined result of many factors rather than any one factor of surface integrity. As can be seen from Table 5, the fatigue life of peened specimen 1 is the highest. When comparing high-speed machining specimens and shot-peened specimens, fatigue life of shot-peened specimen has increased. This is due to the combined effects of surface integrity. Despite the high-speed machining specimens with a small surface roughness (Ra = 0.26 µm), shot-peened specimens had a poor surface roughness (larger than Ra = 1.22 µm); however, shot-peened specimens had better surface residual stress distribution and surface hardening than high-speed machining specimens seen in Table 5.
Generally, SP treatment confirmed an increase of fatigue strength due to the compressive residual stress and surface hardening. Larger surface residual compressive stress can make larger reducing amplitude for the load, and surface hardening can increase resistance to plastic deformation. When comparing shot-peened specimens 1 and 8 seen in Table 5, for specimen 1, σrsur = −280 to −300 MPa, σrmax = −280 to −300 MPa, d = 25 µm and surface micro-hardness is 198 HV0.025; for specimen 8, σrsur = −200 to −220 MPa, σrmax = −280 MPa, d = 250 µm and surface micro-hardness is 205 HV0.025. Although σrmax of specimen 1 is close to specimen 8, the depth of compressive residual stress of specimen 1 is far less than specimen 8, surface micro-hardness of specimen 1 is less than specimen 8, and fatigue life of specimen 1 is higher than specimen 8. Although SP cannot bring much more micro-hardness change for subsurface like other hardening processes, its effects on fatigue life cannot be ignored. By comprehensive comparison, specimen 1 has the largest fatigue life, and the main mechanism of surface integrity is having several features simultaneously: the smaller surface roughness, the largest curvature radius of valley bottom, the better micro-hardness distribution and the highest surface residual compressive stress.
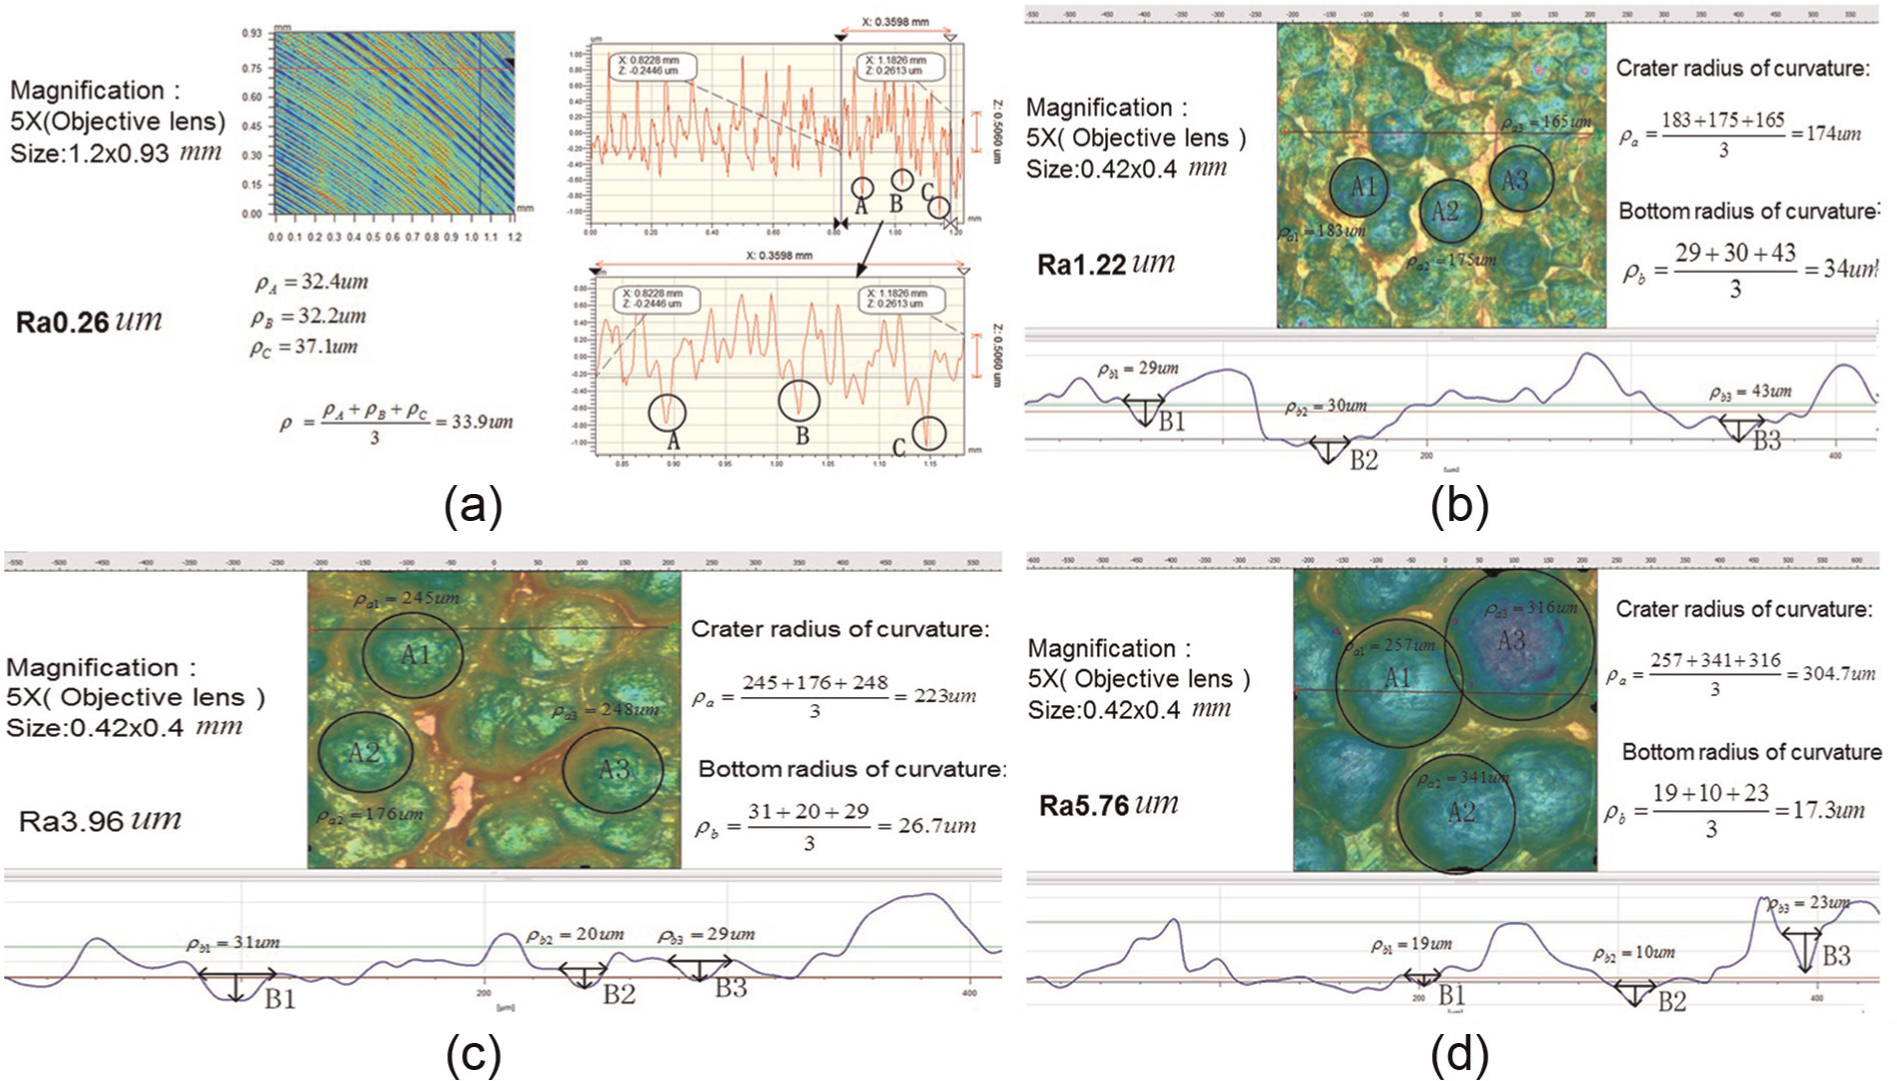
Surface topography and bottom curvature radius: (a) milled specimen, (b) specimen 1, (c) specimen 4 and (d) specimen 8.
Fatigue fracture analysis
The fracture morphology of peened fatigue specimen with different surface integrity characteristics is observed to investigate the initiation and growth of fatigue crack under high-cycle fatigue loading. Figures 12 and 13 show the fracture scanning pictures of specimens 1 and 4.
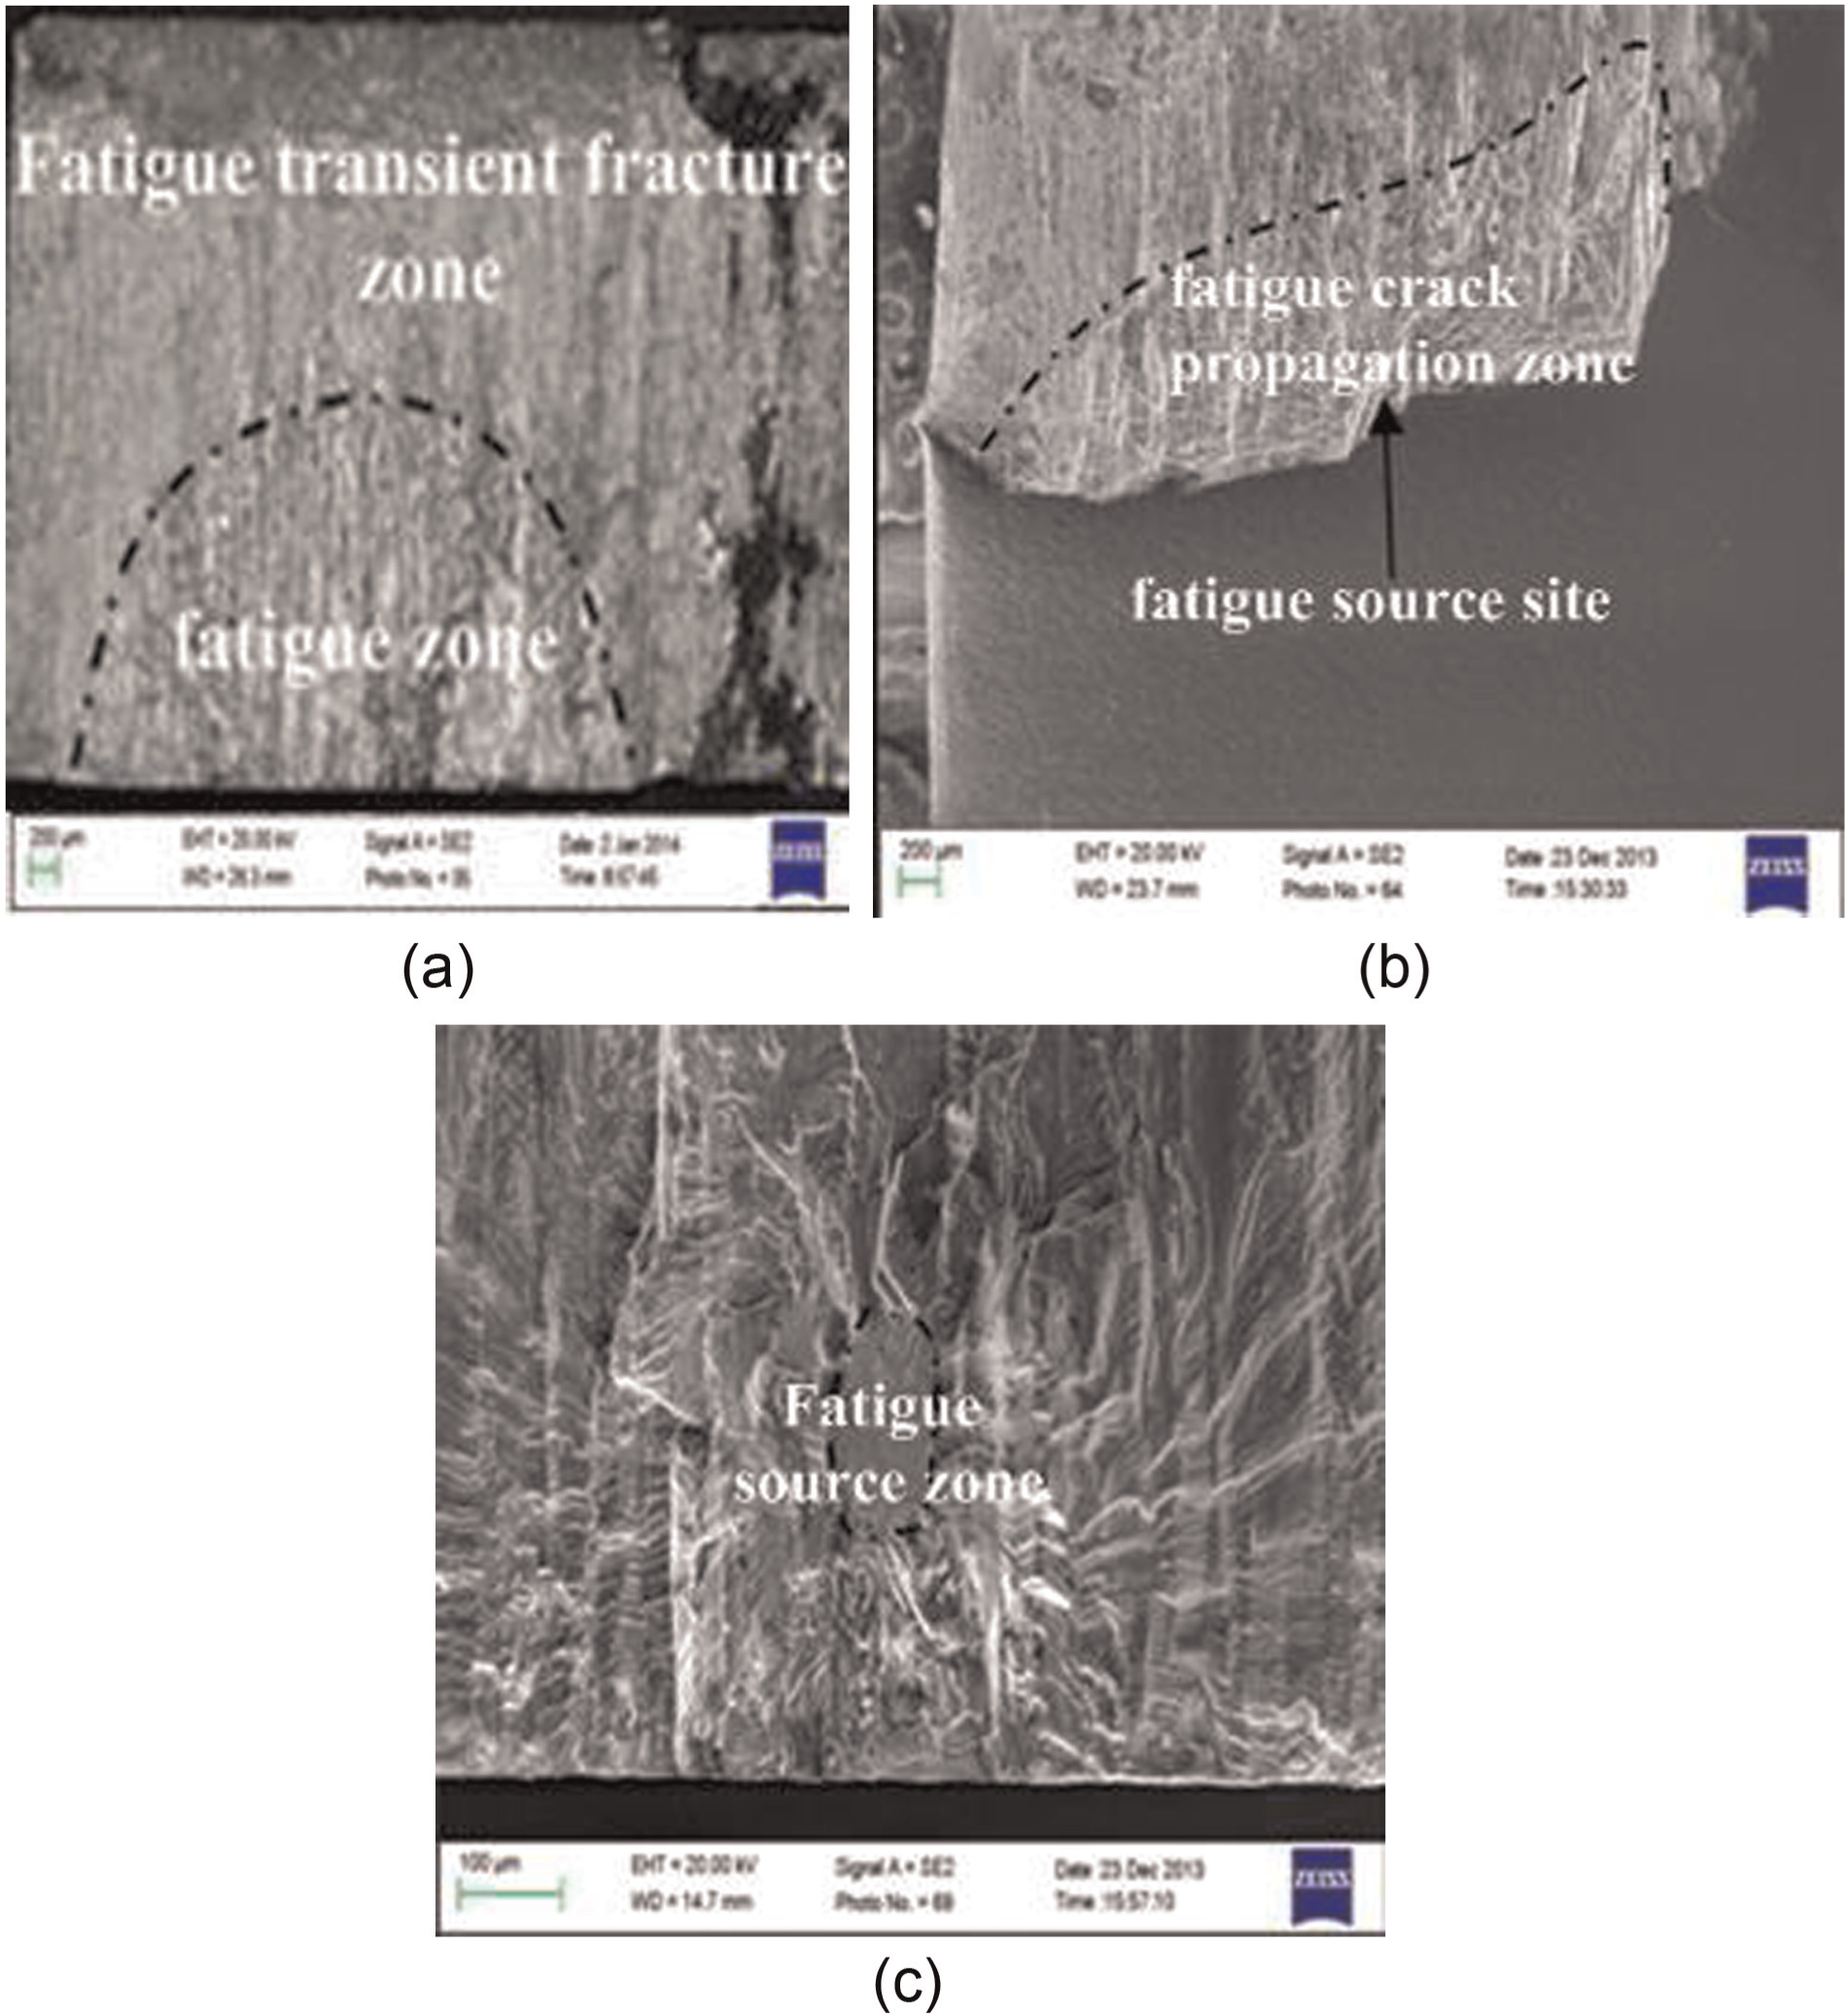
Fracture morphology of fatigue specimen 1: (a) whole morphology of fracture, (b) edge morphology of fatigue source and (c) fatigue source zone strip.
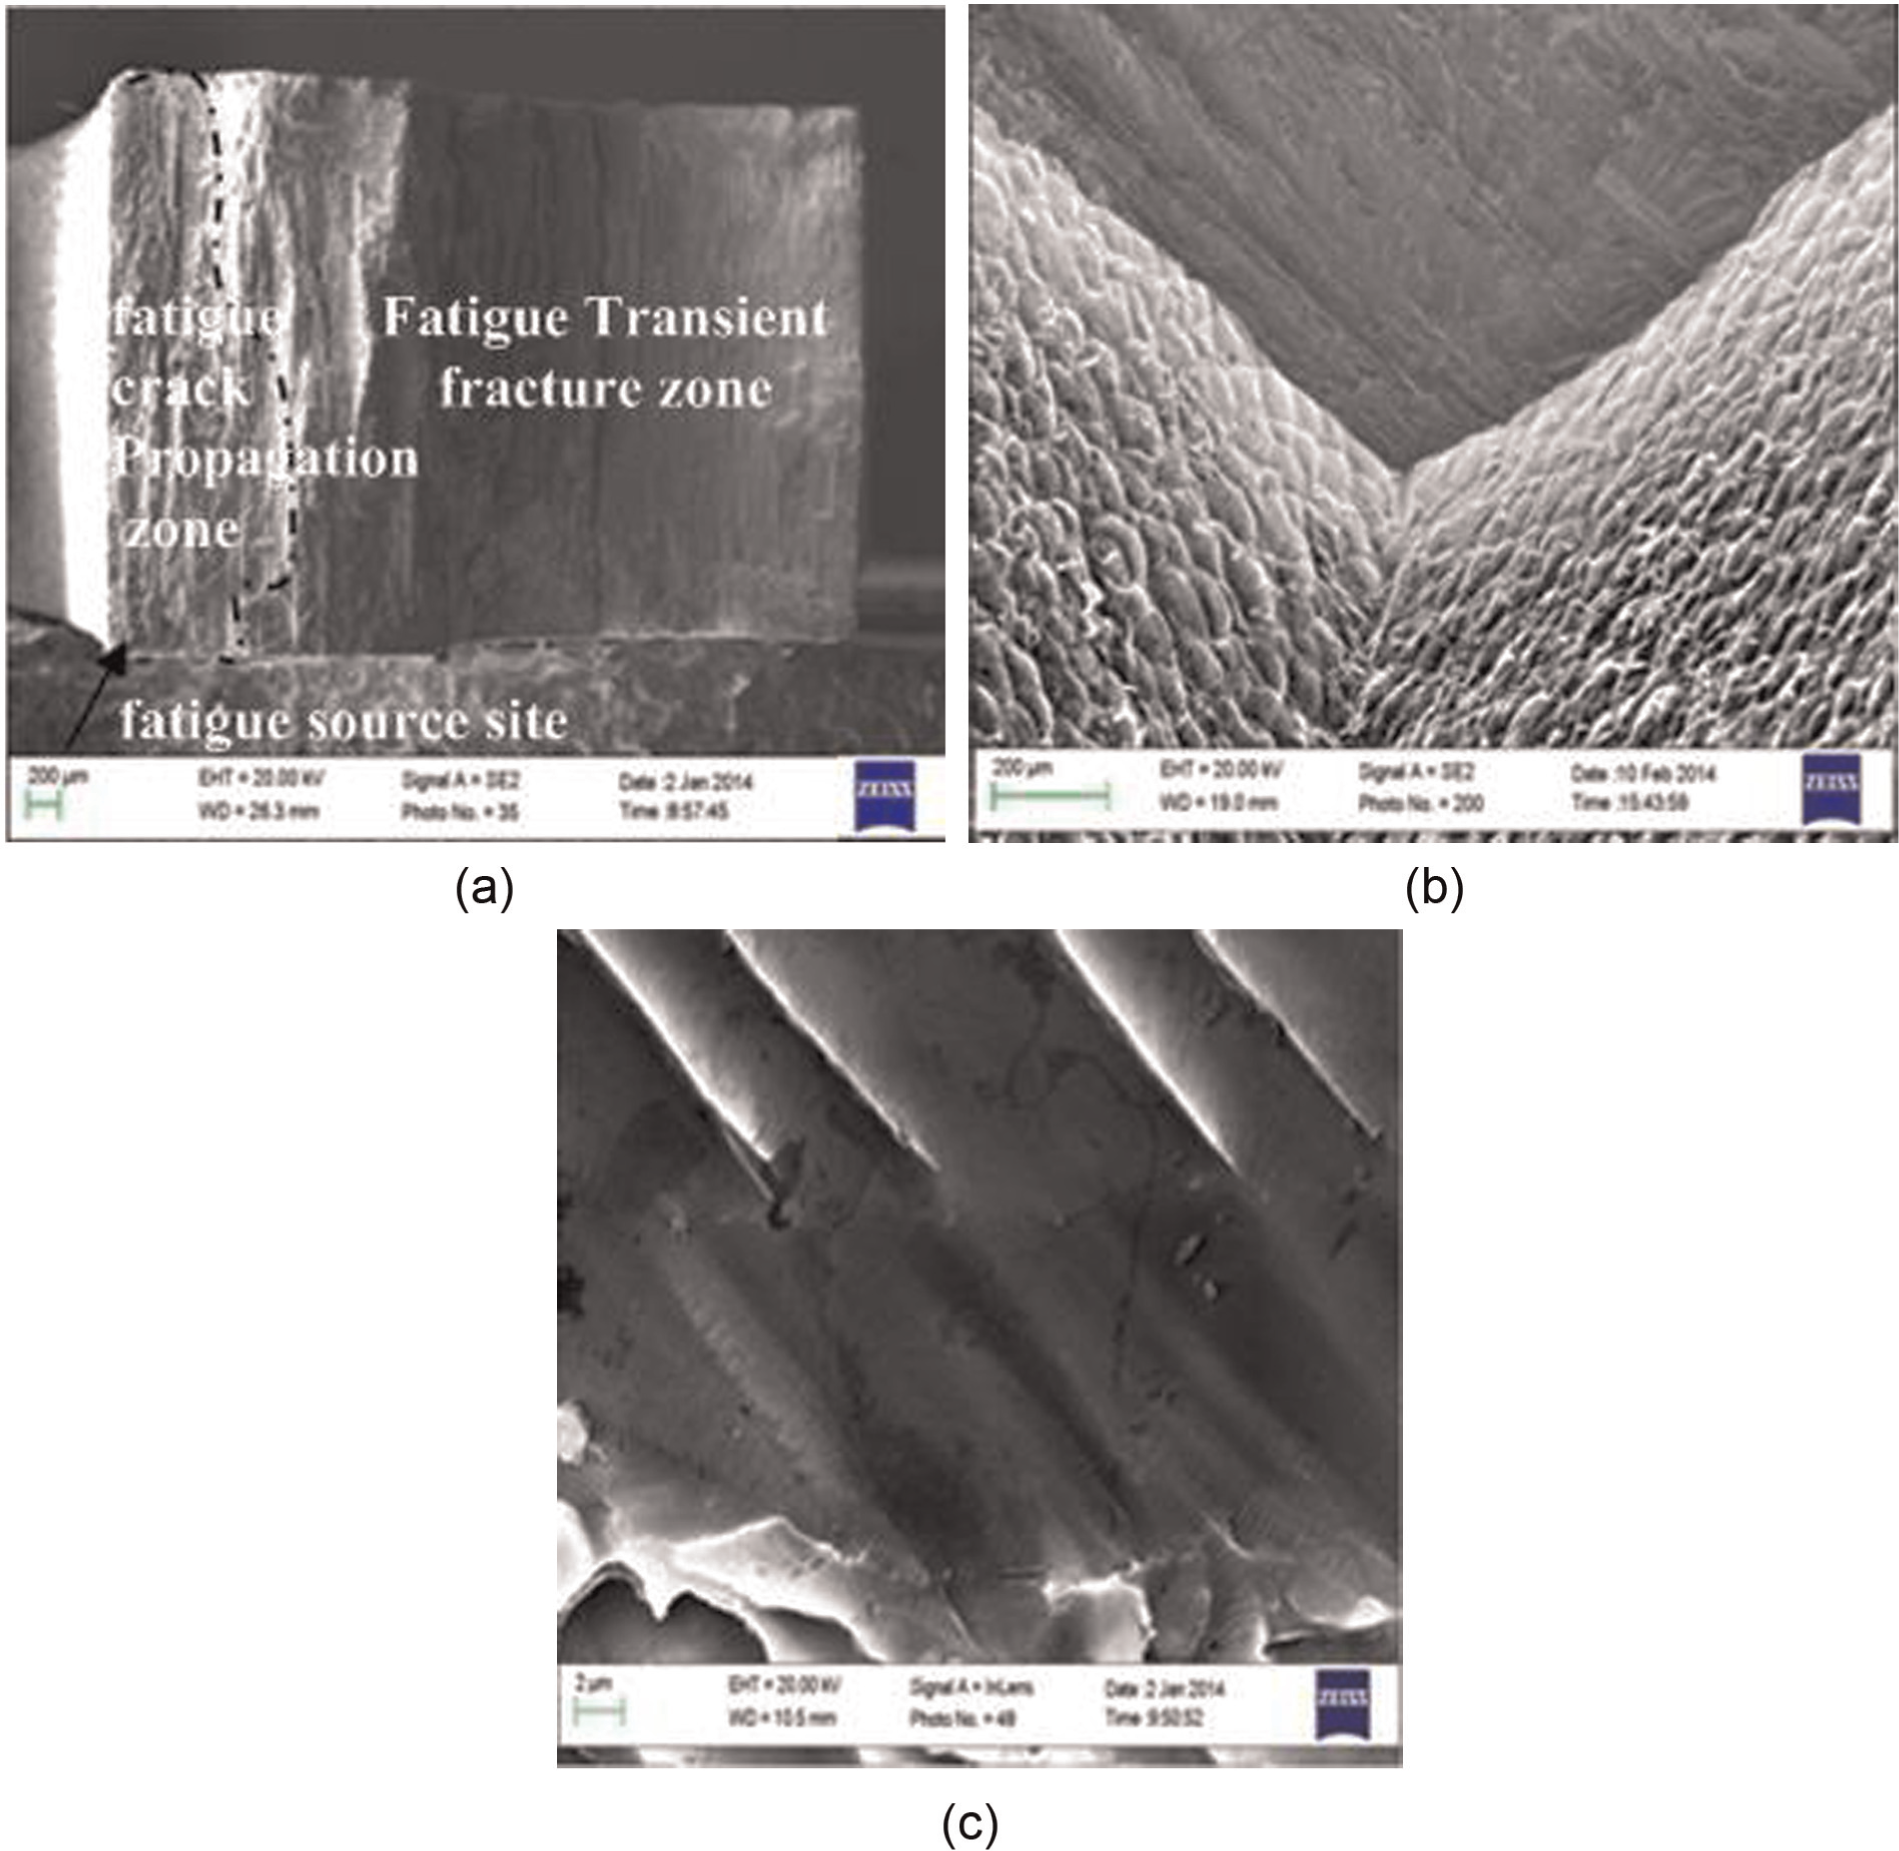
Fracture morphology of fatigue specimen 4: (a) whole morphology of fracture, (b) edge morphology of fatigue source and (c) fatigue source zone strip.
Fatigue fracture can be divided into fatigue source zone, fatigue crack propagation zone and fatigue fracture zone corresponding to different fatigue phases. The fatigue crack initiation position has a powerful preferred orientation. It originates from the location where stress concentrates and then expands like a sector in a form of corner crack. With the increase of surface roughness, the area ratio of fatigue propagation zone and fatigue fracture zone reduces because of the early unstable fracture caused by the high stress concentration. By comparing Figures 12 with 13, it shows that the fatigue source site of specimen 1 locates in subsurface, whereas the initiation of fatigue crack of specimen 4 starts in the lower left corner of the fracture; fracture of specimen 1 is relatively flat, while fracture of specimen 4 fluctuates greatly. From Figure 12(c), the fatigue source zone of specimen 1 is a smooth cleavage plane area. In this small region, many fatigue strips radiate from the area centered on crack origin to around. From Figure 13(c), there are a series of more obvious fatigue strips that parallel to each other in the fatigue fracture source area of specimen 4.
Conclusion
To summarize, this study demonstrated surface integrity and fatigue performance in SP for high-speed milled 7055 aluminum alloy. The following conclusions can be drawn from the work:
With an increase in the shot diameter and SP intensity, surface roughness increases significantly; both σrsur and σrmax decrease with the location of σrmax changing from surface to subsurface and depth of residual stress layer changing from 25 to 80–95 µm; peening has obvious impact on micro-hardness distribution with surface micro-hardness of about 198–213 HV0.025 for dshot = 0.215–0.425 mm, and depth of plastic deformation increases and grain on subsurface changes to slender strips and produces a shift and distortion in the direction of the pellets impacting.
Surface roughness is the comprehensive effects of surface geometry status on fatigue properties in some degree. But surface roughness is not enough to reflect effects of surface geometry status on fatigue properties. Smaller pellets in SP can almost cover all machining marks, and smaller shot pellets are better to reduce the stress concentration effect. On views of surface geometry status, not only surface roughness indicators, such as Ra, Ry and Rz, should be given attention but also the radius of curvature of the valley bottom must have been given more important consideration.
Fatigue life of all shot-peened specimens is higher than milled specimen. By comprehensive comparison, the smaller surface roughness, the larger curvature radius of valley bottom, the better micro-hardness distribution and the higher surface residual compressive stress simultaneously will have a larger fatigue life. Such conditions may produce fatigue source site in subsurface.
Footnotes
Appendix 1
Declaration of conflicting interests
The authors declare that there is no conflict of interest.
Funding
This work was supported by National Natural Science Foundation of China (grant no. 51375393) and Aeronautical Science Foundation of China (grant no. 2013ZE53060).