
Abstract
The layer-upon-layer nature of production by additive manufacturing (AM) made surface treatment as mandatory post-processing for increasing the surface integrity and subsequent tribological properties. In the present work an experimental study was carried out to understand how the ultrasonic shot peening (USP) enhances the corrosion rate, surface compressive residual stress, surface roughness and hardness of stainless steel 316 manufactured by selective laser melting (SLM). In order to do so, series of USP experiments carried out based on full factorial design taking into account the effects of ultrasonic power, processing time, and ball diameters on foresaid responses. Multi-objective optimization of process using desirability approach function was performed to obtain a process window including trade-off between energy consumption and sample’s quality characteristics. The optimization results revealed that it is not possible to have minimum energy and the best product’s quality at same time. In other word, to fabricate samples with best quality characteristics, more energy needs to be consumed. The optimum sample was selected through the trade-off graph based on the transition point where after this point the energy consumption dramatically increases but no further improvement in product’s quality characteristics are attained. By identifying the optimum sample, series of surface integrity examination tests were carried out to show the efficiency of USP on enhancement the surface integrity and corrosion properties of AM material. It was found that the sample processed by USP at optimum parameter setting by ultrasonic power of 60%, process time of 15 min, and ball diameter of 6 mm is an optimum process setting that meets the condition described for transition point and causes 120% improvement in corrosion rate.
Introduction
Parts which are produced by additive manufacturing (AM) process suffer from poor structural integrity and surface damages. 1 Formation of rough surface, porous structure, and tensile residual stress are known as main drawbacks associated with AM technology. 2 Thus, delivering the AM parts for functional use without improving the surface integrity may lead to problems such as poor fatigue life and excessive corrosion in harsh environment. 3
Surface severe plastic deformation (SSPD) treatments are widely used as sequential process to AM process to enhance fatigue resistance and tribological properties of metallic-based components. Ultrasonic-based SSPD (UB-SSPD) treatments have been reported as successful methods that exploit high frequency impact for surface modification of AM material. In majority of UB-SSPD, both static and dynamic loads have contribution in surface property enhancement. Ultrasonic surface rolling (USR), ultrasonic nanocrystal surface modification (UNSM) are two well-known UB-SSPD treatments which use synchronized static and dynamic loads in property enhancement of AM parts.4,5
However, incorporating static load limits the flexibility of processes for complex surfaces. Also, it increases energy consumption through exerting the contact force in different directions. In the work carried out by Teimouri and Amini, 6 it has been reported that the static load has greatest contribution in energy consumption of ultrasonic surface burnishing process. The calculated values of energy were around 1–4 kJ; however, it was only the energy consumption considered by process not deriving units. Also, they didn’t mention the value of energy consumed by ultrasonic generator. Nguyen et al.7,8 and Nguyen and Le 9 reported that the machine parameters such as feed rate, spindle speed and rolling depth (that influence the static force) are main parameters in determining energy consumption. They reported that in conventional burnishing process (without applying ultrasonic vibration), the energy consumption would be around 100 kJ.
It has been reported through that in surface mechanical treatment which only used the static force for example burnishing or surface rolling, the main aim is to smooth the surface roughness. 10 While, for enhancing the mechanical properties for example improved hardness and compressive residual stress, dynamic load needs to be applied to the process that results in dramatic increasing of energy consumption.11,12 Thus, it is expected that in USR and UNSM, by taking the energy consumptions of driving units and ultrasonic power into consideration, the total energy consumption reaches several-thousands kJ.
Ultrasonic shot peening (USP) is known as a promising technique that bombards high energy shots toward the samples by means of an ultrasonic deriving unit. Unlike to USR and UNSM, the USP doesn’t require the motion control unit; thus, it can be easily used for samples with complex geometries. Moreover, because of eliminating the static force in this process, the energy consumption is considerably reduced compared to USR, and UNSM. The method has been considered for processing of different metallic materials with specific applications.
Zhu et al. 13 used USP for processing of CP Ti alloy. They showed that the application of USP process yields 75% improvement in hardness of material. Kumar et al. 14 analyzed corrosion properties of Ti-6Al-4V subjected to ultrasonic shot peening. They reported that the improvement of corrosion resistance can be attributed to formation of compressive residual stress and refined grain structures. They also combined USP with annealing treatment for enhancing the fatigue life of same material. 15 The obtained research showed that the USPed material has the greatest life time compared to USP followed by annealing and as received one. Li et al. 16 found that formation of martensitic phase and its further refinement by increasing process time is the reason for surface property enhancement of stainless steel 301 subjected to USP.
Recently using of USP as post-treatment method of AM material has been attracted by researchers. Zhang et al. 17 applied USP for analyzing corrosion resistance of Ti-6Al-4V manufactured by laser powder bed fusion (LPBF). Based on the results obtained from corrosion potential and current density, it was found that the sample processed by USP for 480s is the most resistant sample against corrosion compared to the as-built samples and those post-processed by 960s and 1920s. Persenot et al. 18 utilized USP as post-treatment to enhance the fatigue life of thin-walled structure manufactured by electron beam melting. They revealed that the increased fatigue life of USPed sample compared to as-built one is due to formation of fine microstructure, inducing compressive residual stress and better surface finish.
Nevertheless, there are few numbers of researches that used USP for post-processing of AM components; understanding the effect of USP factors and their interaction on surface integrity aspects of AM material is still unclear and merits further studies. Therefore, in the present work an experimental study is carried out to understand effect of USP main factors that is ultrasonic power, processing time and ball diameter on corrosion rate, surface roughness, surface hardness and surface residual stress of stainless steel 316 L produced by laser powder bed fusion process. Here, the effects of abovementioned process factors are studied on corrosion resistance and the variation were justified by using the surface integrity aspects that is roughness, hardness and residual stress. Finally, an optimization will be carried out to obtain a trade-off between the energy consumption and corrosion resistance. The obtained optimal result will be further verified through confirmatory experiments and its corrosion properties and surface integrity aspects will be compared with as received material.
Materials and methods
Material
During building of material, 316 stainless steel powders with maximum diameter of 40 μm packed in the chamber to be printed by laser heating. The 3D printing machine includes a Nd:YAG fiber laser with wavelength of 1064 nm and maximum power of 500 W. The machine was set up to produce tablets with diameter of 25 mm and thickness of 10 mm using the layer thickness of 50 μm, hatch spacing of 100 μm and scan velocity of 2000 mm/min. The samples were printed on the substrate made of same material and separated after fabrication using wire electrical discharge machining.
Experimental setup
The ultrasonic shot peening device includes ultrasonic transducer, booster, horn, power supply, chamber, and clamping unit has been schematically illustrated in Figure 1. The ultrasonic apparatus includes back-mass, piezo-electric rings, front-mass, booster, and horn. Through design and fabrication of this unit, high-frequency vibration is transferred from power supply to the tip of horn. In the present study, the high-frequency ultrasonic waves are generated by mans of a power supply with maximum nominal power of 1000 W made of MPI corporation. It is able to generate high frequency vibration in range of 15–25 kHz.
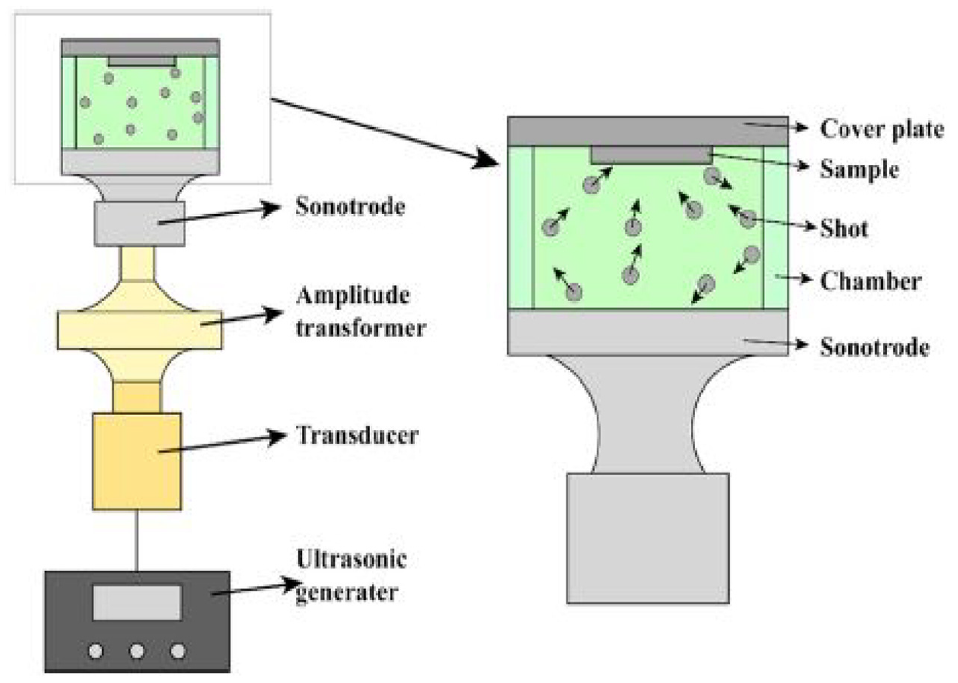
A schematic illustration of designed ultrasonic shot peening. 14
In order to design the horn, modal analysis was utilized through numerical simulation. Accordingly, the CAD model of horn was simulated in ABAQUS software and the exact dimension of the horn (by adjusting the length) has been obtained in such a way the resonance frequency reaches in the frequency of transducer that is 20 ± 1 kHz. The principle of fabrication and numerical simulation of horn was followed according to the specifications reported by Lotfi et al. 19
A cylindrical chamber with outer diameter of 50 mm and inner diameter of 40 mm were designed to contain the shots. In one side of the chamber a hole with diameter of 25 mm (equal to the diameter of ultrasonic horn tip) was machined and at the other side the workpiece is clamped by use of two grippers. The chamber was filled with number of six shots made of tungsten carbide to bombard the surface of AM samples.
Measurement
The samples for metallographic examinations were cut from the cross sections and subjected to polishing with different grades of polishing papers that is 400#, 800#, 1200#, and 2000#. Final polishing was carried out by use of diamond disk polishing to achieve mirror surface.20,21 The polished samples were then etched to be examined by scanning electron microscopy (SEM) using TESCAN machine.
The microhardness of the near-surface layer were measured by use of Vickers tester made of KOOPA SANAT corporation. The roughness of as-built and USPed material was examined by use of surface roughness tester made by MAHR corporation. The surface roughness tester can provide the roughness values based on the criteria of Ra and Rz. However, in the present investigation only the criterion Ra was taken into report because of two main reasons. (i) This parameter has been presented in most of the studies dealing with metal AM surface roughness. 22 (ii) Our pilot studies showed that the trend of variation of Ra and Rz with process factors were completely similar. The average values of 27 data sets showed that the Rz is 4.3 times of Ra. Thus, in order to prevent repetition of some information, it was decided to report only Ra criterion as the surface roughness value.
In order to measure the residual stress, the X-ray diffraction (XRD) method was utilized through employment of Stress-Tech XRD machine with Cu Kα radiation that works on 27 kV and 5 mA. The residual stress was measured using different tilt angles at rotation angle of 0°.
The corrosion rate of the AM and USPed samples were measured using the weight loss method. Accordingly, the weight loss of the material after 24 h immersion in the 3.5% NaCl solution was measured using a high accuracy balance WTB RADWAG with resolution of 0.001 g. Accordingly, after removing of material from corrosive solution, it has been cleaned from the corrosion products by means of immersion in the solution prepared by using 50 g CrO3, 2.5 g AgNO3, and 5 g Ba(NO3)2 in 250 cc distilled water for 1 min. The corresponding corrosion rate was calculated using the following equation
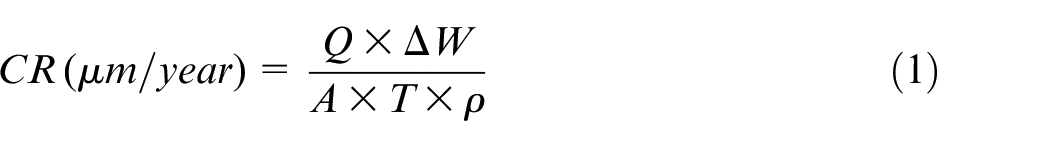
Where Q is a constant (87,600), ΔW is the mass loss in mg, A is the exposed area in cm2, T is the exposure time in h, and ρ is the material density in g/cm3.
Potentiodynamic polarization method was utilized to obtain corrosion potential (ECorrosion) and corrosion current density (ICorrosion). In order to do so, the polished samples were mounted on an electrochemical workstation namely Solartron SI 1287. The corrosion solution was 3.5% NaCl and the samples were subjected to Potentiodynamic polarization test in such way that the 100 mm2 area of material is exposed to corrosion with scan rate of 1 mV/s and scan range of −0.6 to 1 V.
The energy consumption for each test was calculated based on the production of consuming power and processing time.
It should be pointed out that the all the measurements have been replicated for three times and reported values throughout the paper are the average of three measurements. In order to do so, number of three samples for each condition have been prepared and subjected to USP, then their corrosion rate, roughness, hardness, and residual stress were measured and reported.
Method of investigation
Based on our preliminary experiments, parameters with greatest effects on corrosion rate and surface integrity aspects were identified. They are ultrasonic power (20%, 40%, and 60% of maximum power that is 1000 W), processing time (5, 10, and 15 min), and ball diameter (2, 4, and 6 mm).
The working ranges of process factors have been selected based on our lab experience and pilot researches. For the ultrasonic power, values less than 20% of maximum power don’t provide enough momentum to the shots; thus, surface integrity aspects and corrosion rate are not significantly altered. On the other hand, values greater than 60% were against the suggestion of manufacturer specifically for long processing time. It was suggested that only 50% of nominal power is used.
For processing time values less than 5 min result in insignificant change in surface integrity aspects. It means that the exposed area of the sample subjected to USP wasn’t well covered by impacts at the processing time less than 5 min. On the other hand, for the process time greater than 15 min, there were no significant change in the values of corrosion rate and surface integrity aspects compared to those processed by 15 min. It was resulted that the 15 min is saturation level of processing time. Also, values greater than 15 min significantly increased the energy consumption that was not on the basis of sustainability as one of main purposes of this study.
For the ball diameter, it was obtained from pilot studies that the values less than 2 mm don’t have significant influence on alternation of corrosion rate and surface integrity aspects. On the other hand, selection of ball diameters greater than 6 mm (based on available sizes) result in excessive surface roughness that deteriorates the corrosion rate. In addition, as results of greater momentum because of selection of larger balls, the designed chamber was damaged due to high kinetic energy. Thus, the maximum ball diameter of 6 mm was selected for processing of stainless steel.
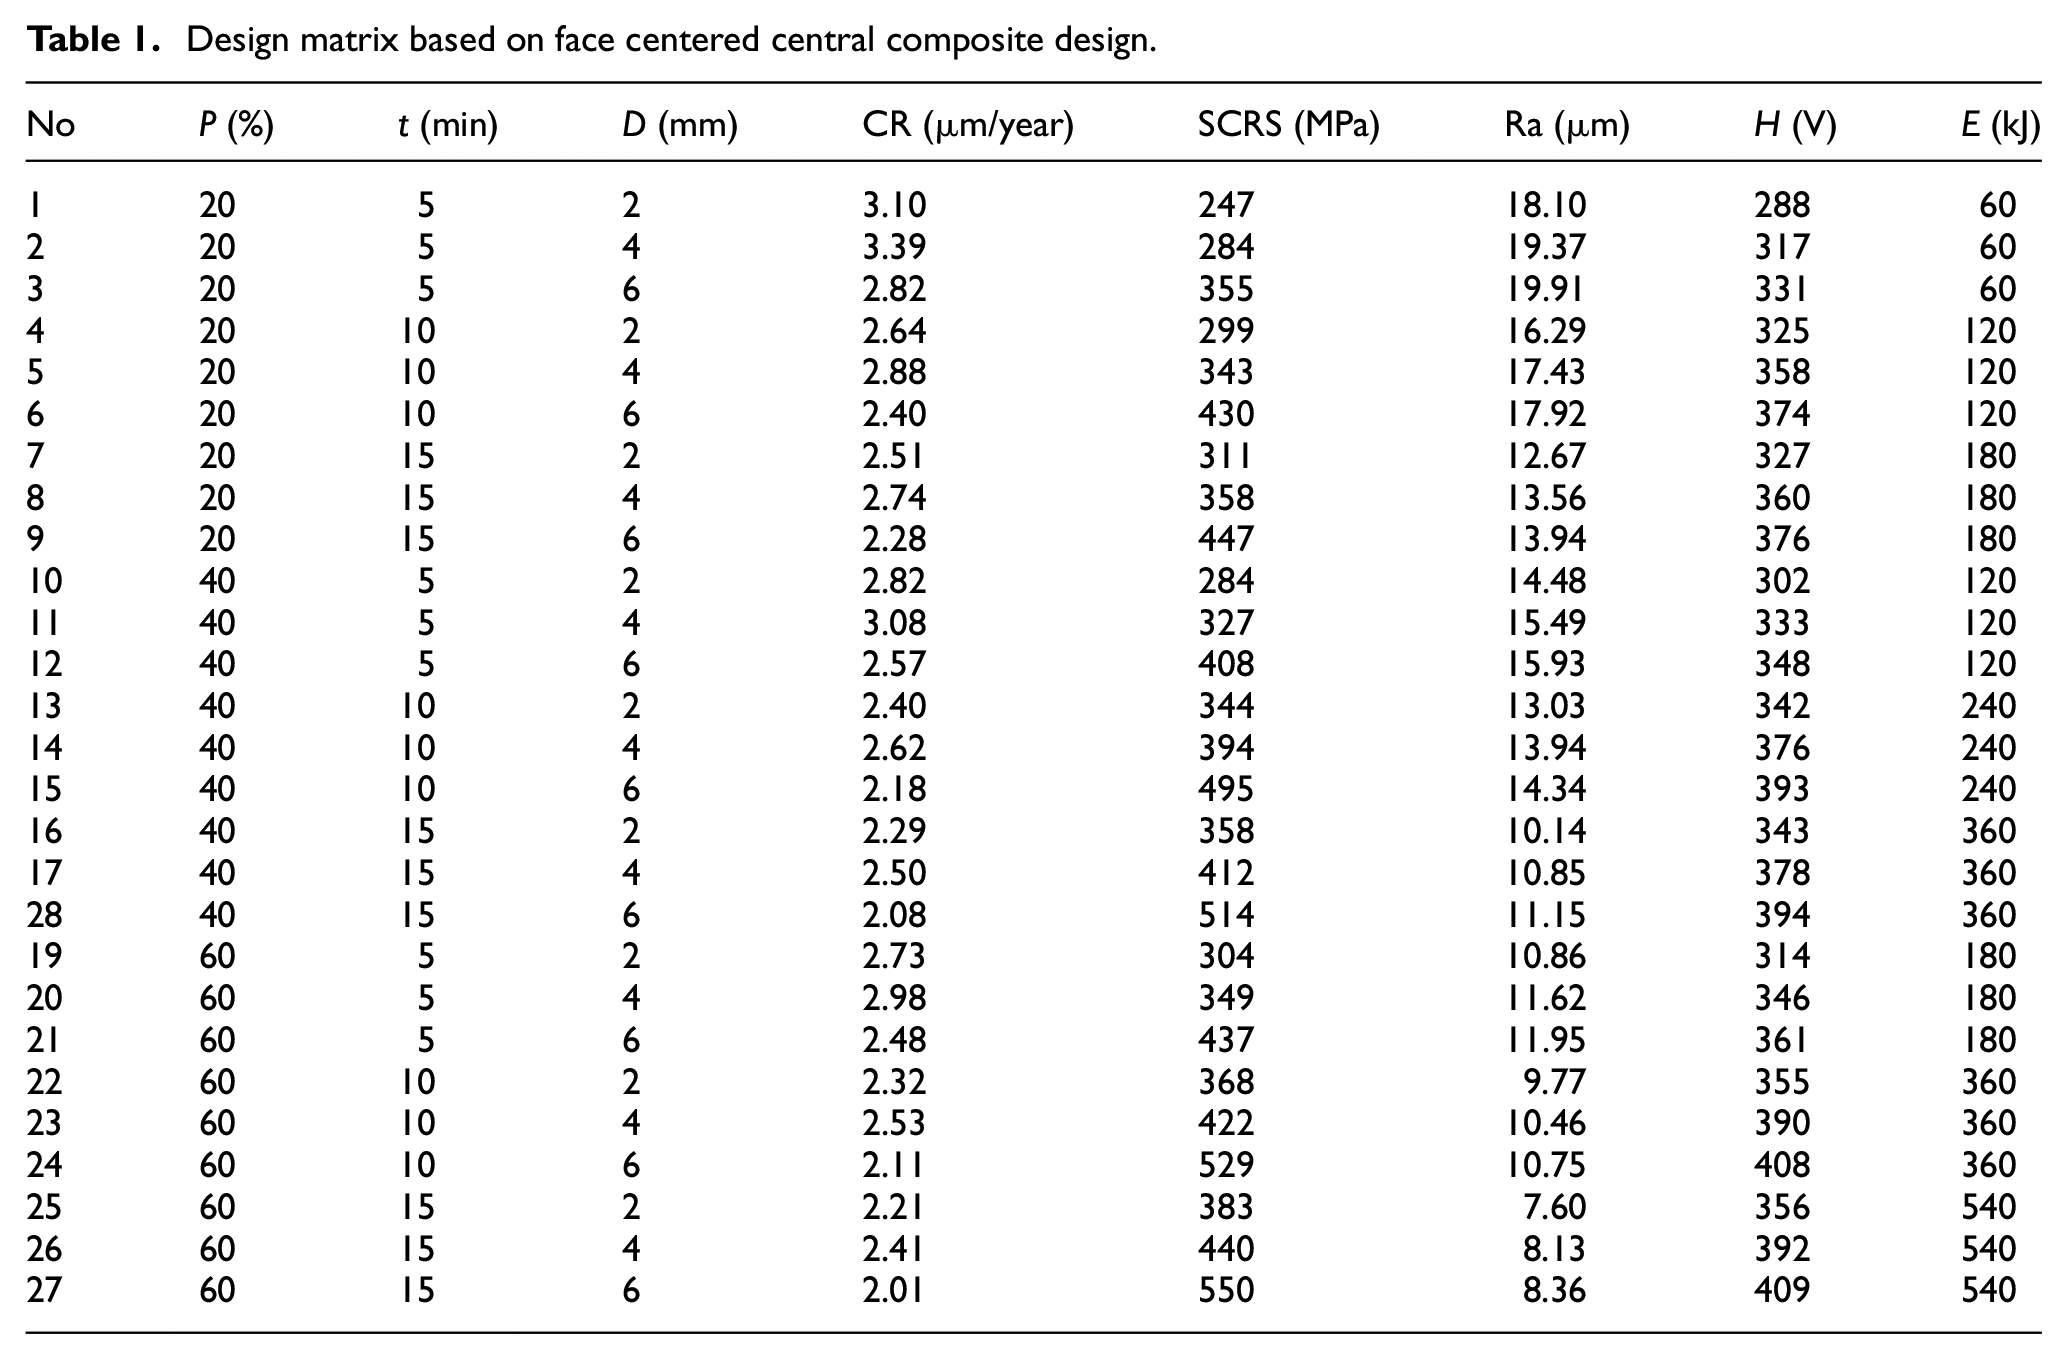
Accordingly, number of 27 experiments have been conducted to form design matrix based on full factorial design at MINITAB statistical software. Table 1 demonstrates the design matrix including the measured values of hardness corrosion rate, surface roughness, hardness, and surface compressive residual stress.
Design matrix based on face centered central composite design.
Results and discussion
Development of response surface model
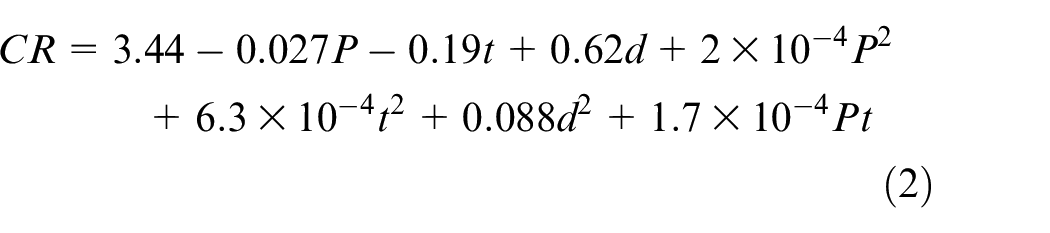
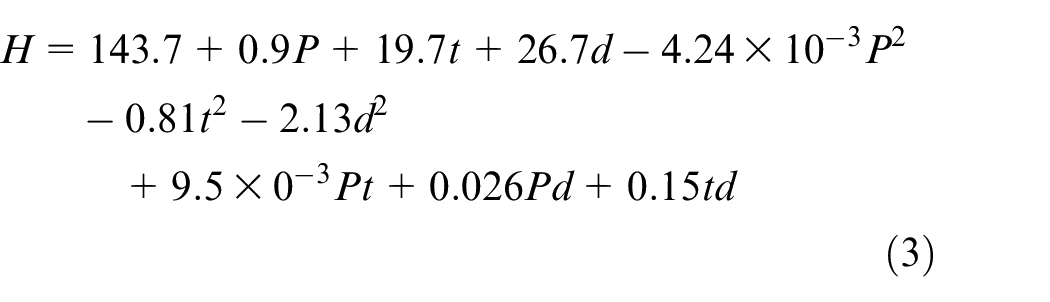
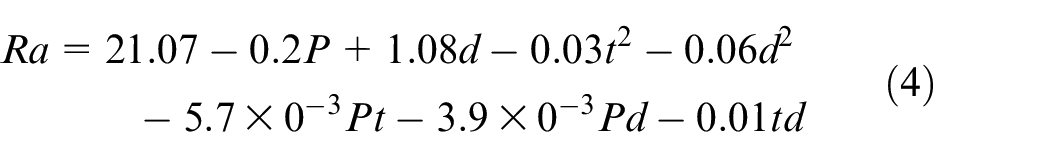
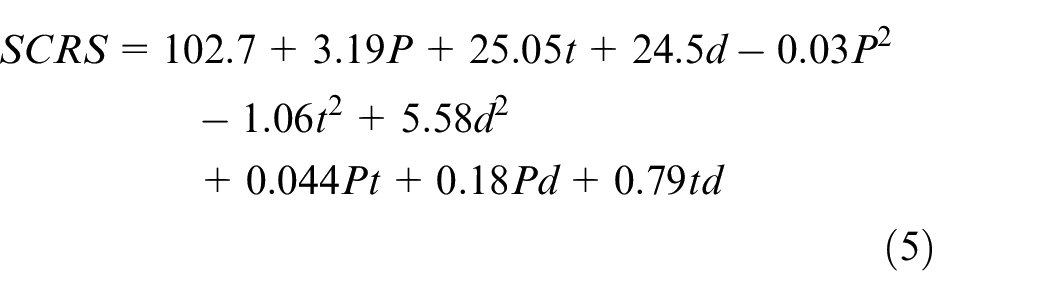
Second order quadratic regression model was used here to correlate corrosion rate, hardness, arithmetic surface roughness, and surface compressive residual stress to ultrasonic power, processing time and ball diameter. MINTAB statistical package was used to develop the empirical models based on regression analysis and relevant analysis of variances (ANOVA). According to the ANOVA results presented in Table 2, the terms with p-value greater than 0.05 are known as insignificant and can be excluded from the model.23,24 The developed statistical models of above-mentioned responses by exclusion of non-significant terms have been presented in equations (2)–(5), respectively.
ANOVA results including p-value, contribution of terms and correlation coefficients (i.e. R2s).
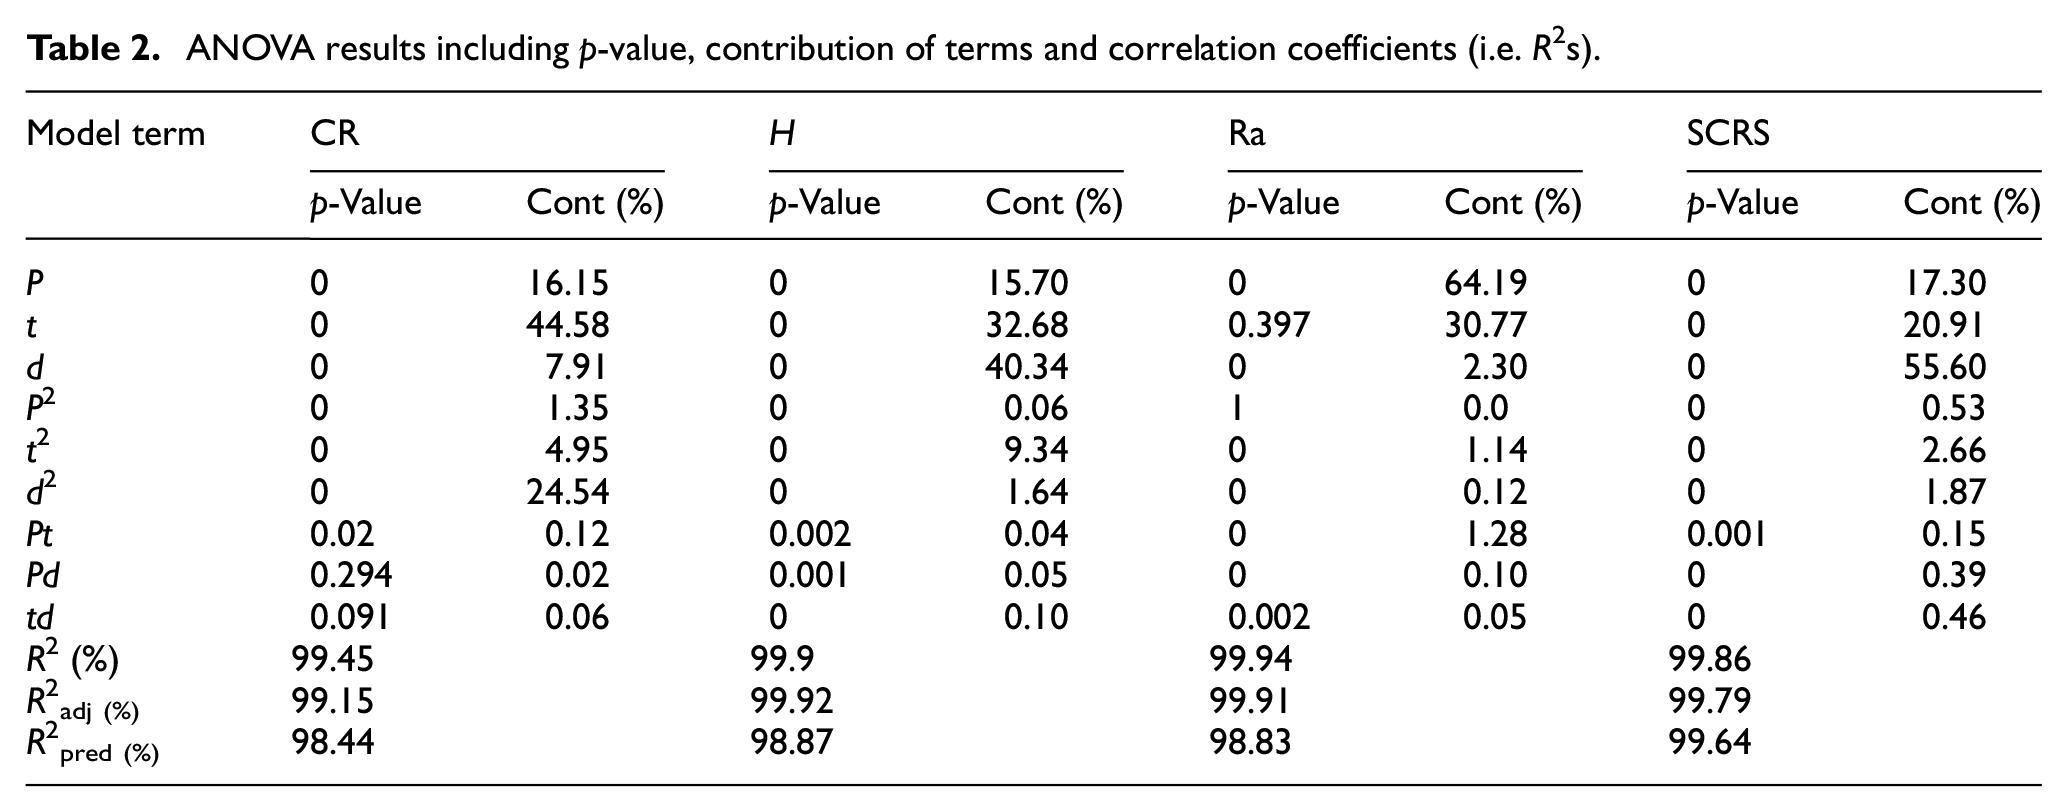
The contribution of model terms on the responses have been obtained by ANOVA and presented in Table 2. It is seen that for corrosion resistance, the process time followed by ultrasonic power and ball diameter have greatest impact in determining the values. The sequence of ball diameter, process time, and ultrasonic power determine the values of hardness and surface compressive residual stress. It is also seen from contribution column of Table 2 that for surface roughness, the ultrasonic power followed by processing time play predominant roles compared to ball diameter and other second order terms. Table 2 represents that the correlation coefficients (i.e. R2 values) for modeling of all the performance measures are close to 100% that implies close agreement exists between measured and predicted values. Figure 2 demonstrates measured versus predicted values of performance measures which are cumulated around Y = X curve. It also implies that values which were predicted by mathematical models are consistent well with those measured by experiments; therefore, they are scattered on the Y = X curve. It can be inferred from the results that the developed mathematical models are adequate enough to navigate the deign space. In other word, the regression models of process’ outputs can be used to understand how the ultrasonic shot peening factors impact them.
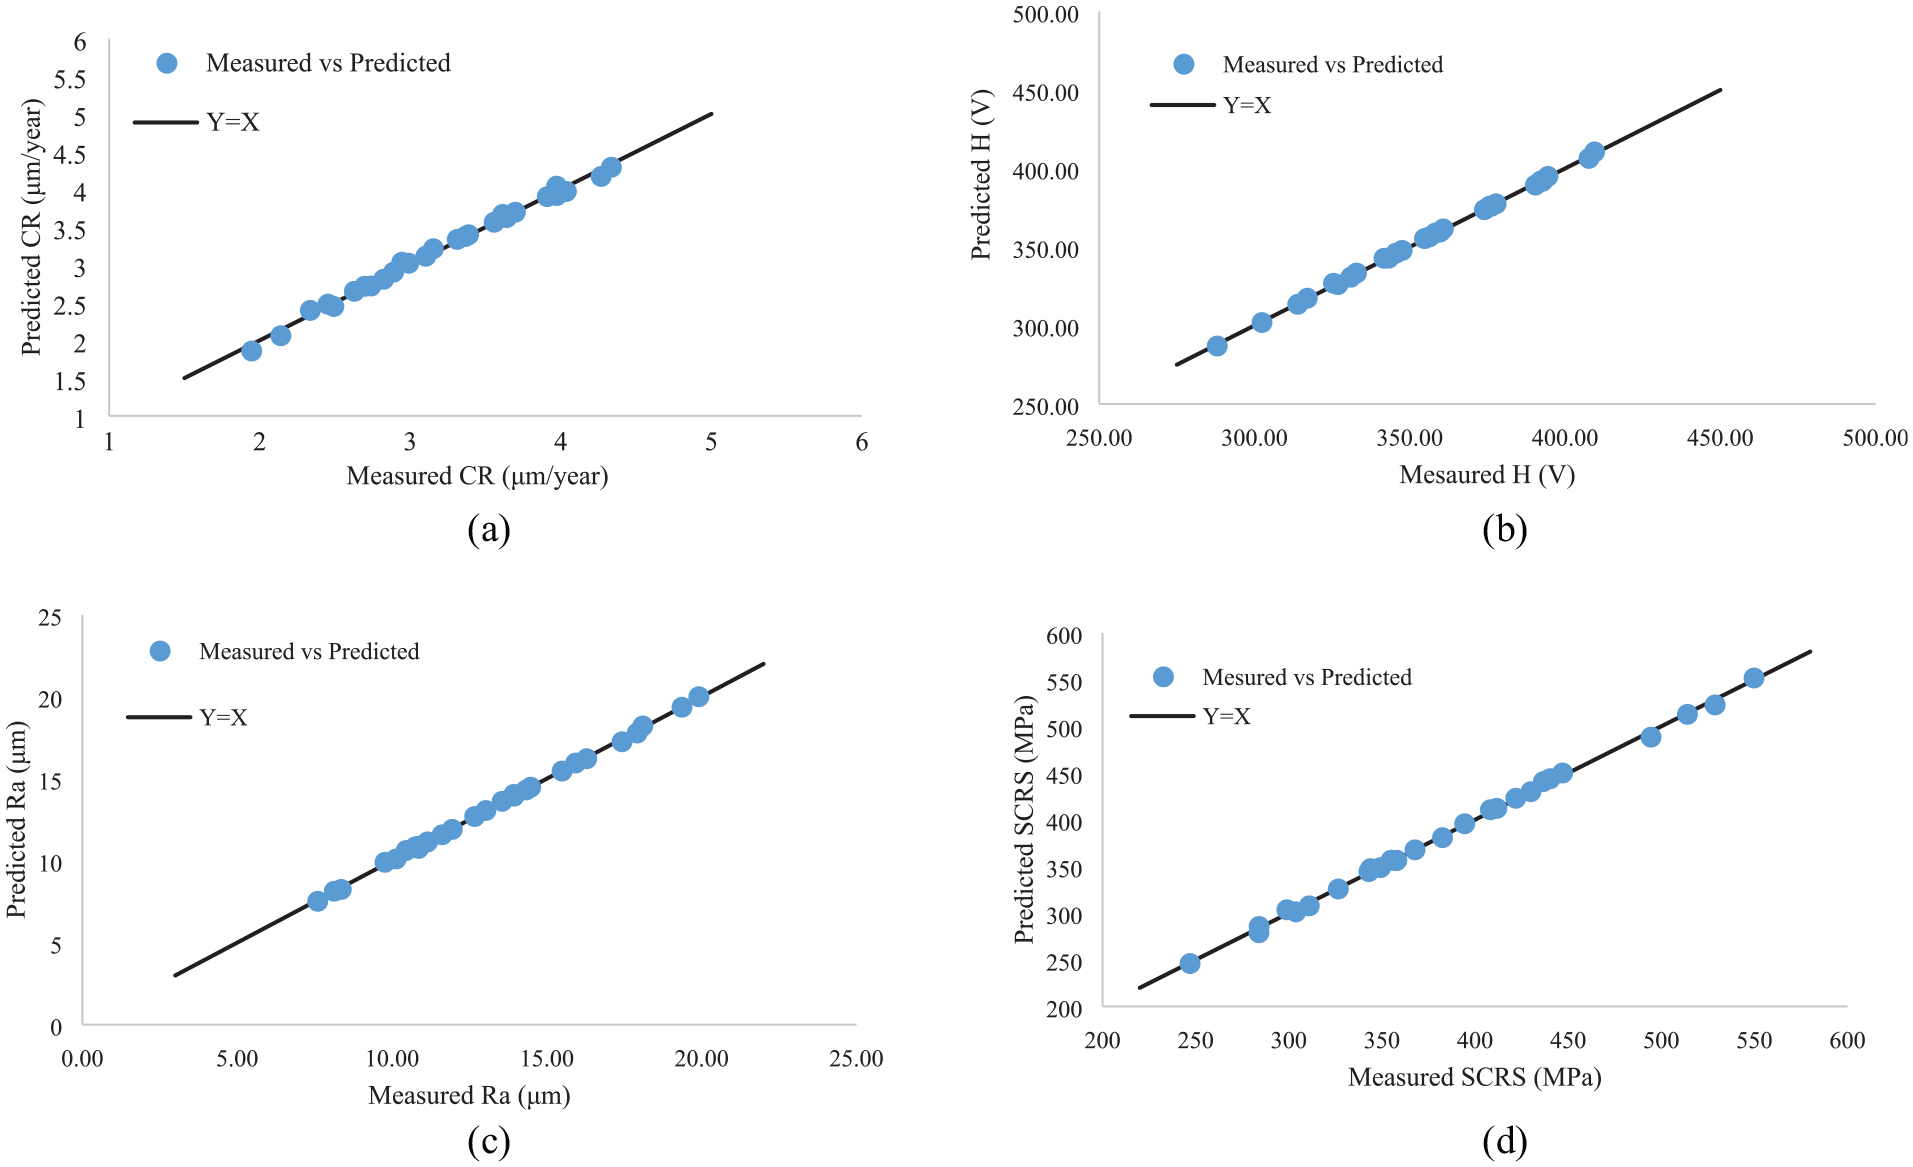
Comparisons between measured and predicted values of: (a) corrosion rate, CR, (b) hardness, H, (c) arithmetic surface roughness, Ra, and (d) surface compressive residual stress, SCRS.
Parametric influence
The developed empirical modes in previous section are utilized here to understand whether the USP factors influence the surface integrity and corrosion rate of 3D printed material. In order to do so, main effect plots based on mean values have been obtained and presented in following sections. Herein, firstly the effect of process factors on corrosion rate is demonstrated, then the parametric influences are justified by analyzing the surface roughness, hardness and residual stress.
Effect of ultrasonic power
Figure 3 illustrates effect of ultrasonic power on performance measures. It is seen from the Figure 3(a) that by increasing the ultrasonic power, the corrosion rate (blue curve) decreases that implies enhancement of corrosion resistant. In order to justify this effect, influence of ultrasonic power on surface roughness, hardness, and surface residual stress have been plotted in Figure 3. In Figure 3(a), it is see that by increasing the ultrasonic power, the surface roughness decreases.
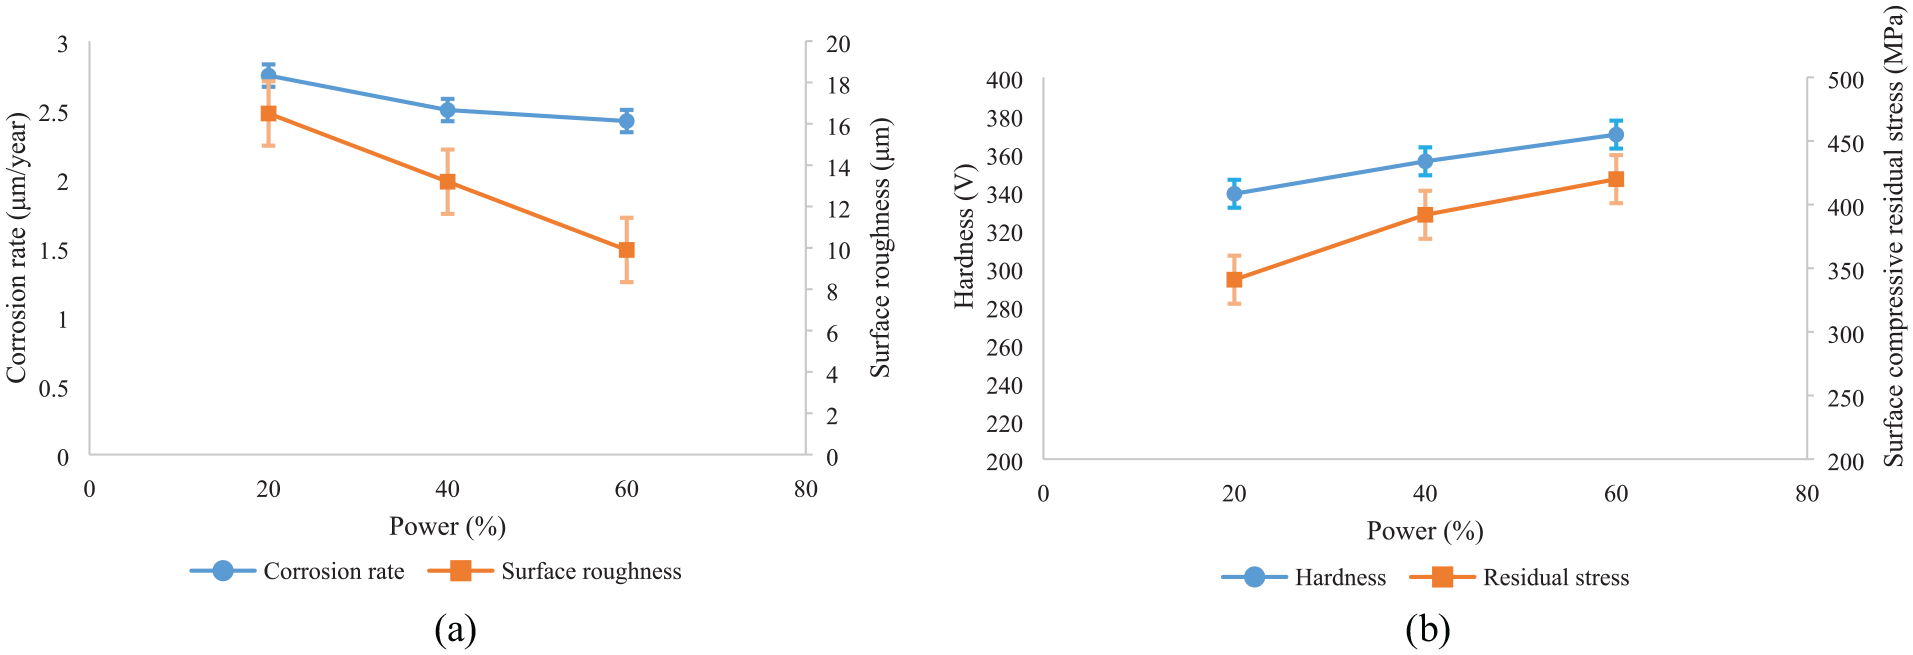
Effect of ultrasonic power percentage on: (a) corrosion rate and surface roughness and (b) hardness and residual stress.
The components which are produced by SLM have rough surface as result of existing non-molten particles, surface cracks and porosity. The surface roughness of the as received AM samples were measured and it was a bit further than 30 μm.
When the ultrasonic power is low, the kinetic energy for pummeling the surface irregularities and peaks are not enough. Thus, it can be expected that the lowering of roughness value cannot be significantly occurred at small values of ultrasonic power. When the ultrasonic power increases, as result of providing more kinetic energy of impact, the surface irregularities are significantly pummeled and the distance between the surface’ peaks and valleys are reduced that result in reduction of surface roughness up to 70%. Accordingly, as result of less surface roughness, the locations for initiating the corrosion cracks are reduced that yields less corrosion rate.
The hardness and surface compressive residual stress are two further factors that impact the corrosion rate. They majorly influence the corrosion crack propagation rate. According to the Figure 3(b), it is seen that as result of increase of ultrasonic power, both the hardness and surface compressive residual increase. When the ultrasonic power increases, more energy for bombarding the target material’s surface is provided.25,26 This condition leads to increase of initial velocity of the shots and correspondingly causes to further impact velocity. Subsequently, the contact pressure as result of kinetic energy of impact increases that yields further plastic strain and work hardening of the surface. The increased work hardening results in reduction of porosity of printed material. On the other hand, it causes decrease between distance of lattice structures. The former corresponds to enhancement of hardness, while the latter results in increasing the value of compressive residual stress.
Effect of process time
Influences of process time on corrosion rate and surface integrity aspects that is roughness, hardness and compressive residual stress have been presented in Figure 4. According to Figure 4(a), it is seen that as result of increase of process time from 5 to 15 min, the corrosion rate decreases about 20%. According to what described in Section 3.2.1, the influence of process time on corrosion rate can be justified by analyzing its effect on surface integrity aspect. From Figure 4(a), it is seen that by increase of process time the surface roughness decreases about 30%. As result of this reduction, number of nucleation centers for initiation of corrosion cracks are significantly reduced that corresponds to enhancement of corrosion resistance. However, it is see that the reduction of corrosion rate by increase of process time isn’t as significant as surface roughness. The former decreases about 20% while the latter reduces about 30%. In order to find the reason, effect of process time on other surface integrity aspects must be taken into consideration.
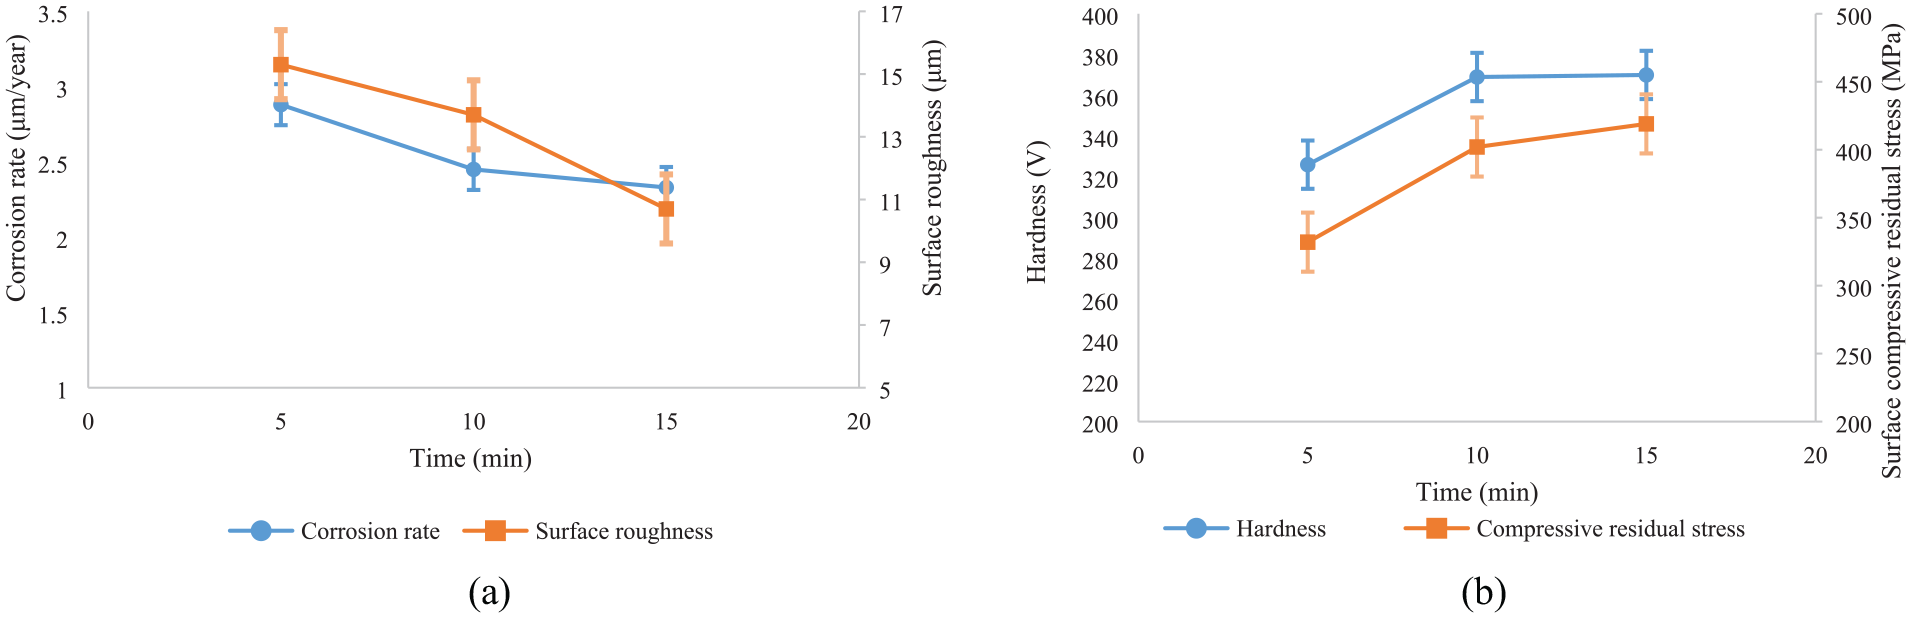
Effect of process time on: (a) corrosion rate and surface roughness and (b) hardness and residual stress.
Figure 4(b) illustrates influence of process time on variation of surface hardness and compressive residual stress. Accordingly, it is seen that by increase of processing time from 5 to 10 min, the surface hardness and compressive residual stress increase up to 10% and 20%, respectively. On the other hand, at process time of 15 min, its effect on hardness and compressive residual stress of the surface is saturated. In other word, no more enhancement in values of hardness and compressive residual stress are observed at process time of 15 min.
By increasing the time of USP, more area of the material is subjected to surface sever plastic deformation. Also, the amount of plastic working on the surface and beneath layers increases that yields further microstructure refining. In such way, as result of formation of fine structure, the hardness and compressive residual stress increase. Subsequently, the porosity induced by frequent melting and solidification that is known as common defect in printed material is restricted because of formation of fine and dense structure. However, at process time of 15 min, because of excessive dislocation accumulation, it acts as a barrier layer against further plastic deformation. 27 Thus, no more enhancement in values of surface hardness and compressive residual stress are achieved.
Effect of ball diameter
Figure 5 represents effect of ball diameter on hardness and surface roughness, respectively. According to Figure 5(a), it is seen that increasing the ball diameter from 2 to 4 mm results in further values of corrosion rate about 9.4%. However, by further increase of ball diameter to 6 mm, the corrosion rate decreases drastically about 15%. In order to find the reasons behind this variation, effects of ball diameter on surface roughness, hardness and residual stress must be taken into consideration. From Figure 5(a), it is seen that by increase the ball diameter, the surface roughness decreases drastically. The reasons can be attributed to two facts. The first reason can be due to formation of bigger indents as result of impact of heavier ball (with bigger size) with more kinetic energy. This causes increase of depth of penetration that may result in further surface roughness. On the other hand, as result of contact of larger ball with the surface, the pile-up height that is generated around the indent is bigger that results formation of rough surface. 28 According to the influence of ball size on surface roughness, it can be understood that the reason for increasing the corrosion rate by ball size (from 2 to 4 mm) is because of further surface roughness. The reasons for the reduction at 6 mm ball size can be due to variation of other quality characteristics that is discussed as follows:
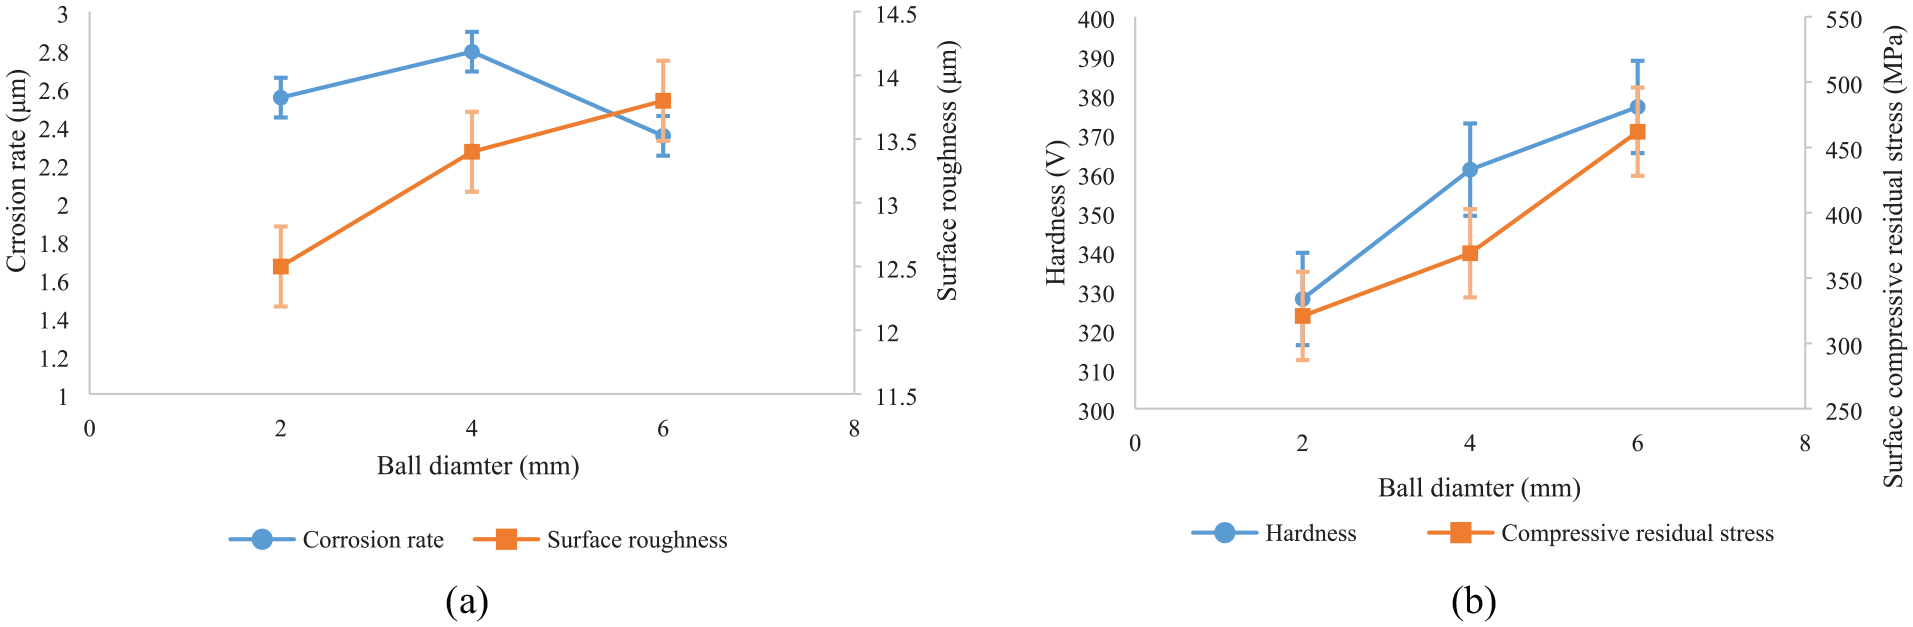
Effect of ball diameter on: (a) corrosion rate and surface roughness and (b) hardness and residual stress.
Figure 5(b) illustrates influence of ball size on surface hardness compressive residual stress. It is seen that by increasing the ball size, the surface hardness and compressive residual stress are significantly increased. As result of increasing ball size, the impact of ball and target material occurs at greater kinetic energy that provides more contact pressure. In such case, degree of plastic deformation increases and results in increasing the work hardening of material. Accordingly, the hardness and surface residual stress increases.
According to the results and discussions provided in Section 3.2.3, it can be concluded that at the ball diameter of 4 mm, the dominant mechanism contributed to increasing the corrosion rate is formation of rough surface. Here, the enhanced surface hardness and compressive residual stress aren’t as significant as roughness on corrosion rate. On the other hand, at ball diameter of 6 mm, the restriction of corrosion crack propagation because of further surface hardness and compressive residual stress is more dominant compared to formation of rough surface. Increase of surface compressive residual stress about 30% at ball diameter of 6 mm yields deceleration of crack propagation rate and enhancing the corrosion resistance.
Optimization
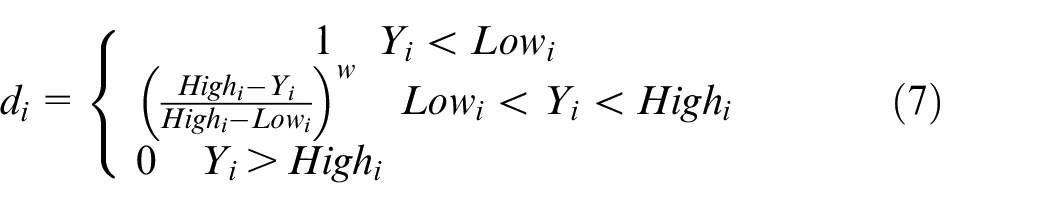
Multi-objective optimization of ultrasonic shot peening parameters aiming at achieving minimum corrosion rate, minimum roughness, maximum hardness, and maximum compressive residual stress have been carried out by desirability function. While using this approach, all the foresaid outputs must be integrated to form a unified objective function. 29 Depends to importance of each output (lower-the-better or higher-the-better), the equation of desirability is different. Equation (3) represents the desirability function for the purpose of higher-the-better (e.g. hardness and compressive residual stress), equation (4) expresses the equation of desirability for purpose of lower-the-better (e.g. energy consumption, corrosion rate and surface roughness); and equation (6) is overall desirability function that is determined by applying weight factors. 30
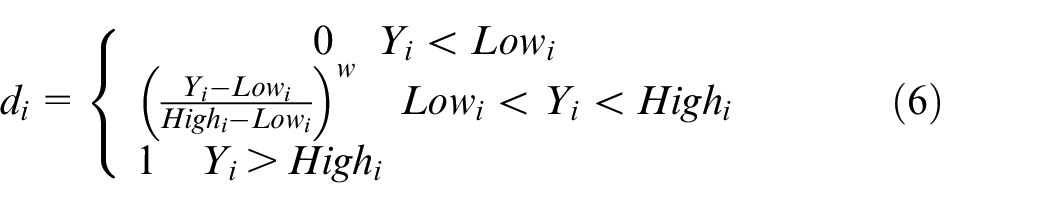
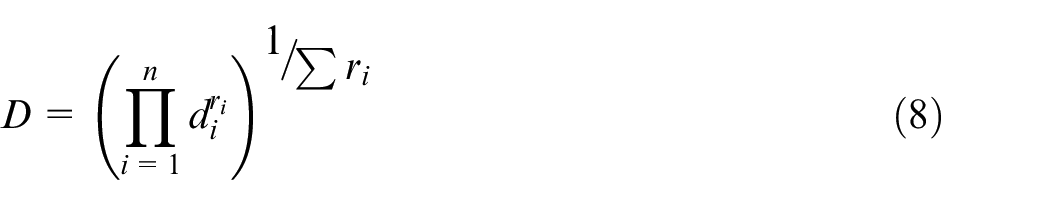
In the equation (6), the ri is the weight factor that determines the importance of each responses during optimization. It usually adopts the values between 0.1 and 10 based on the importance of responses in the overall desirability function. 31
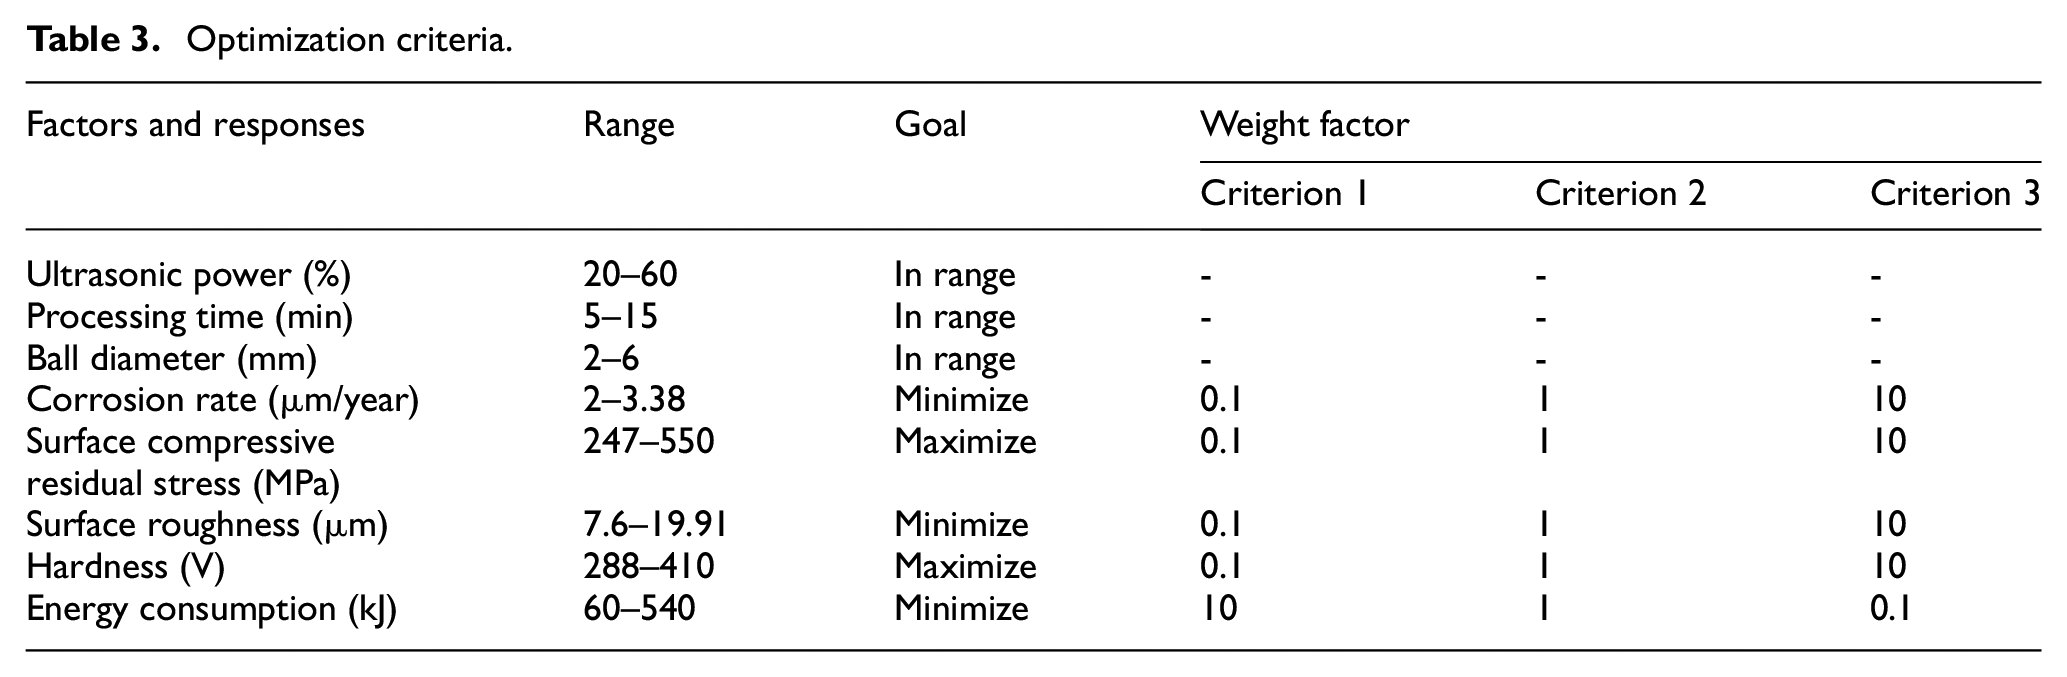
To perform the optimization, the optimization criteria should be identified. In the present study, one of main goal of optimization is development of trade-off graphs between product’s quality. However, the trade-off graph is obtained by use of different points. In order to do so, three optimization criteria based on the weight factors of overall desirability function were defined. In the first criterion, the main goal is only minimization of energy consumption without allocating importance to products’ quality characteristics. In the second criterion all the performance measures (i.e. energy consumption and product’s quality characteristics) adopt same importance. Also, the goal of third optimization criterion is to achieve best products’ quality without any attention to consumed energy. Table 3 summarizes the optimization criteria.
Optimization criteria.
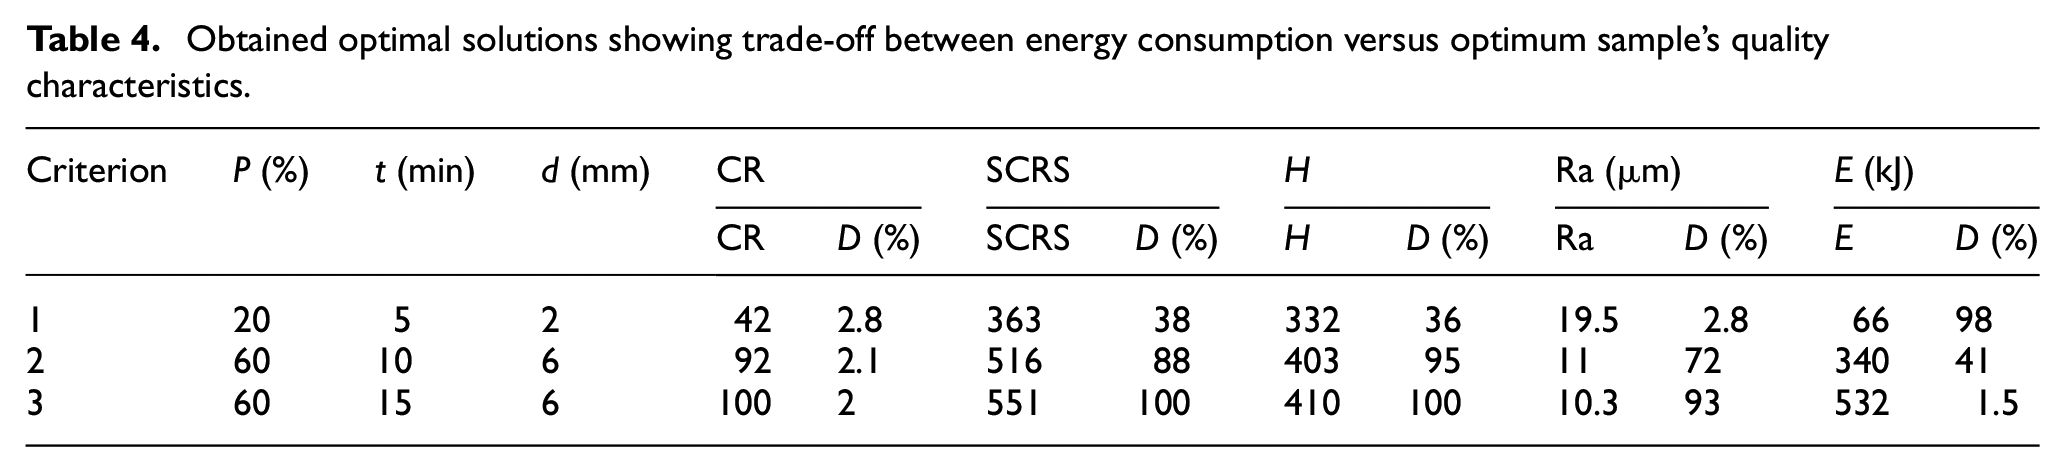
After defining the criteria, the multi-objective optimization of process has been carried out in MINITAB statistical software. The optimization results regarding each criterion has been presented in Table 4. By use of the optimization results of Table 4, the trade-off graphs for different optimization criterion based on values of desirability has been drawn as shown in Figure 6. Also, the trade-off graph based on the real values of performance measures have been obtained and presented in Figure 7. It is seen from the figures that it is impossible to have optimized product’s quality and minimum energy at same time. In other word, in order to have the best quality of the products, the energy must be consumed. However, there is an interesting point in the trade-off graph that needs to be taken into consideration. The physical meaning of this point in trade-off graphs presented in Figures 6 and 7 is completely same. It is seen from the graph presented in Figure 6 that by increasing the energy consumption further than the desirability of 40% (that equals to 340 kJ), no further significant improvement is observed in the values of product’s quality characteristics. In other word, as shown in Figure 7 by consuming further energy from 340 to 540 kJ (i.e. 58% further energy consumption), the corrosion rate decreases about 4%, surface compressive residual stress increases about 6.7%, surface roughness decreases about 6%, and hardness increases about 1.7%. Accordingly, by spending about big amount of energy no significant enhancement is obtained in the part’s quality characteristics.
Obtained optimal solutions showing trade-off between energy consumption versus optimum sample’s quality characteristics.
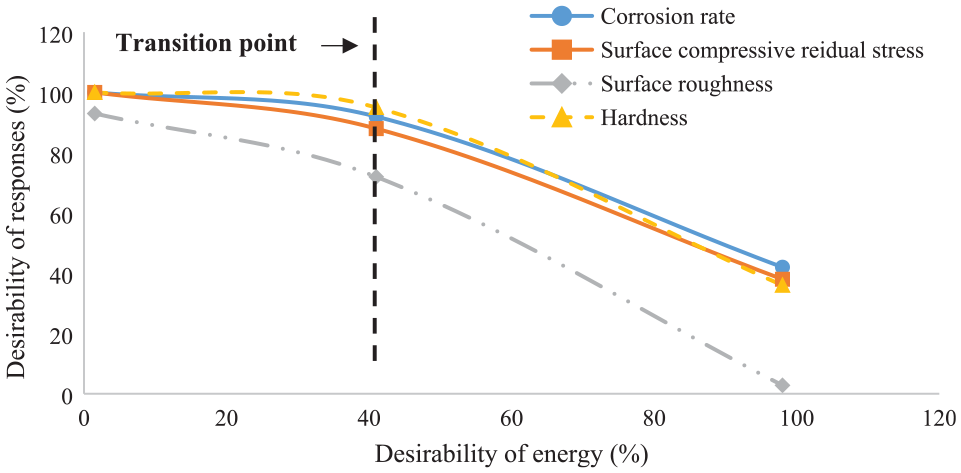
Desirability values of different responses with respect to desirability of energy consumption.
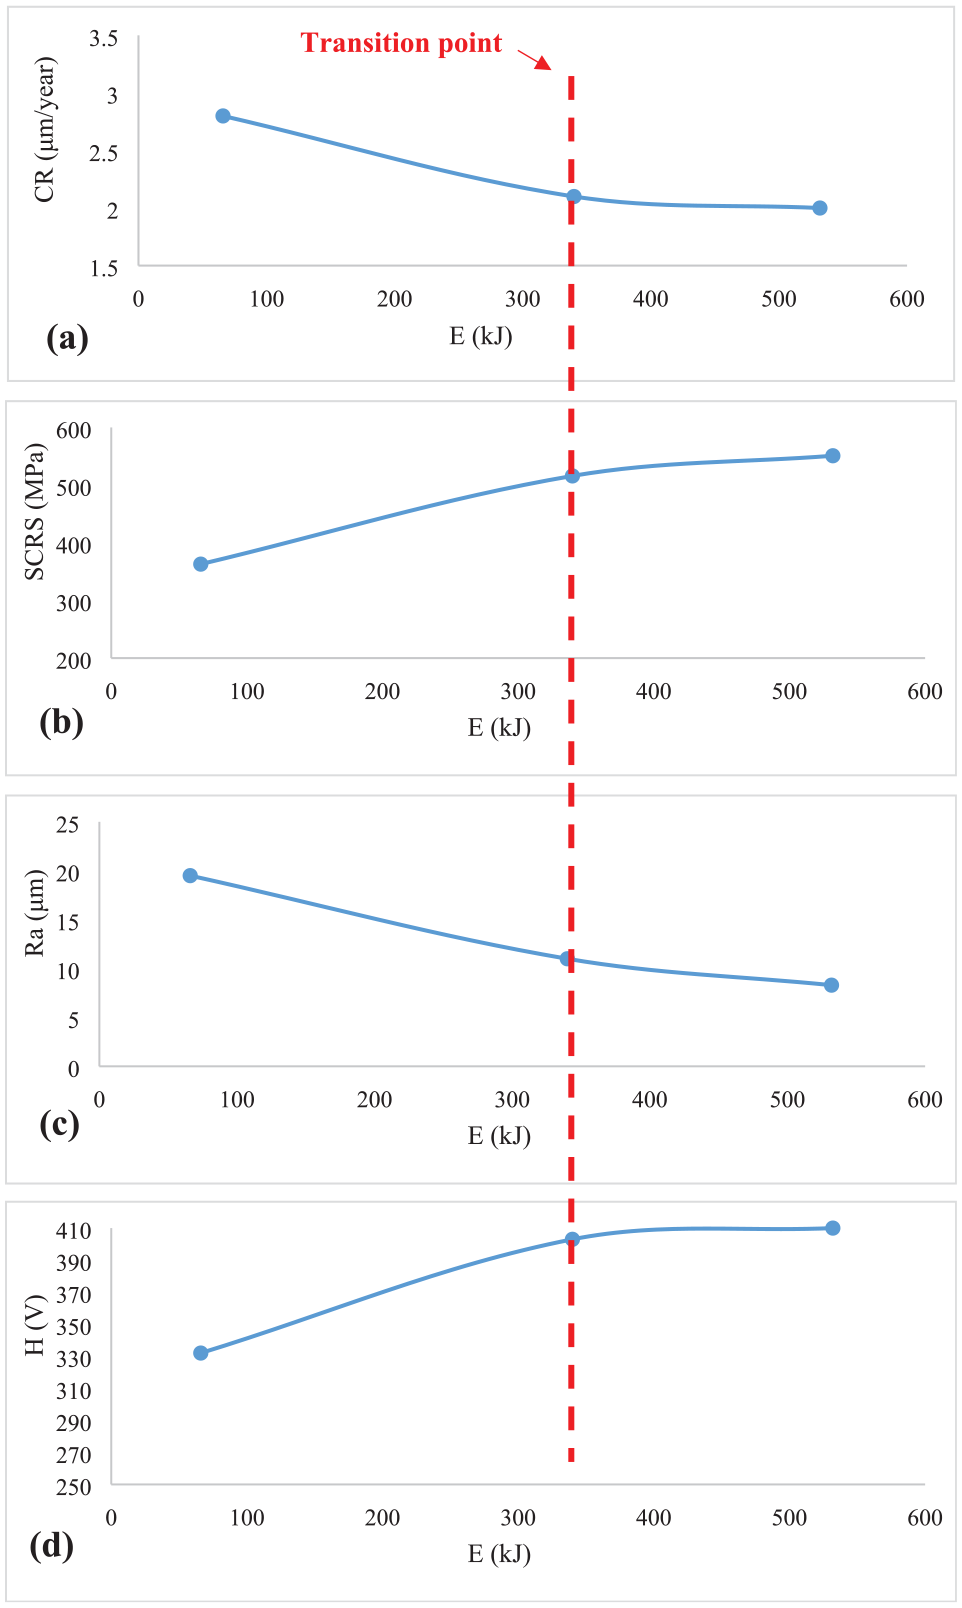
Trade of graph between energy and (a) corrosion rate (b) surface compressive residual stress (c) surface roughness (d) hardness.
The above-mentioned point is named as transition where after this point by increasing the energy consumption no significant changes are achieved in values of corrosion rate, surface compressive residual stress, surface roughness and hardness. On the other hand, before this point (where the energy consumption is lower than 340 kJ or desirability of energy consumption is greater than 40%), the quality of the USPed sample dramatically decreases. Thus the transition point that is related to criterion #2 of Table 4 is selected as optimum parameter setting.
According to the discussion presented above the optimal set was identified as 60% ultrasonic power, 10 min processing time, and 6 mm ball diameter. This setting refers to the data #24 in the design matrix presented in Table 1. Compared to the values reported in Table 4, it is seen that the present approach was accurate enough to predict the optimal setting with high accuracy. The prediction error for modeling of optimized corrosion rate, surface compressive residual stress, hardness, and surface roughness are 0.4%, 2%, 1.2%, and 2.2%, respectively.
Comparing surface integrity of optimal set
In order to show the efficiency of optimization, the microstructure, hardness and residual stress distribution surface topography, and potentiodynamic graphs showing electrochemical corrosion properties of as-printed and optimum samples were taken into comparative study.
Microstructure
In order to study the microstructure evolution of the optimum sample compared to as-printed one, the EBSD analyzes have been carried out and shown in Figure 8. It is seen from Figure 8(a) that for the as-printed material, the columnar grains are grown epitiaxially in built direction as result of rapid cooling. Also, it is seen that the microstructure of the as-printed sample is completely non-uniform and there is no specific pattern in grain size distribution at every location beneath the surface layers. However, for the optimum USPed sample, the microstructure is completely refined because of sever plastic deformation of surface and sub-surface layers. Accordingly, the coarse and non-uniform structure is replaced by uniform and fine structure.
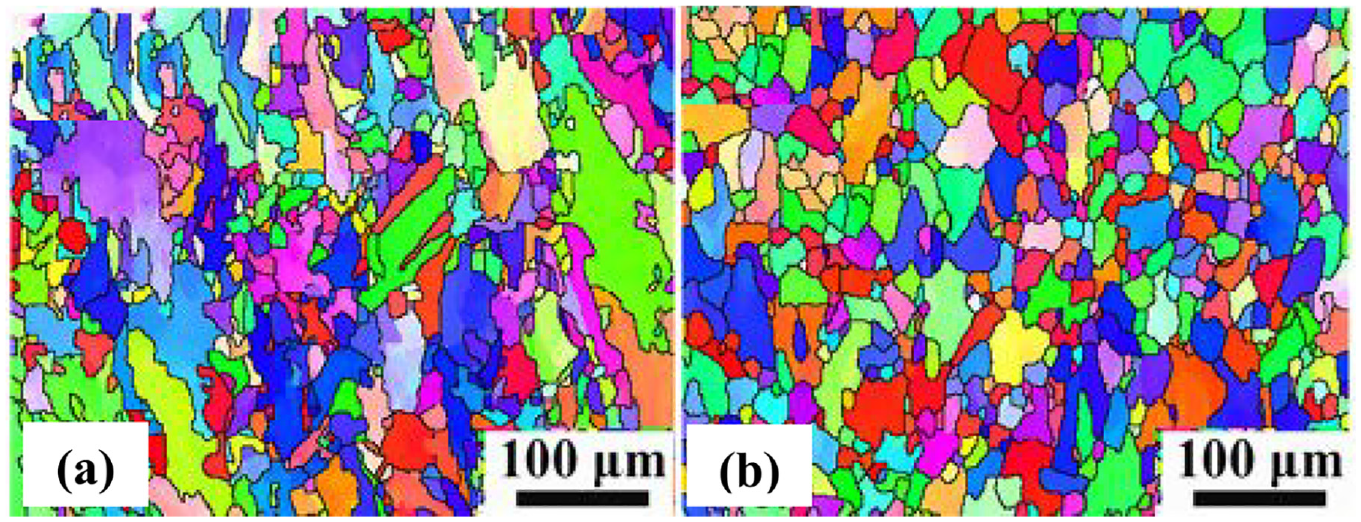
EBSD images of
Also, it is seen from Figure 8(a) that for as-printed sample, the color of the map is majorly red that implies the austenite is dominant phase in the surface and beneath layers. However, for the sample processed by USP (Figure 8(b)), as result increasing the induced strain, the martensitic phases (demonstrated by green in color map) are generated in the superficial layers that results increased strength properties. Thus, it can be inferred that the hardening mechanism can be attributed to refining the microstructure and formation of martensitic phase.
Surface morphology
Figure 9 illustrates the SEM image and 3D surface topography of the AM samples and those processed by optimum USP setting. According to Figure 9(a), it is seen that as printed sample includes lots of defects such as porosity, cracks and non-molten or semi-molten powders that causes formation of rough surface with excessive of irregularities. These regions are known as appropriate place for nucleation of corrosion crack initiations. In Figure 9(b), for USPed sample under optimum setting, the black features representing that the voids and cracks are diminished. Accordingly, because of formation of smoothed surface after USP, the crack nucleation center is reduced that will result in increasing the corrosion resistance.
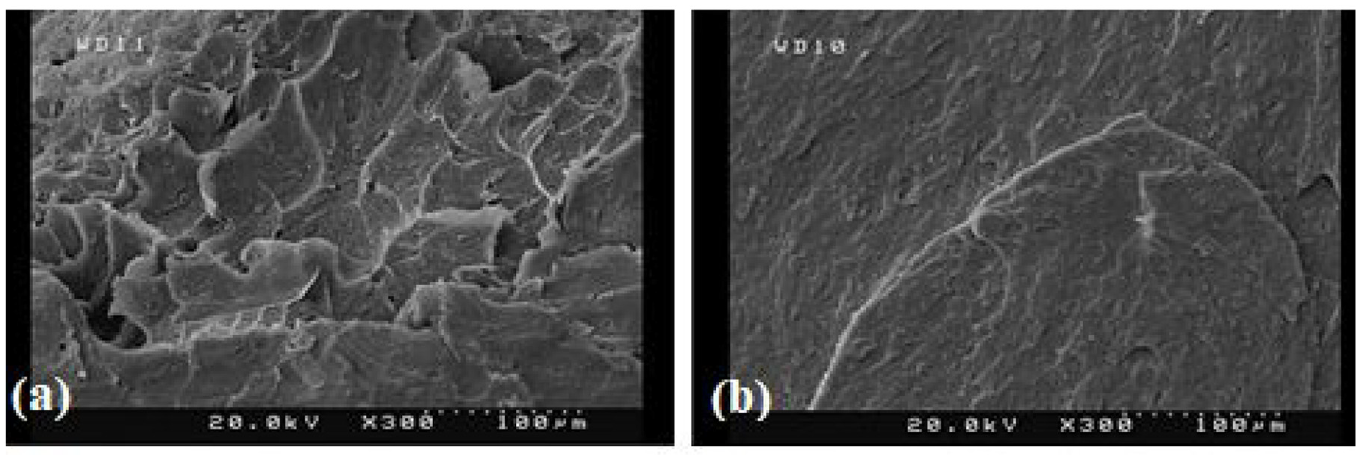
SEM image of surface topography of: (a) as-printed sample and (b) USPed with optimum setting.
Hardness distribution
The hardness distribution of as received AM material, and those processed by USP under optimal set have been demonstrated in Figure 10. According to the presented results, it is seen that the surface hardness of as-printed sample is about 225 V; it increases up to 403 V when the USP process with setting #1 is applied to the surface. Thus, an improvement about 74% obtained when USP with optimum setting is applied to as-printed material. The reason can be attributed to the grain refining where the columnar coarse grains in AM material converted to equaixed type that leads to enhanced surface properties. On the other hand, from the EBSD analysis presented in Figure 8, formation of martensitic phase as result of sever plastic deformation has also contribution in hardening of surface and beneath layers. Another point that is interpreted from Figure 10 is the depth where the layers beneath the surface are hardened. It is seen that applying USP on as printed sample results in hardening of surface layers up to the depth of 800 μm.
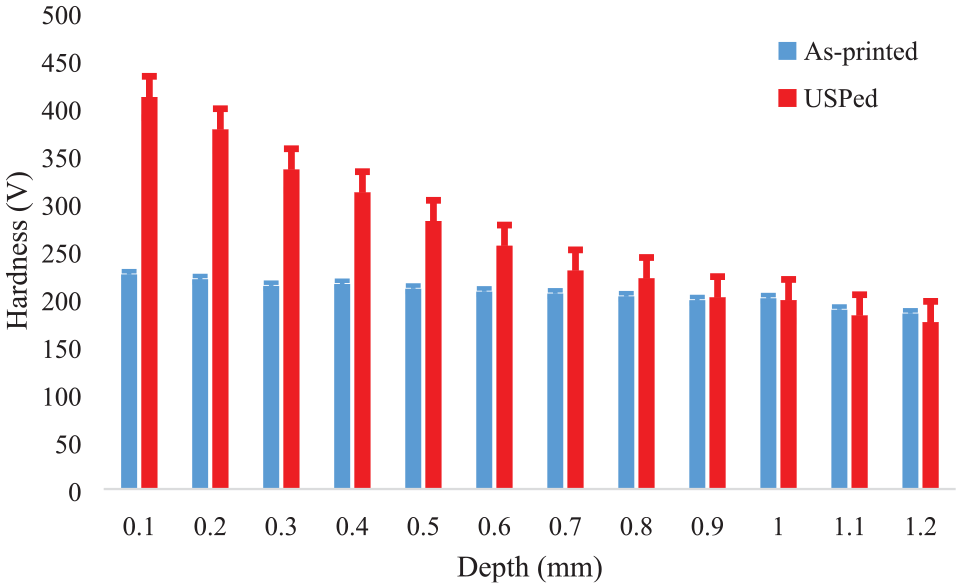
Through depth hardness distribution of the as-built sample, and USPed under optimum condition.
Residual stress distribution
Through depth residual stress distribution of the as-printed material and USPed sample under optimum processing condition has been illustrated in Figure 11. It is seen that for as printed sample, the tensile residual stress exists in surface and subsurface layers up to depth of 0.4 mm. The magnitude of tensile residual stress varies from 451 MPa at surface to 104 MPa at the depth of 0.3 mm. By applying the ultrasonic shot peening with optimum processing condition, the compressive residual stress is generated in the surface of the sample with magnitude of 529 MPa. The magnitude of compressive residual stress increases and reaches to 550 MPa at the depth of 0.1 mm. At deeper layers, the amount of compressive residual stress decreases and becomes tensile with magnitude of 96 MPa at the depth of 0.6 mm. Microstructure refining and subsequent work-hardening of surface layers results in reduction of distance between crystalline planes that yields formation of compressive residual stress in surface and sub-surface layers.
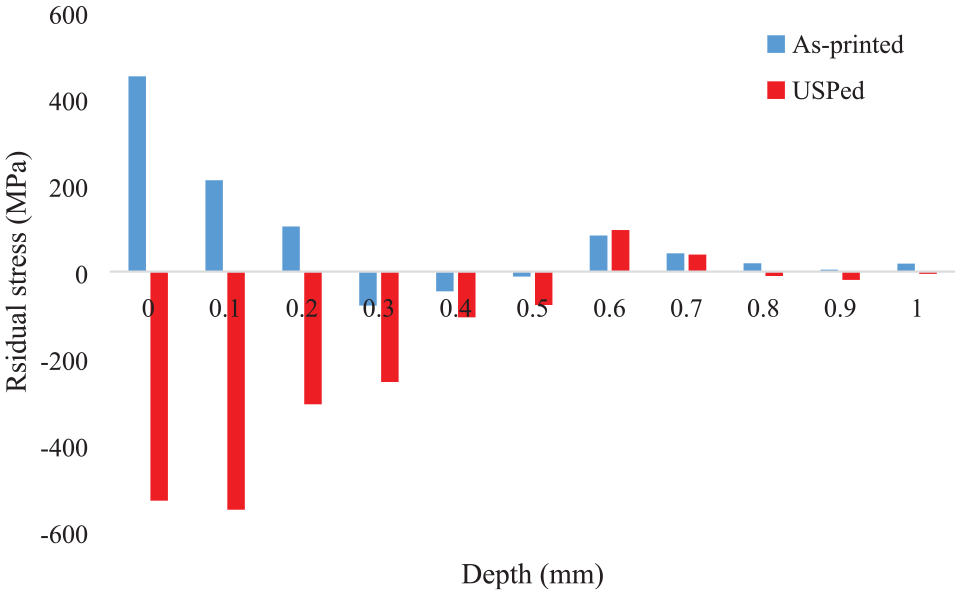
Through depth residual stress distribution of the as-printed and USPed samples.
Corrosion resistance
In order to compare the corrosion resistance of AM samples and those USPed with optimum settings Tafel plots of the as-printed and USPed samples have been provided and presented in Figure 12.
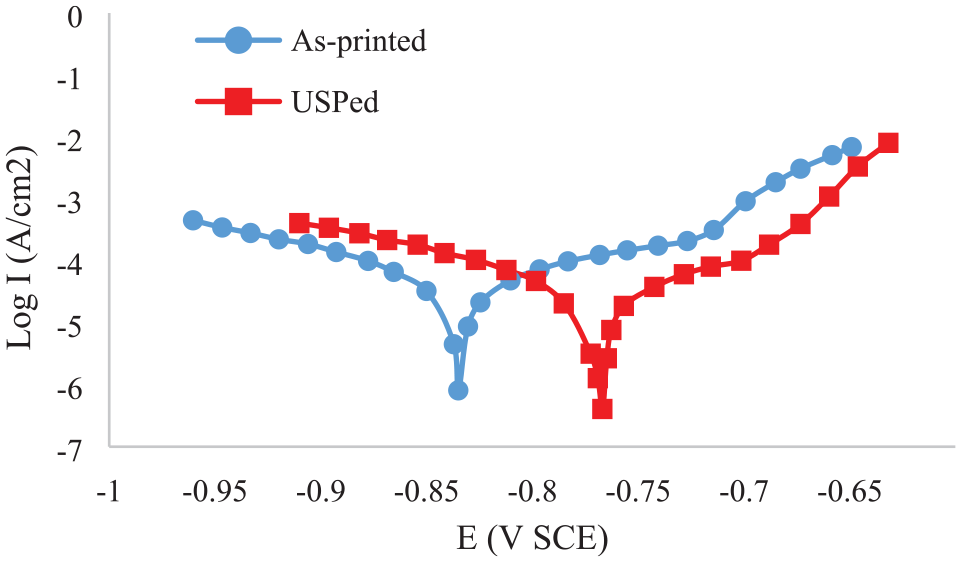
Tafel plots of as-built and USPed samples.
Generally, the material with more positive potential and less current density is stronger against corrosion in electrochemical cell. It is seen from Figure 12 that applying surface sever plastic deformation on built material causes shifting of Tafel curve to the right and down (further corrosion potential and less corrosion current density) implying enhanced corrosion resistance.
Formation of rough surface with lot of porosity, in addition to existing the tensile residual stress in surface and subsurface layers are identified as main reasons for low corrosion potential and high corrosion current density (i.e. weak corrosion resistance) of as-printed material. Surface severe plastic deformation caused by optimum USP results in shifting of south-east because of formation of smother surface, dense structure, and compressive residual stress.
Conclusion
From the analysis of variances, it was obtained that for corrosion rate, the sequence of process time, ultrasonic power, and ball diameter determines the values. Ultrasonic power followed by process time and ball diameter determines the variation of surface roughness values. Also, the values of hardness and surface compressive residual stress are determined by sequence of ball diameter, process time, and ultrasonic power.
It was obtained from optimization the results that there is a transition point that after that by increasing the energy consumption no further improvement in values of corrosion rate, surface compressive residual stress, surface roughness and hardness are observed. This point was selected as optimum setting that corresponds to the data #24 in the design matrix with input condition of ultrasonic power of 60%, process time of 10 min, and ball diameter of 6 mm.
By applying the USP at optimized levels to as-printed sample, the surface corrosion rate is enhanced about 120% (from 4.5 μm/year for as-printed material to 2.1 μm/year for USPed sample). It thanks to surface smoothing where roughness is improved up to one-third (i.e. 66% reduction), formation of compressive residual stress in surface and subsurface layers (from 451 MPa surface tensile residual stress to 529 MPa surface compressive residual stress), and hardening because of grain refining and phase change (which causes hardness enhancement from 225 to 410 V at the surface).
Footnotes
Declaration of conflicting interests
The author declared no potential conflicts of interest with respect to the research, authorship, and/or publication of this article.
Funding
The author(s) disclosed receipt of the following financial support for the research, authorship, and/or publication of this article: The authors would like to thank the Deanship of Scientific Research at Umm Al-Qura University for supporting this work by Grant Code: (22UQU4410120DSR01)