
Abstract
Cutting force prediction is the key issue for planning and optimising the machining process. To explore the cutting of difficult-to-machine 1Cr13 martensitic stainless steel, an orthogonal test was conducted to study the cutting force and surface roughness under the dry, full-width milling. In addition, an empirical model, applied to the exponential forms of the cutting force and surface roughness of 1Cr13 martensitic stainless steel, was established by data processing and linear regression. It can be seen that the significance levels of the influence of cutting parameters on cutting force, surface roughness were cutting depth
Introduction
Numerical control (NC) milling machining has been widely used in aerospace, automotive, machinery applications and so on. With industrial development, the demand for stainless steel materials is increasing. As a corrosion-resistant, high-strength material containing chromium, nickel and titanium alloy, stainless steel has been used in various industries, including the military, medicine, food, and water conservancy. To ensure the quality of NC milling of stainless steel components, it is necessary to analyse the factors influencing the cutting force. Besides, it is worth while analysing the various physical phenomena generated during machining, for example, cutting heat, workpiece deformation, tool wear and breakages. In this way, the design accuracy of the whole process, including fixtures, cutting tools and machine tools, can be improved to provide a basis for formulating the cutting parameters and optimising the geometric parameters of the tools used. 1
Common milling force models are empirical, mechanical, finite element (FE) and neural networks based on artificial intelligence and so on.2–5 In terms of milling force modelling for stainless steel, through the single factor experiments testing the influence of the factors, including milling depth, line space and feed per tooth, on milling force, three-dimensional (3D) milling force data were obtained by Li et al. based on the characteristics of stainless steel materials. The mathematical model for calculating the milling force of stainless steel was established using multivariate linear statistics. In addition, the data calculated by the model were compared with experimental data to validate the mathematical model. 6 Chen et al. 7 described the influence on the surface roughness of a milling workpiece of the following factors: cutting speed, spindle speed, feed per revolution and milling width, using a roughness prediction model established according to the principle of the least square support vector machine (LS-SVM). Moreover, Shao et al. conducted face milling of 1Cr18Ni9Ti austenitic stainless steel within a wide range of cutting speeds by a uniform experiment design. On this basis, they established empirical equations for cutting force and surface roughness by exponential and quadratic polynomial regression, respectively. 8 However, solid carbide end-milling is widely used in most current experimental studies involving the processing of stainless steel materials, while there are few data published from experimental studies using inserted coated carbide end-milling. It is necessary to analyse plentiful cutting test data from specific materials to build a mathematical model fitting practical cutting force and surface roughness values.
As indicated by the theoretical analysis and research into cutting forces for metals, an effective reliable model could be obtained through cutting experiments on specific materials and sufficient data analysis thereafter. The authors carried out theoretical and experimental studies of the force and its regularity during the milling of 1cr13 stainless steel. The parameters for cutting force and surface roughness influenced by the three factors, namely, cutting speed, feed per tooth and cutting depth, were obtained by a multifactor orthogonal experiment design. In addition, mathematical models of the cutting force and surface roughness, as influenced by cutting speed, feed per tooth and cutting depth, were established using probabilistic methods, such as the least squares method, with regression analysis also used to test the significance of the relationship and its coefficients. On this basis, the influence of cutting parameters on milling force was analysed to predict and control the cutting force during process design to finally improve the quality of the milled surface.
Cutting force in the milling process
During full-width milling, the cutter tooth makes contact with the workpiece at around Point A. The cutting thickness first increased and then decreased in each cutting process. The entry angle of the cutter tooth,
During milling with a multitooth revolving tool,


Schematic of the cutting forces: (a) Cutting thickness at the cutting-in point was zero, (b) Cutting thickness increased gradually, (c) Maximum cutting thickness, and (d) Cutting thickness decreased gradually.
During cutting process, the carbide end-mill was influenced by radial force
Experimental conditions
Workpiece materials
In the experiment, 1Cr13 stainless steel square stock with a length, width and height of 200, 200 and 100 mm, respectively, was used. The mechanical properties were as follows: tensile strength
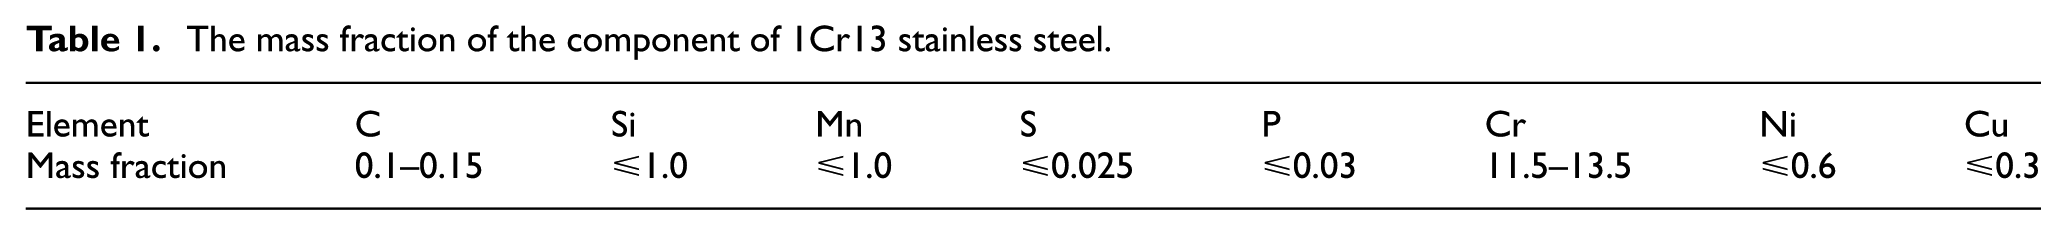
The mass fraction of the component of 1Cr13 stainless steel.
Cutting tool materials and geometrical parameters
TiAlN_ carbide tool with 10 µm of composite coating produced by Lamina Company, Switzerland was used to process the 1Cr13 stainless steel. In addition, it had two teeth and the types of arbours and blade were 90W25-3K13 and APMT 1135 PDTR LT30, respectively. The geometrical parameters of the blade were as follows: front angle 9°, back angle 16°, inclination angle 4°, minor back angle 17°, end-cutting edge angle 4°, corner radius 0.5 mm and cutting edge angle 90° after installing a blade (see Figure 2).

(a) Geometrical parameters of the blade and (b) outline drawing of arbour and blade.
Cutting experiment
The cutting experiment was performed on an NC milling machine (XKA714), where the cutting speed was adjusted by changing the spindle speed. The measuring system for milling force in the experiment comprised a Kistler 9255C 3D dynamic piezoelectric dynamometer, Kistler 5058 charge amplifier, and DynoWare Type 5697 data acquisition and processing system. The measuring system for acceleration comprised a DH131E vibration velocity transducer, DH5922N data acquisition system and DHDAS2013 software. The measuring systems for milling force and vibration acceleration are shown in Figure 3. A JB-4C roughness tester was used for roughness measurement. Five points for each parameter were selected to measure roughness values, where the length of each sample was 0.8 mm and the evaluation length was 4 mm. The average roughness was selected as the final result. A full width was used during cutting (16 mm). The sampling frequency was set to 1000 Hz during dry cutting.

Experimental set-up: (a) experimental principle and (b) experimental process.
The research aimed to establish empirical equations for the cutting force and roughness of high-speed milled 1Cr13 stainless steel by an APMT 1135 PDTR coated carbide tool and also analyse the influence of each cutting parameter on the cutting force and roughness. An orthogonal test method with four levels and three factors was used, including the following test variables: cutting speed v, feed per tooth f and cutting depth
The factors and levels of milling experiment.

Experimental results and analysis
The orthogonal milling test results are presented in Table 3. The first 16 test parameters were used for modelling, while the rest, namely, those from No. 17 to 20, were used to verify the model.
Test table and test results.

Figure 4 shows the time-domain signal of the cutting force under the following cutting parameters:
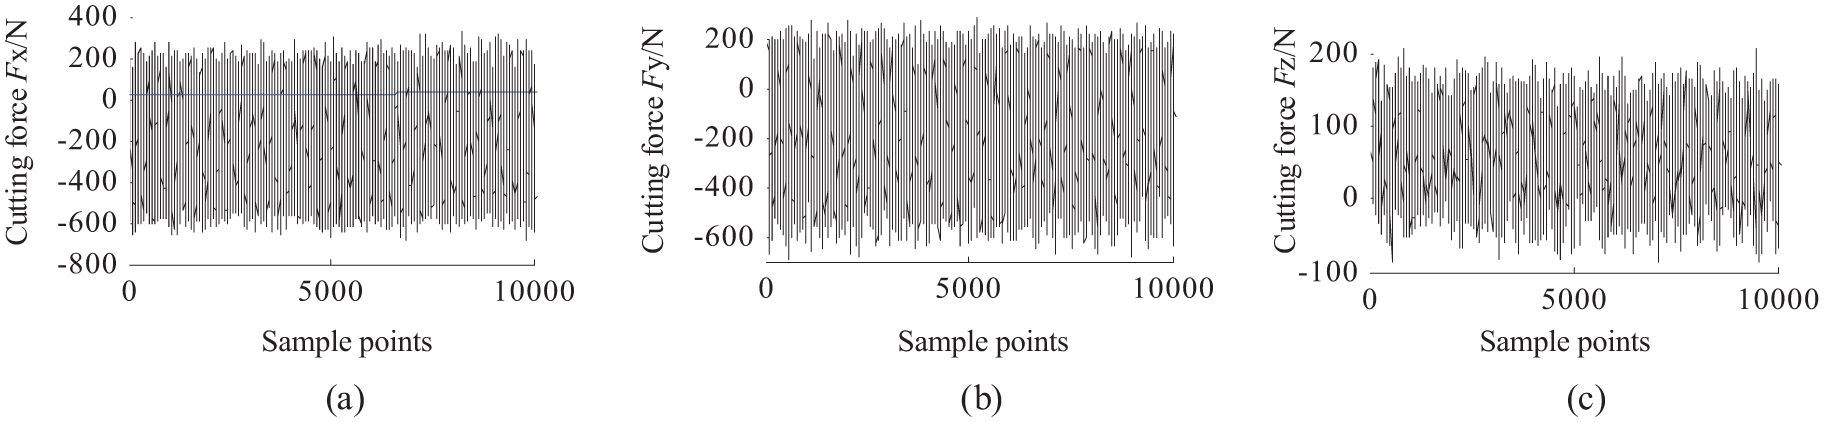
The time-domain signal of cutting force: (a) Fx, (b) Fy, and (c) Fz.

The acceleration signal: (a) x-direction, (b) y-direction, and (c) z-direction.
From Figures 4 and 5, it can be seen that the fluctuation of cutting force and vibration amplitude in the x-direction were at their maximum, while those in the z-direction were at a minimum. This was because the x-direction was the major cutting force direction, which meant that the maximum feed resistance was born by the tool came from the x-direction during cutting. Meanwhile, with the combined effect of factors such as the elastic recovery, the workpiece friction and the shock of the workpiece materials in an intermittent cutting process, different cutter teeth revealed periodical direction fluctuations, while the overall curve was quasi-sinusoidal. Owing to the cutting method being end-milling, rather than full-width cutting in the y-direction, the cutting forces in y-direction were periodical direction fluctuations under both the effect of elastic recovery of the workpiece, tool-workpiece shock and cutting into the workpiece by the tool. The cutting force in the z-direction was entirely a back-resistance from the workpiece resisting tool penetration with consistent direction and slight amplitude fluctuations. So, the cutting force in the z-direction was deemed continuous.
By comparing the experimental error, it can be found that the error of the cutting force test is much smaller than that produced by the cutting vibration test. This is because the cutting vibration signal is easy to be affected by the vibration of mechanism of the machine tool. So, the cutting force signal can be used to build the model, which is more accurate than that of the cutting vibration. 9
From the above analysis, the cutting force of milling is periodic. Common data processing methods include the average cutting force method and the maximum cutting force method. The maximum cutting force method is more convenient, which can reflect the variation of the cutting force but cannot reflect the changes in the size and trends of force. The average cutting force method is adopted in this article. For the sake of simplicity, the average cutting force is referred to as the cutting force.
Establishing empirical equations
The cutting force F and


where
The experiment aimed to obtain the exponents and constants of the formula by experimental data regression, so as to establish empirical equations for cutting force and surface roughness. To facilitate calculation, logarithms were taken on both sides of equations (2) and (3)


Order
Then,
The multiple linear regression equation was established

Among them,


On the basis of the data obtained by orthogonal test and the aforementioned equations, the coefficients of each cutting parameter could be obtained to acquire the cutting force in three directions and surface roughness as follows


The influence of cutting parameters on cutting force and surface roughness
The significance of the regression equation was verified by F value test. It was stipulated by F value test that there were m experimental factors and they were tested n times. The significance level was pre-set to 0.05. If
Analysis of variance.

As shown in Table 4, the F values of the regression equations for the milling forces in three directions and surface roughness were greater than
The influence of cutting parameters on milling force
Changes in cutting force for combinations of cutting speed and feed per tooth
With the condition that the cutting depth was fixed at

The 3D surface plot of the changes in cutting force with changing v and f: (a) Fx, (b) Fy, and (c) Fz.
In conclusion, on the premise that the metal removal rate was fixed, it was more favourable to increase the cutting speed and decrease the feed per tooth.
Changes in cutting force for combinations of feed per tooth and cutting depth
On the condition that the cutting speed was constant (i.e.
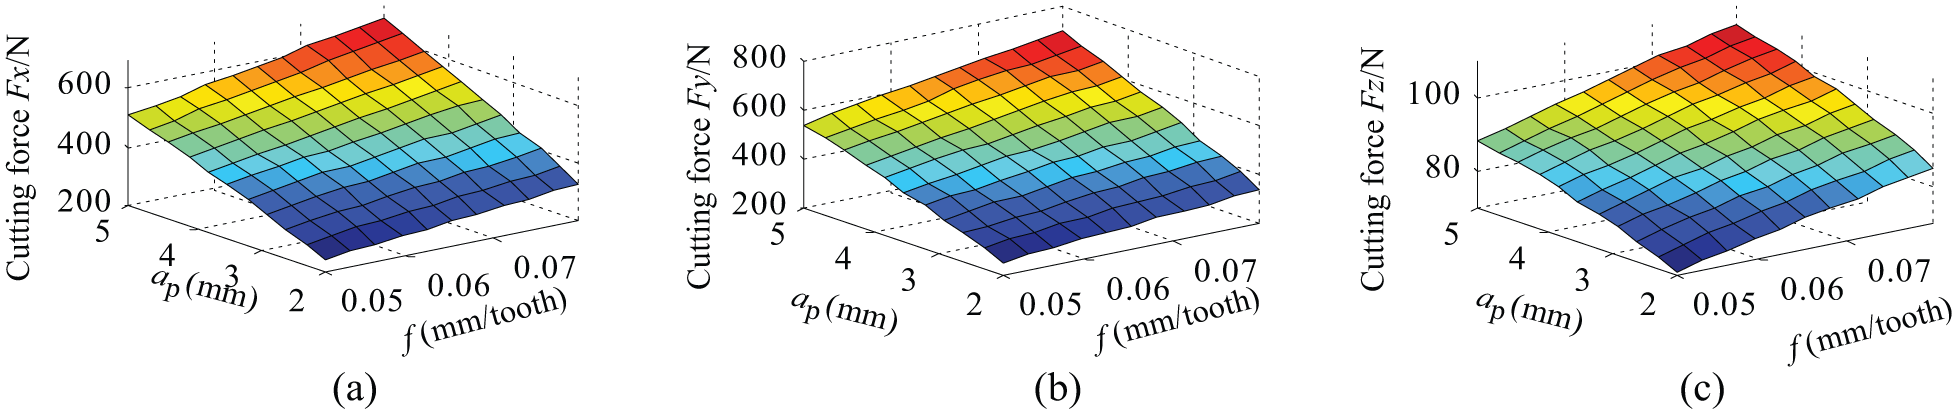
The 3D surface plot of the changes in cutting force with changing
From the perspective of the deformation mechanism governing the metal cutting process, mobile phases around the major and minor cutting edge mutually interfered under non-free cutting conditions. The result of cutting interference could change the linear relationship with steady cutting force. Because the extent of the participation of the minor cutting edge was closely related to cutting depth, the feed per tooth directly affected the extent of the cutting deformation and flow velocity, so it was completely possible to induce non-linear characteristics to the cutting force by the interaction between cutting depth and feed per tooth in high-speed conditions. 10 Because the interaction between feed per tooth and cutting depth failed to be reflected by the linear regression model, the significance levels of the two parameters were high. It was thus necessary to analyse the influence of the interaction between the cutting parameters on the cutting force. From the contour lines in Figure 8, it can be seen that the contour interval changed. This proved that the interaction between feed per tooth and cutting depth significantly affected the cutting force.
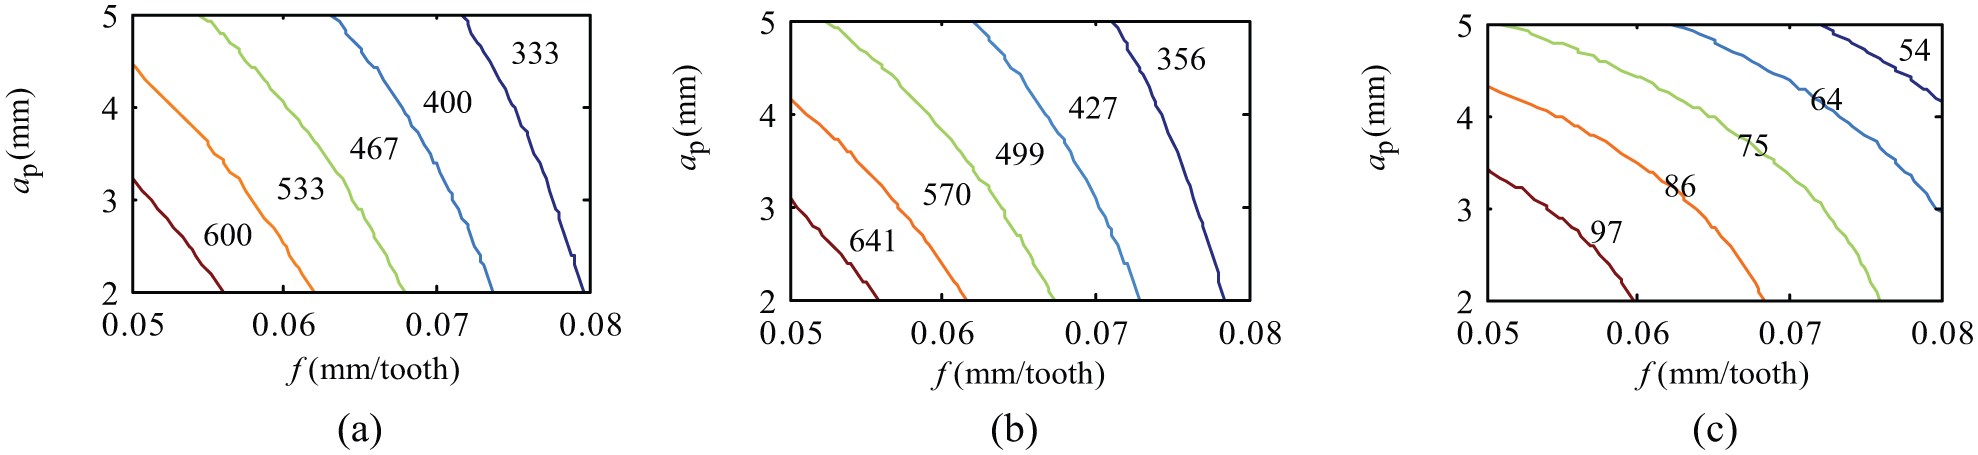
The contour lines: (a) Fx, (b) Fy and (c) Fz.
Changes in cutting force for combinations of cutting speed and cutting depth
If the feed per tooth was constant, namely,
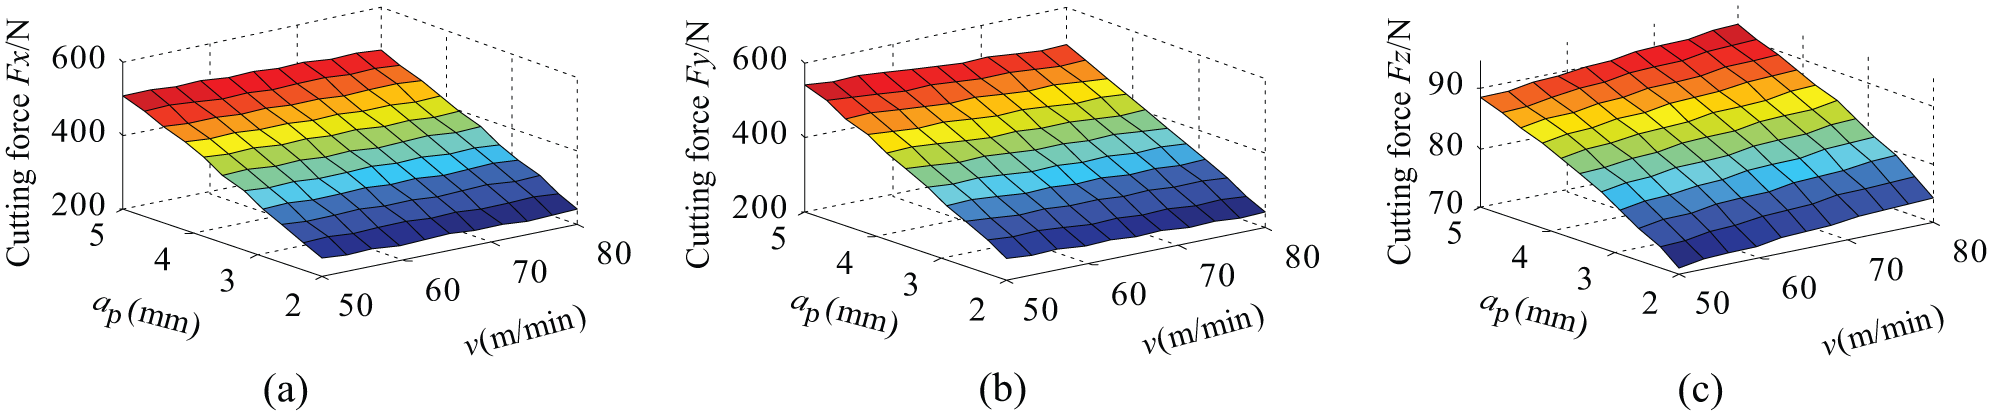
The 3D surface plot of the changes in cutting force with changing
The influence of cutting parameters on surface roughness
Surface roughness is an important parameter in the evaluation of the surface quality of high-speed and fine-machined components. The roughness affects the wear resistance, corrosion resistance and fatigue resistance of such components. At the same time, the assembly precision and quality of components are also affected. The surface roughness is influenced by many factors, while selecting the cutting parameters is the main factor on the condition that the other process parameters are given. Figure 10 shows the effects of changes in the cutting parameters on the surface roughness. From the isoline of cutting depth, it can be seen that when

The 3D surface plot of the changes in surface roughness with changing
Verification
The parameters for this verification test are shown in Table 3 (from No. 17 to 20). As required, they cannot be the same as the parameters used in the orthogonal test but were selected randomly. The comparison curves are shown in Figure 11. Although there was difference between the predicted and experimental values, this was less than 6%. It suggested that the prediction accuracy was high, and thus, the predicted values could form a reference for reality. Thereby, the established empirical equations for cutting force and surface roughness proposed in this research had some practical significance.

The verification test: (a) Fx, (b) Fy, (c) Fz, and (d) Ra.
Conclusion
Based on the empirical model analyses and the experimental results, the following conclusions were drawn:
Among the cutting parameters, the influence of cutting speed on the cutting force and surface roughness was the lowest, followed by feed and cutting depth. Hence, it was necessary to select the following cutting parameters for actual machining: a high cutting speed, a low feed rate and a shallow cutting depth.
The changes in cutting force were predicted by the proposed statistical model of the metal cutting process. Each cutting component force could be predicted and controlled by regression analysis using the proposed cutting force model, which provided a powerful tool in the prediction of cutting force and the optimisation of cutting parameters.
There were some differences between the predicted cutting force and surface roughness of the corresponding empirical equations established on the basis of test data and actual values. However, the difference was less than 5%, which suggested that these equations offered an accurate prediction.
Footnotes
Academic Editor: Ramoshweu Lebelo
Declaration of conflicting interests
The author(s) declared no potential conflicts of interest with respect to the research, authorship, and/or publication of this article.
Funding
The author(s) disclosed receipt of the following financial support for the research, authorship, and/or publication of this article: This project was supported by National Natural Science Foundation of China (Grant No. 51465029). The authors thank Lanzhou Science and Technology Bureau for their support (Grant No. 2014-1-166) and Lanzhou talent innovation and entrepreneurship Project (Grant No. 2015-RC-4).