
Abstract
Drivers usually show different driving styles in a transportation system. In analyzing the explicit linkage between driving style and driver’s dynamic demand, driving style can be classified into sports, moderate, and economical types. The sum of current driving resistance and the absolute value of its change rate is chosen as a measurement of driver’s dynamic demand. The influence of subjective and objective factors on driver’s dynamic demand has been analyzed. Single-exponential smoothing is adopted to predict the overall and staged driving style based on historical driver’s dynamic demand data. The most prominent advantage of the proposed prediction method is that there is no need to store significant historical data while considering the importance of each period data. The vehicle test scheme of driving style recognition method is designed including the test vehicle and drivers’ selection, driving route and task design. Test results show that driving style can be identified accurately with no additional sensors using the proposed method, and it can be used to quantitatively analyze the influence of different factors on driving style through statistical analysis. According to recognition results, automatic transmission shift point can be corrected to improve the adaptability of gearshift strategy for different driving styles.
Keywords
Introduction
Cars travel in a complicated and closed-loop driver–car–environment system in which driver manipulation and driving environment determine the driving state of the car. Driver as one of the most unstable main factors often exhibits different styles during the driving process. On one hand, drivers generally get into a habitual behavior called driving style for long-term driving. On the other hand, drivers usually make real-time adjustments of their driving behavior based on environmental information, which is driver’s instantaneous intention. The complexity of driver’s behavior and the large number of factors affecting it constitute the primary root of the fact that the development of a comprehensive and more widely applicable driver model constitutes a thing of the future. 1 The appropriate analysis of signals through which the driver affects the vehicle offers a possibility for the establishment of driving style and, subsequently, identification of the behaviors in the human–vehicle–environment system. On the basis of this information, the control system is capable of selecting the most applicable control algorithm along with the parameters of engine and transmission operation which are best suited to the expectations of the driver.1–6
Driving style is one of the evaluation indicators of driving behavior, and researchers have conducted in-depth studies on driving style from the aspect of the drivers modeling,7–9 driving behavior,10,11 classification,1,3,12,13 identification methods,12–14 and so on; these studies have achieved fruitful research results. Many research methods and ideas are worthy of reference. Fuzzy reasoning is a common method of identifying the driving style;15,16 the fuzzy rule of the driving style identification is mainly based on the knowledge and experience of experts and their observations, statistics, and analysis of the manipulation of the driver. However, the initial design of the fuzzy rules is generally needed for continuous experimental verification, modification, and optimization, and the reasonableness and completeness of the rule base are susceptible to human factors. The driving style identification method 12 based on a neural network is feasible, but the performance of this type of identification method relies on the structure of neural network, which is closely related to the quantity and quality of learning samples. Different scholars use distinctive methods to study the identification and classification of driver behavior patterns. For example, Tricot et al. 17 used the method of multiple correspondence analysis and discriminant analysis to identify the driving style and extent of traffic congestion, which could be used to prevent accidents. Rygula 18 proposed the method of using the data of the logger on cars to identify the driving style. Karginova 14 used K-nearest neighbor algorithm and neural network algorithm to detect the driving style intensity of bus drivers, which could be used to detect and prevent bus faults. This study provides a new way of thinking about the identification of driving style.
This study conducts theoretical and experimental research on identifying the driving style based on dynamic requirements. First, we analyzed the subjective and objective factors affecting driving style. After analyzing the explicit linkage between driving style and driver’s dynamic demand, driver’s dynamic demand was defined based on driving resistance according to vehicle driver–resistance balance equation. Exponential smoothing was used to establish the predictive model that could be used to identify the driving style based on the historical driver’s dynamic demand data. Finally, real vehicle test was designed including the test vehicle and drivers’ selection, driving route and task design to verify the correctness and feasibility of the proposed method. From the perspective of practical engineering, this study aims to realize an effective driving style identification method with no additional sensors to improve the vehicle adaptability of drivers and enable an automatic transmission gear decision system to meet the requirements of various driver personalities.
Driving style classification and analysis of its influential factors
Augustynowicz 1 presents a method of preliminary driver classification, which applies two-criterion-based analysis of the phenomenon of driving style. Then, the drivers can be ordered from the most active to the extremely mild according to their driving style. The classification of the drivers along with the measurement data registered during road tests provided the foundation for later modeling of a dynamic classification of the driving style. Ge et al. 19 put forward dynamic factor to describe driving style, whose value is between 0 and 1. And dynamic factor is calculated using fuzzy inferior based on the accelerator pedal opening and its gradient under starting condition and vehicle deceleration under braking condition. If dynamic factor is 0, the driving style is economical. If dynamic factor is 1, the driving style is sports. According to this method, we categorize driving style into three types, namely, sports, moderate, and economical, based on the pursuit of the driver for vehicle performance and fuel economy. The driving behavior of sports driving type is always intense and active. They usually show pursuit of the vehicle dyna-mic performance instead of fuel economy. Therefore, they will prefer large throttle opening and change the position of the accelerator pedal intensively. And the high vehicle speed on shift point will be suitable for sports driving style on condition that it meets the constraint of maximum engine speed. On the contrary, the driving behavior of economical drivers is always gentle and mild. They pay more attention to the vehicle fuel economy. Accordingly, they often use medium-sized or small throttle opening to meet the performance requirements and change the position of the accelerator pedal smoothly. And the relatively low vehicle speed on shift point will be suitable for economical driving style on condition that it meets the constraint of engine speed. Moderate driving style falls in between them. Aggressive drivers usually show sports driving style, and cautious drivers often tend to show economical driving style. It is generally acknowledged that the depth of the accelerator pedal reflects the demand of the driver for the current vehicle driving force. Moreover, pedal change rate reflects the demand for fierce change degree of vehicle driving force. Therefore, driving style reflects the demand of the driver for vehicle dynamics and its intensity change. Current vehicle dynamics and the change degree can be used to evaluate and analyze the driving style. We can obtain the conclusion that driving style is closely related to the driver’s dynamic demand.
Driving style refers to a set of driving habits formed in the process of long-term driving. We generally think that driving style determines the driving maneuvers; correspondingly, driving maneuvers is the embodiment of driving style. Factors that affect driving style can be divided into two categories, namely, subjective factors and external objective factors. Table 1 summarizes the main factors that influence driving style and provides examples of each of these factors. At the same time, sports and economical are used to describe the driving style tendency of the driver influenced by these factors.
Analysis of driving style influential factors.

Definition and analysis of driver’s dynamic demand
Definition
Basic principle
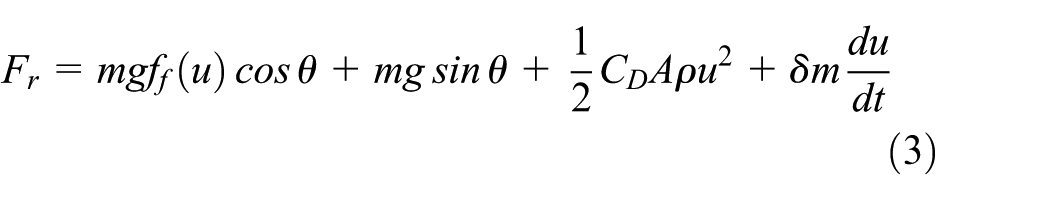
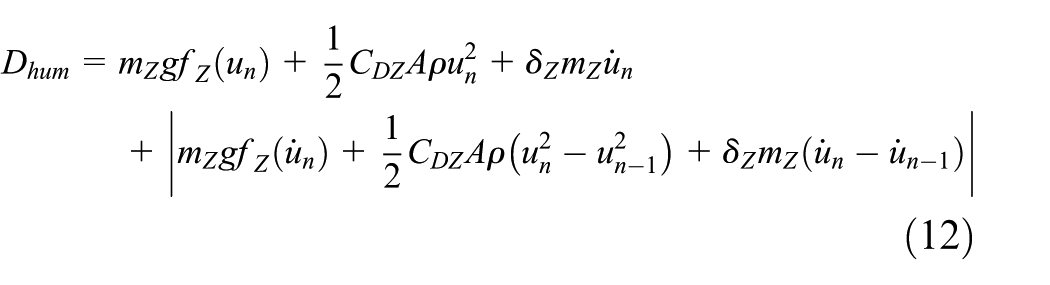
As previously mentioned, driving style reflects the driver's dynamic demand and its intensity change during vehicle driving process. According to vehicle driver–resistance balance equation, 20 the vehicle driving force is equal to the sum of the driving resistance, which includes rolling, air, ramp, and acceleration resistances. Therefore, this study defines the dynamic requirement of the driver as the sum of the current driving resistance and absolute value of its change rate

where

where m is the vehicle mass, g is the gravity constant,
The following equation can be obtained from formulas (1) and (3)
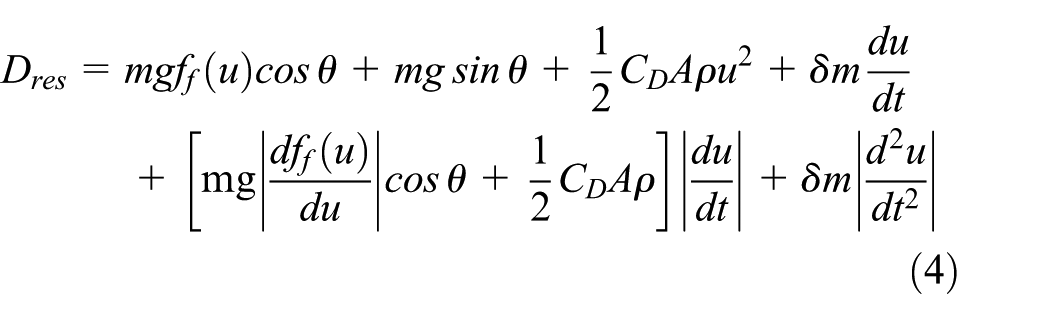
Rolling resistance component:
Ramp resistance component:
Air resistance component:
Acceleration resistance component:
Jerk resistance component:
These components are unary or binary functions of speed, acceleration, and jerk which can be used for the measurement of driver’s dynamic demand.
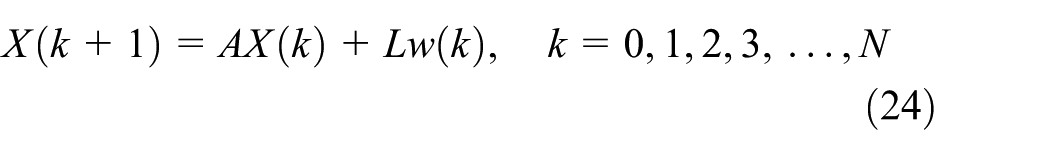
Real-time algorithm
If we set

Therefore
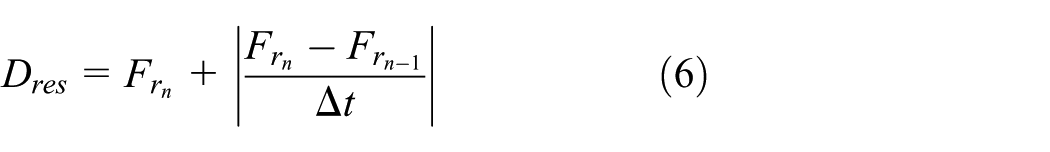
Assuming that the rolling resistance coefficient is estimated by using the unary functional form and the change of slope is small within a time interval. We set

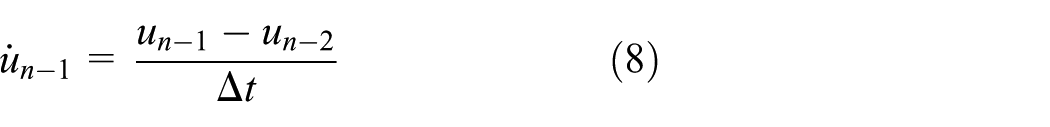
Therefore, we can derive real-time calculation formula of

Equation (9) is the real-time calculation formula of
Analyses of influential factors
Driver’s dynamic demand involves two aspects, namely, subjective factors and external objective factors. However, the driver’s dynamic demand cannot distinguish these factors based on the definition. Thus, discussing the influence of these factors on driver’s dynamic demand is necessary to separately analyze the influence of subjective and objective factors on the driving style.
Influence of subjective factors on driver’s dynamic demand
The subjective factors of the driver mainly affect the driving style under normal weather conditions and straight-line driving on a flat and asphalt concrete pavement without braking. At this time,

where
As defined in the

where
Referring to the discretization calculation method of
Influence of external objective factors on driver’s dynamic demand
When the conditions of the standard operation change,

where
1. Load effects on driver’s dynamic demand. When the standard operating mode changes from no load to the load state of the car, assuming the increased load is

Formula (14) shows that
2. Ramp effects on driver’s dynamic demand. When the standard operating mode changes from level road to hill,

Formula (15) shows that
3. Rolling and air resistance effects on driver’s dynamic demand. Using the same analysis method, the vibrational drag and rolling coefficient are added to the standard condition. Based on the equations of

Equation (16) provides the comprehensive quantitative results of
Formula deformation for real-time computation
The growing complexity of engine control systems and integration with transmission and vehicle dynamics control systems have led to the use of torque-based engine control. Engine output torque value can be obtained from CAN bus in real time. In order to realize recognition algorithm easily in practical, driver’s dynamic demand can also be indicated in the form of driving torque. For stepped automatic transmission, the drive torque can be expressed as follows

where
According to driver’s dynamic demand definition, it can be expressed as formula (18)

where the unit of
Similarly,


where the unit of
The resistance torque in equation (19) can be calculated through simulation according to the existing vehicle parameters, but these values are imprecise and cannot be used in actual application directly. Therefore, vehicle tests are conducted to obtain accelerating, aerodynamic, and rolling resistance torques under standard road condition, which can be used for the calculation of
Parameter calibration of accelerating resistance torque.

Calibration of aerodynamic and rolling resistance torques.

Driving style recognition based on driver’s dynamic demand
The overall driving style of a driver is nearly constant throughout his or her entire driving career, but the driving style shows staged changes because of working condition changes, driving tasks, and other factors during driving the driving process. A driving style recognition program based on
The single-exponential smoothing method 21 has been used in this study to recognize the driving style. This method is suitable for forecasting something with a steady moving trend. In addition to this point, the most prominent advantage of the proposed prediction method is that there is no need to store significant historical data while considering the importance of each period data. The prediction model using single-exponential smoothing has been shown as follows

In equation (21),

In equation (22),
Determination of smoothing coefficient
A smoothing coefficient is determined using the theoretical calculation method, which can be determined according to the following equation
In equation (23), n is the number of arrays used for predictions; the larger the n, the further the influences that the historical data have on the predicted results.
The historical data of a driving style recognition results change constantly, and the corresponding smoothing coefficient is very small according to the characteristics needed for long-term predictions. Therefore, these data should also have staged trends while reflecting the overall driving style of a driver. The unit time to calculate
Determination of an initial value
When the single-exponential smoothing method is used for prediction, different initial values
The offline predicted results that are set at different initial values for the same set of data are shown in Figure 1. The real vehicle road test has consumed 38 ms, and the actual initial value should be 162 N m. Figure 1 shows that different initial values affect the predicted results, but the predicted result finally becomes close to the actual driving style of the driver (approximately 160 N m) with the new value added constantly. A period of time is needed to adapt and learn, while the predicted results change from different initial values to actual values. The larger the smoothing coefficient α, the closer the actual value to the initial value and shorter the learning time. In the test, the learning time is approximately 25 ms when the initial value is set at an extremely unreasonable value such as 0. However, the learning time is approximately 15 ms when the initial value is set at 200. When vehicles leave the factory, the initial value should be set according to the driving styles of the target customers to reduce the learning time and enable vehicles to meet the driving style needs of the customers as soon as possible.
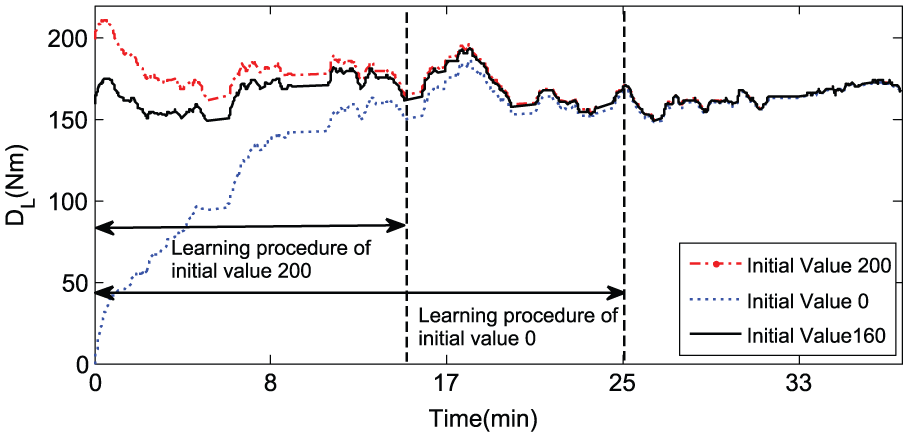
Effects of different initial values on driving styles.
The effects of shifting and braking must be considered in the driving style prediction. The original value should be retained during shifting and continue to be calculated after shifting and delaying for a period of time. In the same way, the original value should be retained during braking and continue to be calculated after braking.
Test and quantitative analysis
In order to verify the correctness of the proposed driving style recognition method, driving style recognition experiments are designed including the test vehicle and drivers’ selection, driving route and task design. According to the results, we can analyze the influence of subjective and objective factors on driving style recognition using statistical method and investigate the relation between driving style and shift point (vehicle speed and accelerator pedal opening).
Design of test
Test data recording system
The test data recording system is composed of hardware and software. The structure drawing of the hardware system is presented in Figure 2.

Structure of data recording system.
A test data recording system is responsible for collecting the vehicle CAN bus data and the traffic video information. The bus data are collected using CANoe, and the video information from the camera on the test car roof is transformed from input to the data terminal using IPEtronik M-SENS. IPEmotion is responsible for data monitoring and recording. Simultaneously, the vehicle CAN bus signal and the traffic video signal are acquired through two USB ports, which enable data synchronization.
Selection of test vehicle
Changing shift mode of a domestic micro AMT vehicle is adopted in this study. The chosen method changes the transmission control unit (TCU) internal procedures to disable the vehicle automatic shift pattern, and only the manual mode is permitted. Moreover, the shift request of the driver is responded unconditionally, which is called the pure manual mode of AMT. Under this mode, the driver must decide the shift time and change the gear by manipulating the shift lever. Thus, the shift intentions can be reflected. Every driver must drive for half an hour to eliminate the unfamiliarity of the driver with new vehicles and improve the accuracy of the test. The test then continues.
Selection of test driver
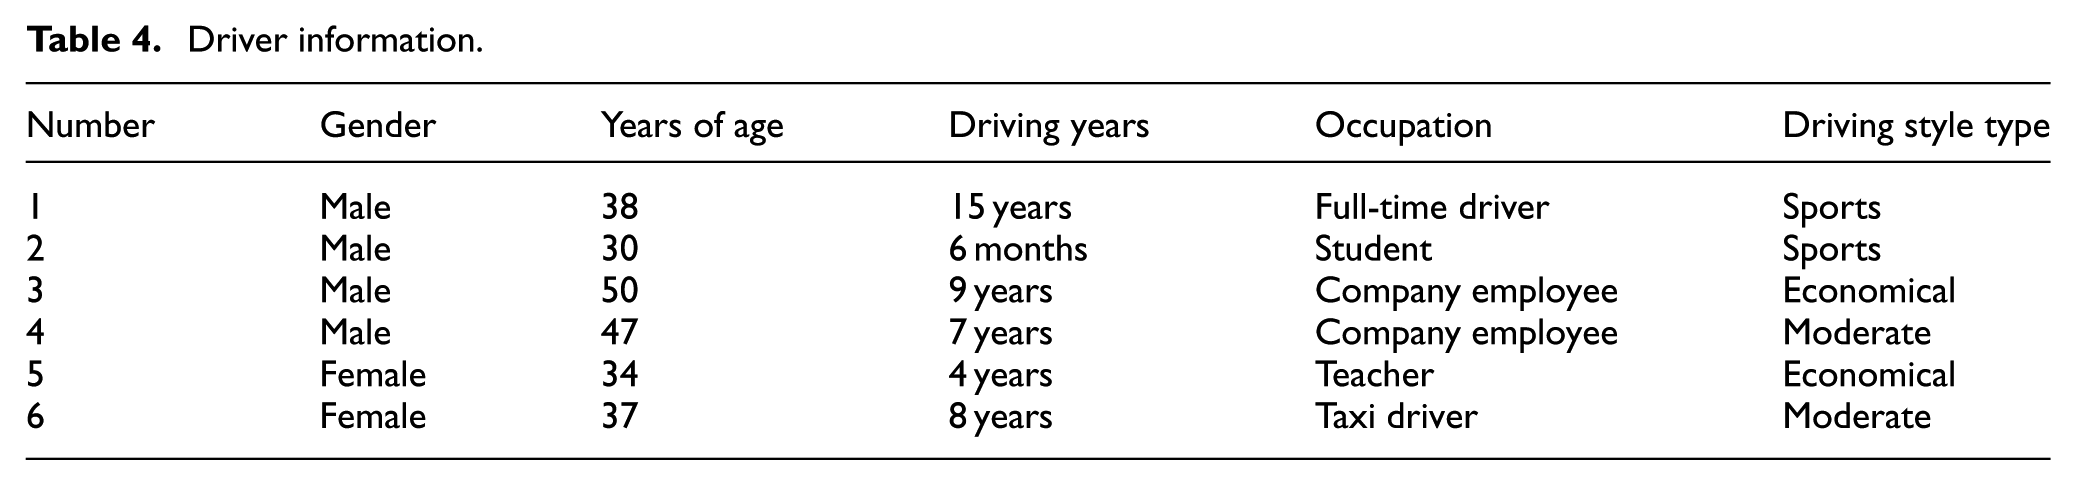
Before the test, in order to ensure the comprehensive analysis of different driving styles, we choose two drivers for each type of driving style according to the driving style classification method in Ge et al. 19 When choosing drivers for test, we have investigated their driving habit and personality characteristics. And the fuzzy inferior proposed in Ge et al. 19 is adopted to calculate the dynamic factor using the accelerator pedal opening and its gradient under starting condition and vehicle deceleration under braking condition according to the measurement data obtained during road tests. Then, we use the calculated dynamic factor to select the drivers for test. Therefore, chosen drivers’ driving styles are clear and specific according to investigation and calculation before tests. Table 4 provides the driver information. Many factors, such as gender, age, driving years, and occupation, are considered for driver selection. Finally, six drivers (four men and two women) are chosen to conduct the test, and two of these drivers are 47 and 50 years old.
Driver information.
Design of driving route
To study the influence of different driving cycles on the driving style, a variety of road conditions of great extent are included. After road investigation and analysis, Changchun city and its surrounding sections are chosen as the final test line, in which the starting and end points are the west gate of Jilin University Nanling Campus. The total length is 43.1 km, which is characterized by road conditions, such as traffic congestion, highway, traffic light waiting time, little traffic flow, and hilly terrain.
Design of driving task
In order to analyze the effect of driving task on driving style, when designing the driving task, three tasks are designed, as shown in Table 5, aiming at three types of driving styles. Faced with different driving tasks, driving style will change. Therefore, we design three tasks with different requirements, namely, safety and comfort, pressing and urgent, and common. In addition, the driving is under the assumption of a certain task.
Driving task design.

Estimation of acceleration based on Kalman filtering
Vehicle speed signal obtained during road tests has some noise interference due to pavement irregularity or accuracy of sensor. Therefore, acceleration directly calculated by the derivative of vehicle speed will not be accurate. According to the analysis of driver’s dynamic demand, the accurate calculation of acceleration and jerk (derivative of acceleration) are vital to the driving style recognition method. Kalman filter is widely used in data-filtering process as an optimal autoregressive data processing algorithm. In order to obtain accurate acceleration values, we use Kalman filter to estimate acceleration based on vehicle speed, which will not require the use of acceleration sensors.
The measured data sequence is a series of discrete points of interval of 0.3 s. Assuming the data length is N, the system state equation of vehicle longitudinal movement is first established
where


The system measurement equation can be established as follows

where
The initial state variables

where M is the Kalman gain matrix

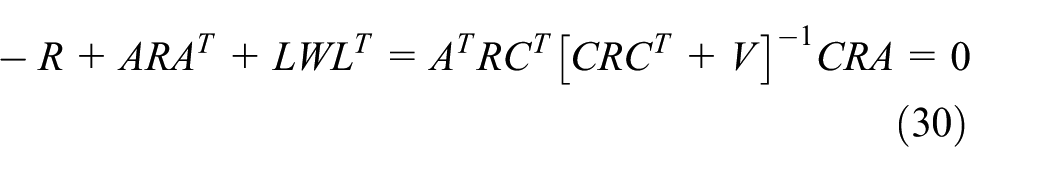
where R is the error covariance matrix of state variables, which is given by the positive definite Riccati equation
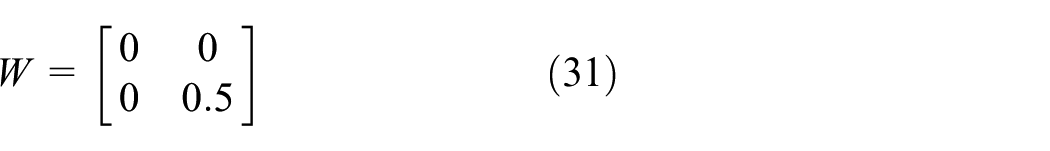
When using the Kalman filter to estimate acceleration, the covariance matrix of system noise and measurement noise should be set first. In the data processing of this experiment

After calculation, the Kalman gain matrix is


In the application, the estimation of acceleration and vehicle speed filtering result can be improved by adjusting the initial measurement error matrix.
Analysis of driver’s dynamic demand
The test is conducted on the road with uphill and downhill. In the test, driver’s dynamic demand
Driving phase on a level road. Driver’s dynamic demand is mainly influenced by subjective factors. As shown in Figure 3, the change in
Uphill road phase.
Downhill road phase. At the beginning of this phase, there is no braking action and vehicle speed is fast; thus,
Phase of driving on level road. The brake is still on to decelerate continually, so that

Driver’s dynamic demand test results.
The test results verified that
Analysis of driving style recognition
Figure 4 shows recognition results with a time of 10 min of a male driver under an ordinary driving task. The driving style can be considered as sports according to the curves of the accelerator pedal. The driving style of this male driver,

Driving style recognition results.
Figure 5 shows the driving style recognition results with 112 min under different road conditions, including car followings, congestions, beltways, and suburbs. As shown in this figure,

Driving style identification results under different road conditions.
Figure 6 shows the driving style recognition results of a male driver traveling in the same route with three different driving tasks. Approximately 10 min of driving is conducted before the start of each driving task to eliminate the influence of driving style recognition result on the last test. As shown in Figure 6, the minimum

Driving style identification results with different driving tasks.
Figure 7 shows the driving style recognition results in a continuous and large up-and-down ramp. In order to demonstrate the advantage of using

Driving style recognition results on slope road.
Statistical analysis of driving style influential factors
Statistical analysis verifies the influence of driver objective and outside subjective factors on driving style. During the entire process of driving style recognition test, six drivers conducted 18 times road tests, and the collected data were approximately 912 MB. The interval of data sampling and recognition calculation time was 300 ms. In order to accurately reflect the behavior of the driver during driving, a total of 31,243 sample groups were obtained after eliminating the data when shifting and braking.
In the analysis, the maximum value, mean value, and standard deviation of
The driving style is a result of the combined actions of various factors. Therefore, when analyzing a certain influential factor, the principle of other factors is the same or similar. This principle can make the data comparable and ensure the objectivity of statistical results when a certain factor is analyzed separately.
Influence of subjective factors on driving style
Driving style is mainly influenced by driver's personality when the task attribute is ordinary driving. Therefore,
Influence of personality on driving style.

The column of the driving style grade is the statistical analysis result, which agrees with the mean value of
Table 7 shows the statistical results of the influence of other types of subjective factors on driving style based on
Influence of task attribute, genders, and ages on driving style.

With regard to the task properties, the
For gender, the mean value of a male driver is higher than that of a female driver. Meanwhile, the standard deviation of a male driver is greater than that of a female driver, which illustrates that the behavior of the male driver is fierce during the driving process, and the behavior of the female is the opposite.
For age, the mean value of young drivers is higher than that of the older drivers. Furthermore, the standard deviation of older drivers is small, which shows that older drivers adopt a smooth operation in the driving process, and young drivers adopt an opposite behavior. Old drivers prefer the economical driving style, and young drivers are partial to the sports driving style.
Influence of objective factors on driving style
Considering the objective factors, this study focuses on the analysis of the influence of road condition (heavy traffic conditions) and the ramp on driving style.
Influence of road conditions on driving style
Although road conditions belong to the subjective factors, these conditions indirectly influence driving style by influencing the mentality of the driver. Therefore, statistics for
Influence of road conditions on driving style.

Although the subjective factor characteristics of the six drivers differ from one another when compared, the statistical results have a certain regularity, which reflects that the different road conditions have different influences on the driving style. The main characteristic is described in the following. Under the same task attribute, the average and maximum values of congested roads are the smallest values, normal traffic is the highest, and high-speed road is between these attributes. In terms of standard deviation, congested roads, normal traffic, and high-speed road are arranged in an ascending order. This kind of distribution has rationality. The driver operation is limited and has to drive in a stop-and-go style on congested roads. Therefore,
According to the preceding analysis, driving style under congested roads be inclined to economical type, and driving style under high-speed roads reflects the moderate characteristic. Driving style is mainly influenced by the driver’s subjective factors under normal traffic conditions.
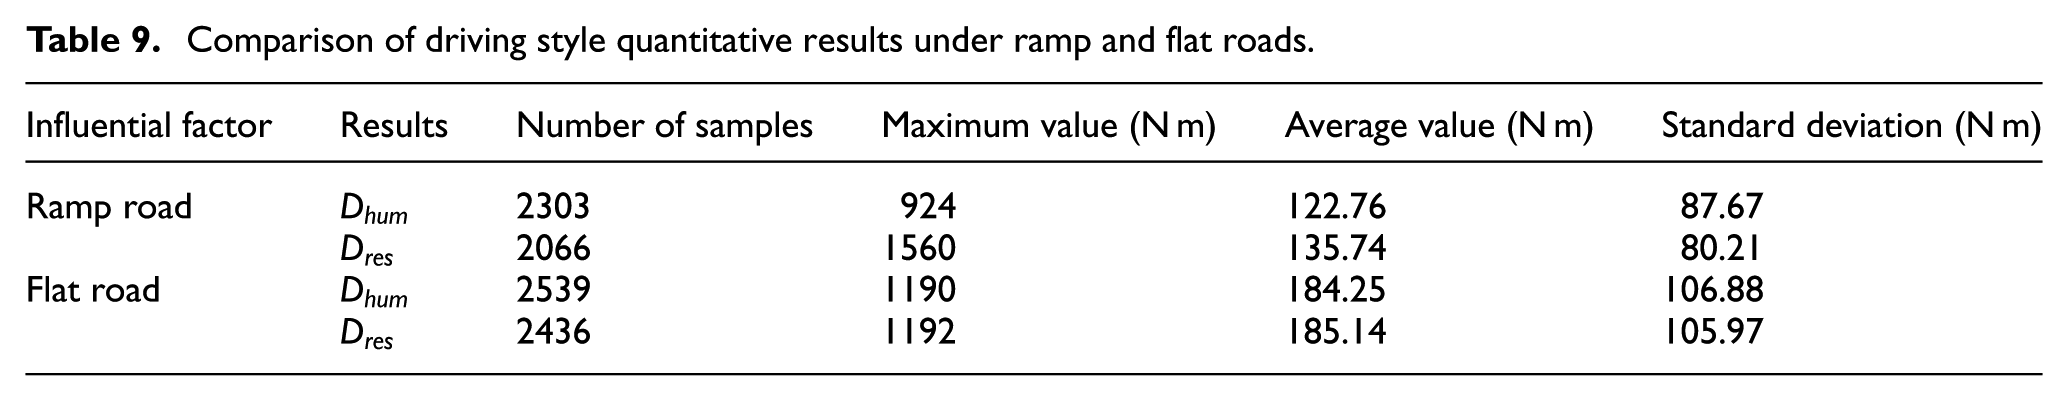
Among the objective factors, the ramp and load have the greatest effect on driving style. This effect can be seen by comparing the
Comparison of driving style quantitative results under ramp and flat roads.
Analysis of the relationship between driving style and gearshift strategy
Previous studies on the relationship between driving style and gearshift strategy are based on observation experiences instead of relevant test data. This study adopts statistical analysis to study the relationship between them and to find out the statistical rules between them. According to recognition results, automatic transmission shift point can be corrected to improve the adaptability of gearshift strategy for different driving styles.
A test AMT vehicle works in pure manual mode, and the shift intention is directly reflected by the handling of the shift lever. Therefore, the moment sampling
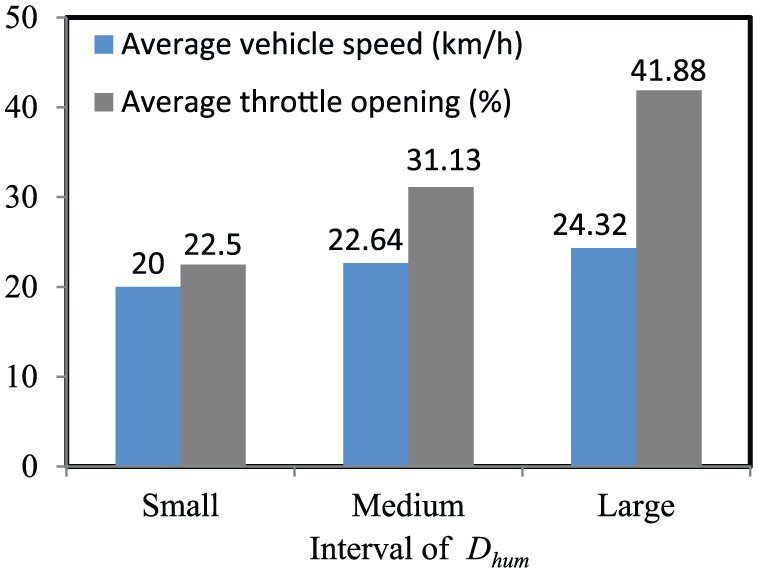
Statistical results of the shift characteristics under different driving styles.
Figure 8 shows that the larger the
Conclusion
In this study, a driving style recognition method based on the driver’s dynamic demand was introduced. Driver’s dynamic demand can be characterized using speed, acceleration, and shock extent of the vehicle. The prediction model of single-exponential smoothing does not need to store a large amount of historical data while considering the importance of each data phase, which can predict the overall and periodic driving style trend of the driver based on the historical data of driver’s dynamic demand under the standard condition. This method can eliminate the influence of external objective factors on driving style during recognition process. The vehicle test results showed that under the condition of no additional sensors, the driver’s dynamic demand fully reflects the subjective factors of the driver which is consistent with driver’s accelerator pedal operation trend. The designed test verified the correctness of the driving style recognition based on driver’s dynamic demand. For the adaptive gearshift system, the larger the value of recognition result, the more the shift points (speed and throttle) should be delayed.
This study is a preliminary investigation of the driving style recognition method. Our experience in this study highlights the explicit linkage between driving style and driver’s dynamic demand. The influence of subjective and objective factors on driving style still needs further detailed analysis according to a large number of experimental data from various drivers. In the future research about drives, the hazardous evaluation method aiming at different driving styles will be built based on more drives test data.
Footnotes
Academic Editor: Neal Y Lii
Declaration of conflicting interests
The author(s) declared no potential conflicts of interest with respect to the research, authorship, and/or publication of this article.
Funding
The author(s) disclosed receipt of the following financial support for the research, authorship, and/or publication of this article: This research was supported by National Natural Science Foundation Project of China (no. 51575220), International S&T Cooperation Program of China (no. 2014DFA71790), the Key Scientific and Technological Project of Jilin Province (no. 20130204023GX).