
Abstract
This article researches on a traffic congestion status forecasting method to improve the real-time monitoring and controlling of air traffic in terminal areas. First, a traffic congestion status evaluation method was introduced based on a fuzzy C-means clustering algorithm, as well as several traffic congestion status evaluation metrics. And then, a traffic congestion status forecasting model was proposed based on support vector machine. Finally, a real case study from a terminal area in China was provided to test and verify the proposed evaluation method and forecasting model. The evaluation results show that traffic congestion status of the terminal area can be classified into five levels: free, smooth, slightly congested, moderately congested, and severely congested. The forecasting results show that the mean absolute error and the cluster accuracy are 0.041% and 92.2%, respectively, which indicate that the forecasting model is very effective and accurate. In addition, it is also found that the parameters of forecasting period and size of training set have some influence on forecasting results, and the optimal results can be found when the two parameters values are 15 and 3, respectively.
Introduction
Terminal maneuvering area (TMA) is an air traffic control area normally established at the confluence of air traffic service routes in the vicinity of one or more major airdromes. Usually, air route network in TMA is complex, types of flights are various (departures, approaches, and over-flights), and potential conflicts between aircraft are of high frequency. As a result, air traffic problems, such as air traffic congestion, large numbers of flight delay, and even aircraft accidents, more easily occur in a terminal area. Air traffic management in terminal areas is becoming an extremely difficult problem. And the technologies of congestion situation identifying and forecasting play an increasing important role in terminal areas’ traffic control.
Air traffic congestion status is a macroscopic representation of air traffic flow fluency in certain air traffic control area. Forecasting congestion status aims to provide real-time and accurate traffic information in coming future for air traffic controllers and to support them to control air traffic more safely and effectively, which has important realistic significance.
Researches aimed at the evaluation of air traffic congestion status are in the early stage with relatively rare research results. However, scholars had done a lot of research work based on dynamic density and intrinsic properties, which can provide important basics for research on forecasting air traffic congestion status. The combined influence of metrics (i.e. traffic density, complexity, and number of airports) on controllers’ workload was researched, and it was found that controllers’ workload had close connection with these metrics. 1 The influence of different airspace factors on controllers’ workload was analyzed, and the controller workload was found to have strong correlation with sector geometry. 2 In 1995, Radio Technical Commission for Aeronautics (RTCA) first proposed the idea to quantitatively describe the airspace complexity. 3 After that the “dynamic density” model was established to evaluate air traffic complexity. 4 Dynamic density is a proposed concept for a metric that includes dynamic metrics, traffic density, and conflict metrics. Controller workload is reflected with a linear weighted sum. However, the model cannot reflect controller’s intention, and the weights are vulnerable to subjective factors. 5 By analyzing intrinsic data, such as radar tracks, another way to measure complexity was found.6,7 The research of intrinsic properties suggests that complexity is correlated to airspace structure and the connections between individual aircraft. 8 Researchers believe that the number of aircraft is the crucial factor that influences the air traffic complexity. 9 The research of intrinsic properties avoids the difficulty to measure controller workload. However, it ignores the human factors at the same time.
According to the data in use and the models applied, air traffic congestion forecasting methods mainly is divided into four categories: forecasting based on mathematical statistics, forecasting based on air traffic flow models, forecasting based on intelligent algorithms, and forecasting based on computer simulation. 10 The forecasting method based on mathematical statistics can obtain air traffic congestion status by analyzing traffic operation data. Researchers from NASA established the probability distribution function of aircraft passing an air traffic unit, 11 traffic demand was forecasted by comparing the forecasting demand with the actual capacity. From the perspective of weather, a weather-impacted traffic index was introduced, and a corresponding linear regression model was proposed. 12 Taking different lengths of time slices into consideration, researchers from the National Transportation Systems Center proposed a linear regression forecasting model based on three continuous time intervals 13 and adjacent time intervals 14 and obtained forecasting results by comparing demand with capacity. From the perspective of risk, an airport congestion risk forecasting model was proposed based on the random demand of airport approaches and departures. 15
The forecasting method based on air traffic flow models can obtain congestion status metrics using traffic flow parameter relation models, such as converging traffic flow model,16–18 flight delay and cancelation model, 19 and approach flight instantaneous queuing model. 20 The forecasting method based on intelligent algorithms can obtain congestion status metrics by inputting forecasting values into a congestion status identification model. Based on the support vector machine (SVM), air route traffic congestion status was forecasted with an air route traffic demand model and a threshold method. 21 An airport congestion status forecasting method was proposed based on fuzzy neural network and measured data. 22 The forecasting method based on simulation can obtain congestion status using some traffic simulation systems. Based on the Total Airspace and Airspace Modeller (TAAM) simulation system, an airport operation under stochastic factors was simulated, and the congestion status was analyzed by the simulated results. 23 Based on the SIMMOD simulation system, an airport operation under different weather conditions and runway configurations was simulated. 24 Based on the NetLogo simulation tools, a cell transmission model of air traffic flow was established for terminal area, and its basic congestion evaluation rules were discussed.25,26
Air traffic system is a complex human-centered system, which consists of air traffic controllers, air traffic flow, and airspace environment. It should take air traffic flow operating characteristic, air traffic controller factors, and airspace complexity into account to analyze traffic congestion status. Therefore, the article presents a comprehensive method for forecasting TMA traffic congestion status with these factors based on fuzzy C-means (FCM) and SVM. The main processes of forecasting TMA congestion status is as follows, as shown in Figure 1:
Congestion status evaluation. First, take equivalent airspace occupancy (AO) which considers the air traffic controllers’ workload on each aircraft category (e.g. landing, departure, and flyover) as the main body, and basic congestion status metrics which consist of air traffic flow characteristics and airspace complexity as the contribution, to formulate an integrated congestion status evaluation model.
Congestion status classification. Next, based on the result of status evaluation, an FCM clustering method is adopted to divide air traffic status into five levels with stability and minimum iterations constraints.
Congestion status forecasting. Finally, based on the historic results of congestion status evaluation and classification as training samples, a traffic congestion status forecasting model was proposed based on SVM. And sensitivities of model performance are analyzed further.
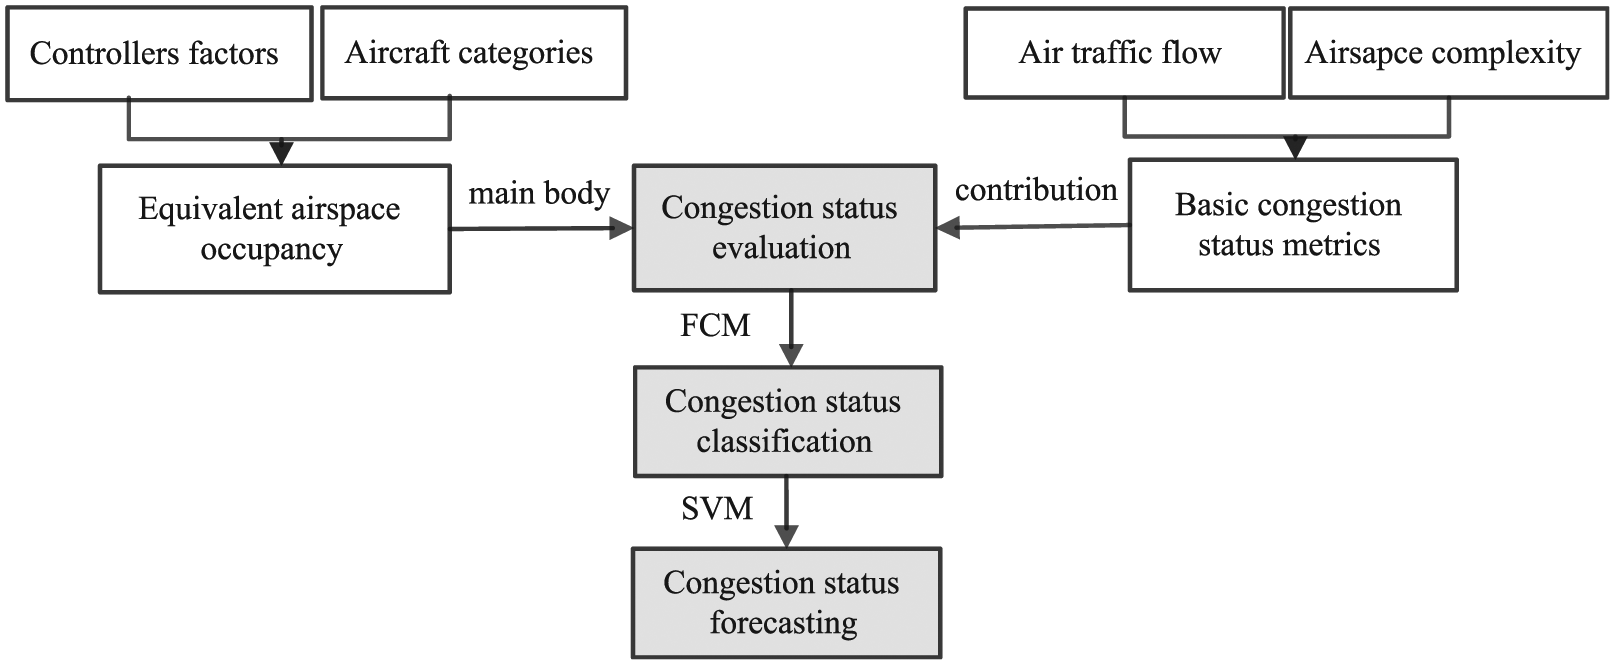
Process of forecasting congestion status in terminal area.
The rest of this article is organized as follows. Section “Research method” presents TMA congestion status forecasting models, consisting of congestion status evaluation metrics, identification, and forecasting models. Section “Results and discussion” presents a case study with a large TMA in China to test and verify the proposed models. Some conclusions and implications are presented in section “Conclusion.”
Research method
Congestion status evaluation metrics
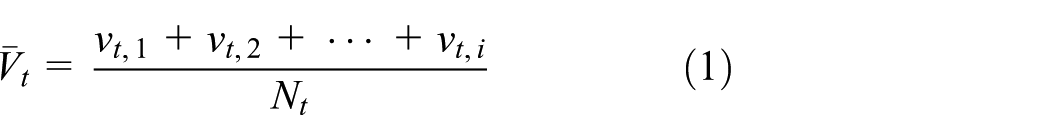
Average flow velocity
The metric reflects the fluency of traffic flow in TMA. According to the former researches, air traffic flow status can be divided into five phases (free, unimpeded, metastable, pseudo-congestion, and synchronized congestion). The average flow velocity (AFV) is an important parameter to measure the status. In general, when the AO is extremely low, the average velocity of the free traffic flow is of great fluctuation with no monotonic regularity. As the AO increases, the inner interacting activity increases. As a result, the aircraft following behavior between successive aircraft leads to decrease in average velocity.
Standard deviation of velocity
The standard deviation of velocity (SDV) reflects the deviation of individual aircraft’s velocity to the average velocity. When the AO is fixed, if the values of aircraft’s velocity are concentrated, controllers can correctly and quickly predict aircraft’s position and do the order sorting. Otherwise, it will increase the difficulty to do interval allocation and velocity adjustment, and as a result, the control workload increases and the status of traffic transits to congestion. So, the SDV in TMA at time t is as follows

Standard deviation of heading angle
The metric reflects the clustering of flight paths. When the flight paths are dispersed, the value is fairly large, making it hard for controllers to cluster the flight paths using abstract structure cognition. When the flight paths are gathering in lines and forming the standard flow, it helps the controllers to simplify the traffic situation and relieve control workload. The average heading angle of aircraft at time t is

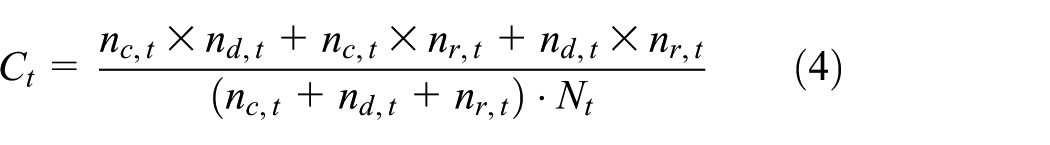
Traffic mixing coefficient
The metric reflects the number of aircraft and the mixing degree of different categories of aircraft (climbing, descending, and cruising). Normally, the bigger the traffic mixing coefficient (TMC), the bigger the workload of air traffic controllers. Assuming that
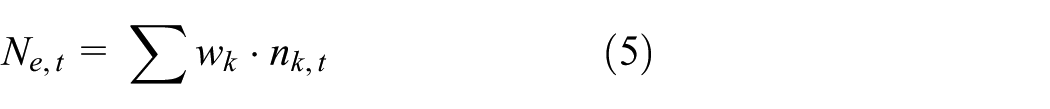
Equivalent AO
It is the number of aircraft within a certain spatial range instantaneously. Researches have shown that control workload has a complicated non-linear relation to the AO. By analyzing control audio data, different categories of aircraft (taking off, landing, and flyover) are found to generate different control workloads. Therefore, the concept of equivalent AO is introduced, indicating the weighted sum of aircraft amount within certain spatial range instantaneously. The weight values are set depending on the ratio relations of control workload in handling each flight per minute, among which the weight value with lowest workload is denoted as 1. If the number of aircraft in TMA at time t is
Congestion status evaluation method based on FCM
Integrated congestion status evaluation model
In this article, aircraft are divided into some categories (flyover, taking off, and landing). However, in terminal airspace, flyover aircraft at different altitudes generate different complexity and difficulty for air traffic control due to their interactions with departure and landing flights. So, flyover can be extended to high-level and low-level flyover. Different weights are given to each category, and they are added up as equivalent AO. By multiplying equivalent AO by basic status metric coefficient, the terminal air traffic congestion status value is acquired, as shown in formulas (6)–(8)
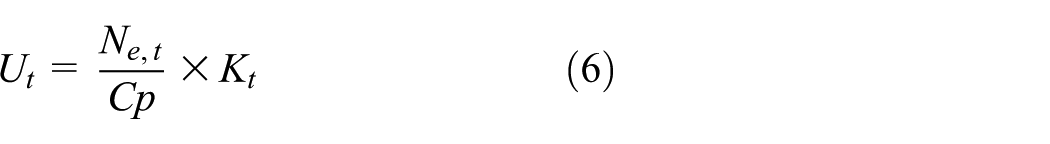


where
Congestion status classification process
The classification of congestion status value is uncertain and fuzzy. To deal with it, an FCM clustering is introduced. 27 The basic idea of FCM is to cluster the sample into a given number of sets and to ensure that elements within a set reach the maximum similarity and elements between different sets reach the minimum similarity. By obtaining the membership degree matrix of each element, cluster each element into certain set based on the maximum membership principle. 28 The process of FCM clustering is shown in Figure 2.

The general process of FCM clustering.
Congestion status forecasting method based on SVM
Congestion status forecasting model
Given a training data set

where
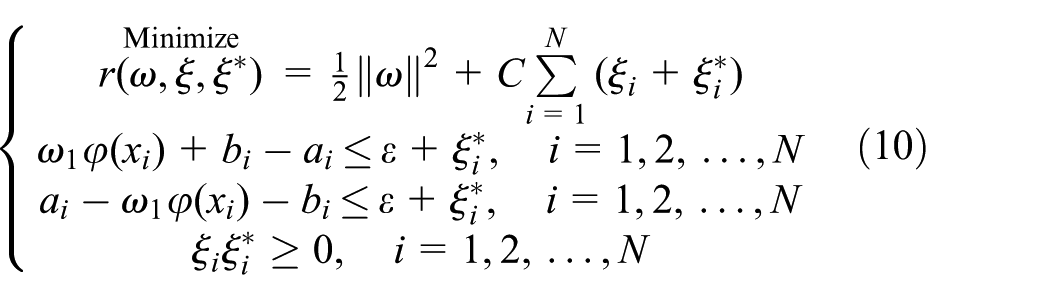
where

The kernel function
Congestion status forecasting process
The forecasting model is trained with the training data from a sample, which consist of congestion status values and airspace occupancies of a day. Parameters s and k are predetermined. s is the forecasting period. S time slices are combined as one, and the average congestion status value and average AO of the combined time slices are calculated. k is the size of training set, which determines the number of combined time slices in the input data set in a single forecasting loop.
Providing the congestion status values and AO of the first k combined time slices for the forecasted day, the congestion status values of all day can be forecasted. The forecasting congestion status values are clustered based on the clustering results of the sample. The process of congestion status forecasting is as follows:
Step 1. Combine each S time slices as one. Calculate the average congestion status value
Step 2. Build an independent variable matrix of the training data

Build a dependent variable matrix of the training data

Input
Step 3. Build the input matrix of the trained forecasting model

Forecast based on the trained forecasting model. The output is the congestion status value
Step 4. Let
Step 5. Output the forecasting congestion status value array

Cluster the congestion status value according to the clustered results of the sample and evaluate forecasting performances by comparing with the actual congestion status values of the forecasted day.
Results and discussions
The congestion status evaluation and forecasting methods discussed above are verified with a terminal area in China, whose airspace structure is shown in Figure 3. The airspace consists of standard arrival routes, standard instrument departure routes and runways, and so on. The radar data consist of aircraft’s positions (longitudes and latitudes), ground speeds (km/h), heights (100 feet), heading angles (degree), and flight numbers of 5000 time slices during a typical day.

The airspace structure of the TMA.
Evaluation results
Calibrating for basic status metrics
The values of AFV, SDV, SDH, and TMC of the day with 5-min interval can be calculated based on the proposed method, and their relationships between AO are analyzed. It is found that when the AO is relatively low (0–10), the values of these metrics distribute in a wide interval with no regularity; when the AO is relatively high, the values of these metrics are concentrated with a slight fluctuation around an average. All the metrics have positive correlations with AO when AO is greater than 10, except for AFV. Take the relationship between TMC and AO as an example, as shown in Figure 4. Assuming the cutoff value of AO as 10, values of basic status metric coefficient can be determined using different methods, and the average value of each metric can be calculated as the reference value of basic status metric on the basis that AO is >10. Reference values of basic status metrics are shown in Table 1.

Relationship between TMC and AO.
Reference values of basic status metrics.
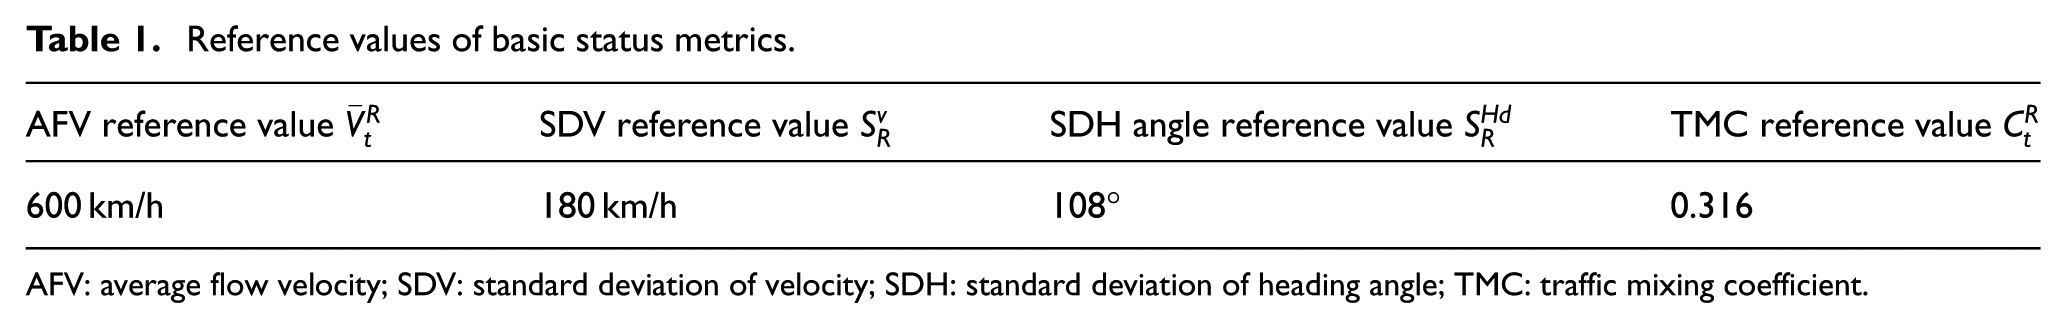
AFV: average flow velocity; SDV: standard deviation of velocity; SDH: standard deviation of heading angle; TMC: traffic mixing coefficient.
When the AO is >10, SDV, SDH, and TMC are all positively correlated to traffic congestion,
Calibrating for equivalent AO
Currently, radio communication is the major way to conduct air traffic control. Controlling audio duration time is the externalization of control workload. It is an effective method to evaluate airspace capacity based on controllers’ workload with audio data. The average working time per minute for dealing with different categories of aircraft can be obtained with control audio data. Contributions to control workload of each category are shown in Table 2.
Contributions to control workload of each category.

The contributions of different aircraft categories to control workload are obtained by audio data and radar track synthesis. The equivalent weight of high-altitude flying over aircraft is set as 1. The other equivalent weights refer to the comparing workload to high-altitude flying over aircraft. The equivalent weight of landing aircraft is

Changing tendencies of congestion status and AO.
Congestion status classification
The evaluation of congestion status aims to support air traffic control operation, traffic flow management, and airspace management; a sudden change of congestion status should be avoided. Therefore, based on the principle of 15-min stability and minimum iterations, the terminal air traffic congestion status is clustered into five levels: free, smooth, slightly congested, moderately congested, and severely congested, as shown in Table 3.
Congestion status clustering results.

According to the congestion status clustering results shown in Table 3, the TMA congestion status during the day can be evaluated, as shown in Figure 6. In the free level, AO is extremely low, aircraft are scattered and guided by standard arrival or departure procedures with no potential conflict, and air traffic controllers mainly play a role of monitoring the TMA. In the fluent level, AO is low, aircraft’s flying paths are usually straight, and there exist some potential conflicts. Controllers should control individual aircraft with some instructions. In the slightly congested level, AO is moderate and aircraft uniformly distribute in a dynamic state, the interaction between aircraft gradually appears, controllers should conduct aircraft following by adjusting its velocities and transit their focus from individual aircraft to multiple aircraft. In moderately congested level, AO is high, safety requirements are hardly met only with velocity adjustment, maneuvering aircraft are occasional, and the controller’s workload increases. In the severely congested level, the number of aircraft to approach the TMA is limited, maneuvering aircraft are frequent, holding aircraft appear, and the traffic flow status changes from linear to scattered.

Congestion status with time series.
Forecasting results
The forecasting model is developed using the LIBSVM software in MATLAB. It is necessary to select a proper kernel function and determine reliable model parameters before forecasting congestion based on the developed model.
Selecting the kernel function
Different kernel functions have different forecasting performances. A proper kernel function should provide better performances. The frequently used kernel functions are polynomial kernel function, radial basic function (RBF) kernel function, and the sigmoid kernel function.32,33,34,35 The poly-nomial kernel function is formulated as
Determining model parameters
The penalty factor c and the kernel function parameter g have an important influence on forecasting results. The penalty factor c decides the influences caused by the outliers. A larger factor c can cause greater losses to the objective function, which means the unwilling to give up these outliers. The kernel function parameter g affects the generalization ability of the SVM. When g is small, the fitting effect to the training sample is satisfactory, but the generalization ability to new samples is poor. When g is large, the decision function will be close to a constant, which has poor ability for fitting and forecasting.
The grid searching method is used to determine the optimal parameter pair

Forecasting results with
From Figure 6, the mean absolute error (MAE) is 0.041, the mean absolute percentage error (MAPE) is 12.3%, and the cluster accuracy (CA) is 92.2%. Except for some outliers, the similarity between forecasting values and actual values is relatively high, and the forecast accuracy of the congested level is higher than that of the free level. As the combined time slice is 10–80, the congestion status is in the free level, whose forecasting values deviate from the actual values to a certain extent. This is because there is a little regularity in the free level. Except for the congestion status values in the free level, the MAE and MAPE decrease to 0.038 and 5.1%, respectively. In addition, there are 225 forecasting values higher than actual values because these values from the training sample are higher than that of the forecasted day. This shows that the training sample has an influence on the forecasting results.
Parameter influences
Influences of the size of the training set
Set the forecasting period as a constant value s = 20 and adjust the size of training set k as 2, 5, 10, and 20, respectively, and then four groups of forecasting results are obtained and shown in Figure 8. Some basic features are found from the distribution of forecasting data. From the aspect of integral forecasting accuracy, MAE and MAPE have the same changing trend with different k, while CA has the opposite one. The forecasting data with higher values have higher accuracies. As k increases, the region of forecasting value narrows down, and the accuracy of extreme values drops down. In the free congestion level, forecasting values are generally higher than actual values, and the deviation trend grows as k increases.
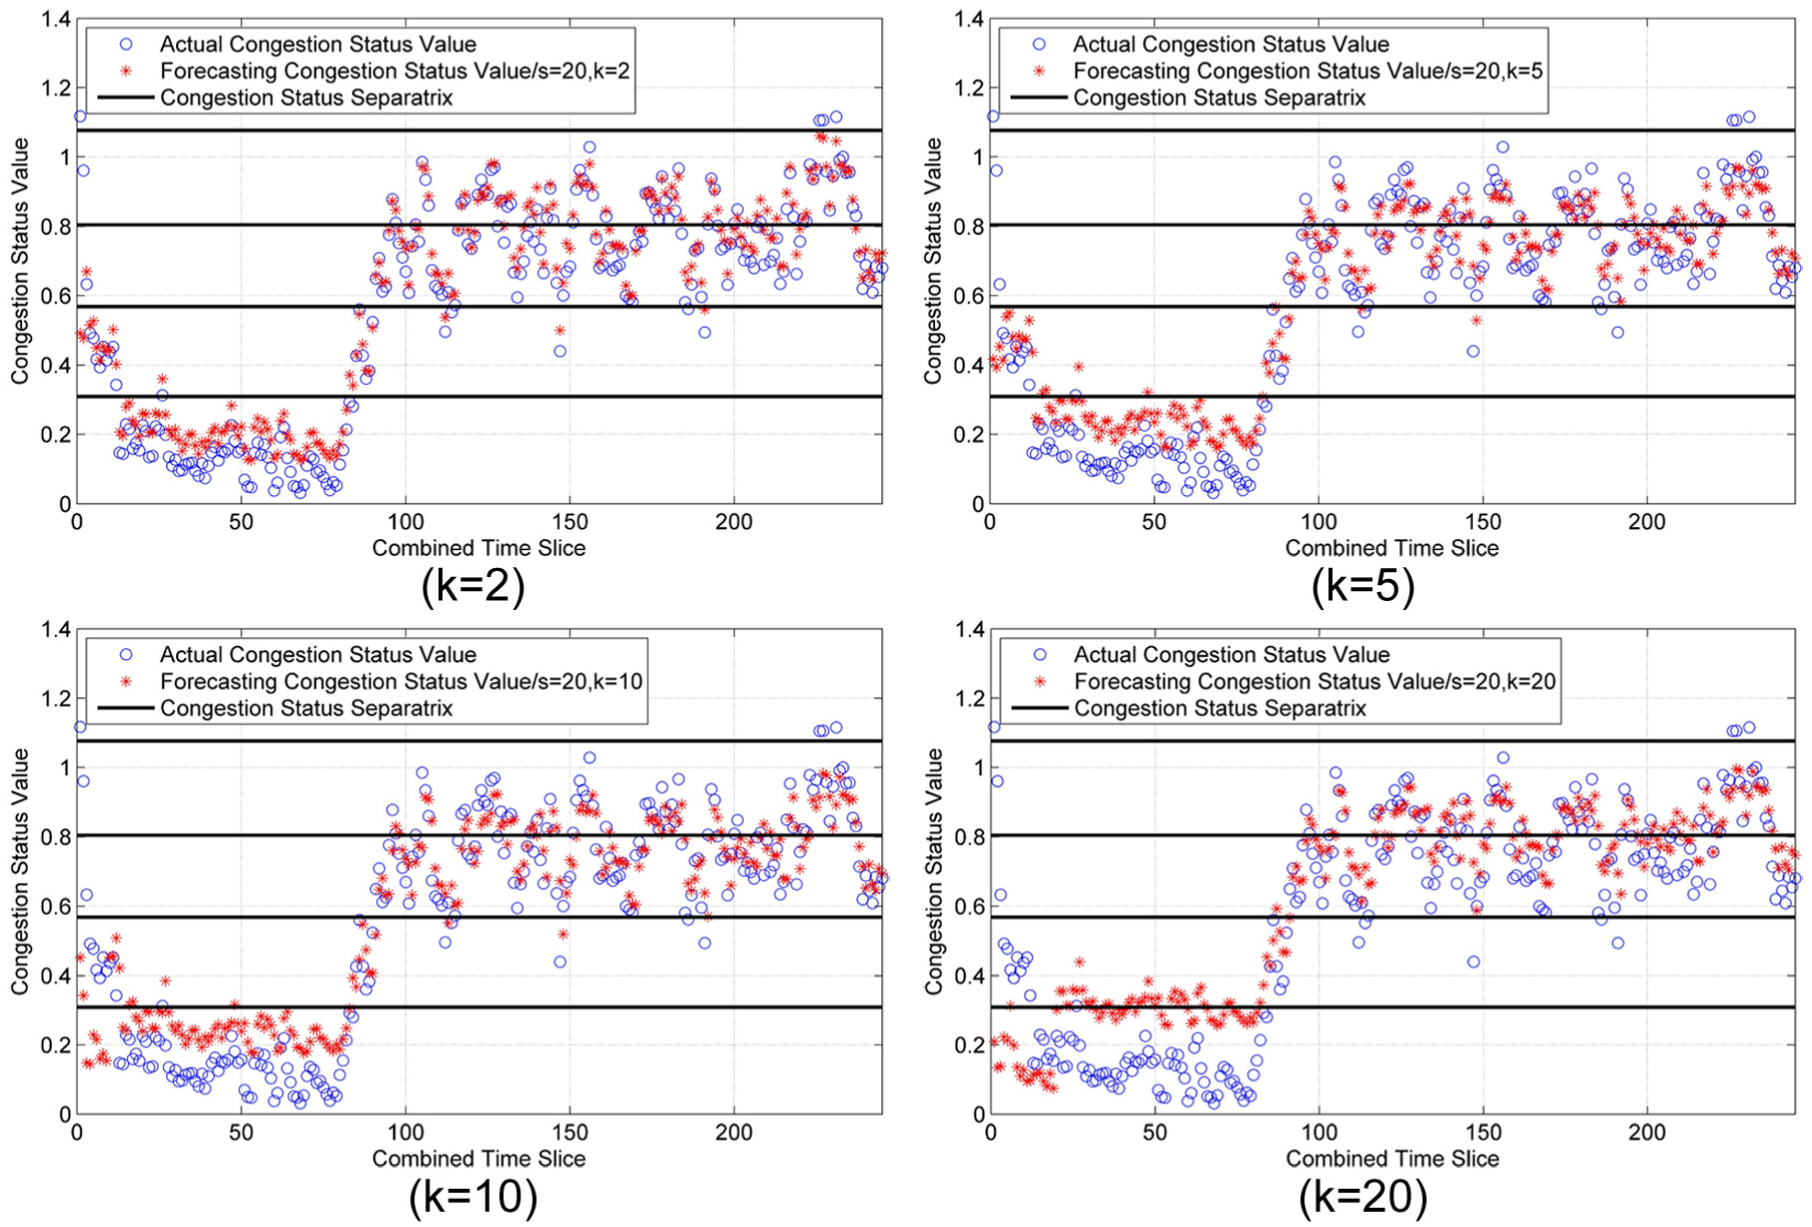
Forecasting results with s = 20 and different values of k.
The forecasting accuracies with a constant s = 20 and different k from 1 to 20 are shown in Figure 9. When k = 3, CA, MAE, and MAPE all obtain their optimal values. When

Relationship between accuracy and k.
Influences of the forecasting period
In the same way as above, set the size of the training set as a constant value k = 3 and adjust the forecasting period s as 1, 5, 15, and 30, respectively, and then four groups of the forecasting accuracy are obtained and shown in Figure 10. Some basic features are also found from the distribution of forecasting data. When s = 1, the forecasting values match the actual values but have punctate distributions. When s increases to 5 and 15, forecasting accuracies are higher, and the distributions of forecasting values are continuous. However, the forecasting accuracies of lower level congestion values and some extreme values decrease when s increases to 30.

Forecasting results with k = 3 and different values of s.
The forecasting accuracies with a constant k = 3 and different s from 1 to 30 are shown in Figure 11. It is clear that changing trends of MAPE, CA, and MAE are all very stable with a little volatility. When the size of the training set is too small (s = 1) or too big (s = 30), their value are all in bad performance. CA and MAE obtain optimal values when s = 15, and MAPE optimal value appears when s = 7. On the whole, the forecasting period has an influence on the forecasting performance, and the forecasting results are optimal when it is around 15.

Relationship between accuracy and s.
Conclusion
This article focuses on air traffic congestion status forecasting method for terminal areas based on FCM and SVM. A congestion status evaluation model is introduced based on FCM clustering algorithm, and a congestion status forecasting model was proposed using the SVM method. Using the evaluation model, the terminal traffic congestion status is clustered into five levels: free, fluent, slightly congested, moderately congested, and severely congested. The proposed forecasting model is verified to have a good performance by an actual sample in China. In addition, it is found that some parameters have an important influence on forecasting performance and there exists an optimal value to improve forecasting accuracy.
Further researches could focus on air traffic congestion situation awareness based on four-dimensional (4D) trajectory prediction. There should introduce a comprehensive evaluation index system of air traffic congestion, which is an important basement of congestion situation awareness. The proposed congestion evaluation model and forecasting model could be improved using some dynamic parameters, and they could be further developed for the whole air traffic network, not only for terminal areas. Moreover, rules of air traffic congestion formation, devolution, and dissipation should be found out, which would help in controlling air traffic in a more safe and efficient manner.
Footnotes
Academic Editor: Gang Chen
Declaration of conflicting interests
The author(s) declared no potential conflicts of interest with respect to the research, authorship, and/or publication of this article.
Funding
The author(s) disclosed receipt of the following financial support for the research, authorship, and/or publication of this article: This work was supported by the National Natural Science Foundation of China (61104159 and 61573181), the Natural Science Foundation of Jiangsu Province (BK20131366), and the Fundamental Research Funds for the Central Universities (NS2014068).