
Abstract
In this article, an improved grey prediction model is proposed to address low-accuracy prediction issue of grey forecasting model. The first step is using a trigonometric function to transform the original data sequence to smooth the data, which is called smoothness of grey prediction model, and then a grey support vector machine model by integrating the improved grey model with support vector machine is introduced. At the initial stage of the model, trigonometric functions and accumulation generation operation can be used to preprocess the data, which enhances the smoothness of the data and reduces the associated randomness. In addition, support vector machine is implemented to establish a prediction model for the pre-processed data and select the optimal model parameters via genetic algorithms. Finally, the data are restored through the ‘regressive generate’ operation to obtain the forecasting data. To prove that the grey support vector machine model is superior to the other models, the battery life data from the Center for Advanced Life Cycle Engineering are selected, and the presented model is used to predict the remaining useful life of the battery. The predicted result is compared to that of grey model and support vector machines. For a more intuitive comparison of the three models, this article quantifies the root mean square errors for these three different models in the case of different ratio of training samples and prediction samples. The results show that the effect of grey support vector machine model is optimal, and the corresponding root mean square error is only 3.18%.
Keywords
Introduction
Lithium-ion battery is an ideal battery in the 21st century. Along with the improvement of performance, the battery can be widely applied in many areas. 1 Thus, the issue of collecting the battery life information and its reliability becomes critical. To obtain the authentic life data of lithium-ion battery, advanced testing technique and assessment method are needed to study its remaining useful life (RUL).
Scholars have proposed some methods aimed at predicting the RUL of lithium-ion battery. Common predicting methods can be divided into two categories: establishing failure physical model and data-driven method. Compared to failure physical models, data-driven method does not require the information of a specific failure mechanism. Instead, given a specific training sample, it can excavate implicit information between input and output, which provides a fairly-well failure trend prediction. 2
At this point, the usage of data-driven methods is convenient due to their ability to transform high-dimensional and noisy environmental data into low-dimensional information for diagnostics and, especially, for prognostic tasks. 3 Based on Rakhmatov et al.’s 4 model, Xu et al. 5 proposed a better model for predicting battery life. But this method has a range limit, for which the results cannot lead to an ideal predicting accuracy. Shen et al. 6 used an artificial neural network to predict the degradation trend of battery life. At first, the predicting data and test data show a good consistency, but it gets worse with a higher error later. W Gu et al. 7 proposed a data-driven modelling approach, based on grey system theory, for lithium-ion battery accelerated life testing. The prediction accuracy of this approach is not high because it can only predict the trend roughly. Using single support vector machine (SVM), A Nuhic et al. 8 realized the modelling and projection for battery life. This approach has a high accuracy because it searches for the global optimum, while the accuracy will be decreased for mutational data. Literatures9,10 used the method of particle filtering to predict RUL. Because particle filtering method relies on physical or experience model to establish the equation of state and there exist noise, measurement error in practical application, the prediction results exist certain error. Based on SVM, literature 11 proposed a similar method of relevance vector machine (RVM), which is a kind of probability prediction method. Because of its advantages of super simple parameters and generalization ability, RVM has already been applied to the forecasting field. Yoshida et al. 12 investigated the capacity loss mechanism of large capacity lithium-ion cells for satellite application and developed a simple life estimation model to fit the capacity loss data. In their subsequent work, 13 they revised their previously developed model by considering solid electrolyte interface growth blocking mechanism. The results showed that the revised model can be used to better fit 10-year long-term capacity loss data. Burgess 14 divided the float service life of a battery into two phases. During the first phase, the capacity loss was small. The capacity loss increased once the second phase began. A Kalman filter was applied to estimate the remaining float service life of a valve-regulated lead acid battery once the second phase began. However, the battery capacity fade in the second phase was so short that an early failure alarm could not be triggered by this approach. Di Maio et al. 15 combined an RVM and an exponential function to estimate the RUL of bearings. Based on a similar idea, Zio and Di Maio 16 used an RVM to find the most representative relevance vectors to fit a crack growth model for predicting RUL.
Those single predicting methods proposed in the aforementioned literature have different drawbacks. In this article, we first improve the grey forecasting model through trigonometric function and integrate the SVM with improved grey model (GM). Then, a grey support vector machine (SGM-SVM) model is proposed. Before modelling, the data are pre-processed using trigonometric function and accumulated generating operation in smoothness of grey prediction model (SGM), to improve the associated smoothness and weaken the corresponding randomness. After prepossessing, an SVM model for the data is established. Moreover, genetic algorithm is applied to select the model parameters, and, at last, the data are restored to obtain the predicted RUL.
Grey forecasting theory
Grey system analytical method compares the similarity and difference among the development laws of system elements, that is, correlation degree analysis, and searches for the system change rule by handling original data. After weakening the randomness of original data, a differential equation model can be built based on the generated data to predict the growing trend and future status. The most frequently used grey forecasting model is the first-order GM. Figure 1 shows the steps of constructing a grey forecasting model.

Steps of building GM.
Step 1. Set the original sequence as

where


Step 2. Build the first-order differential equation

for the sequence
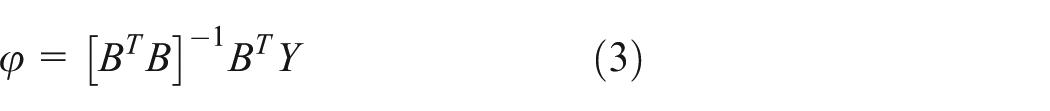
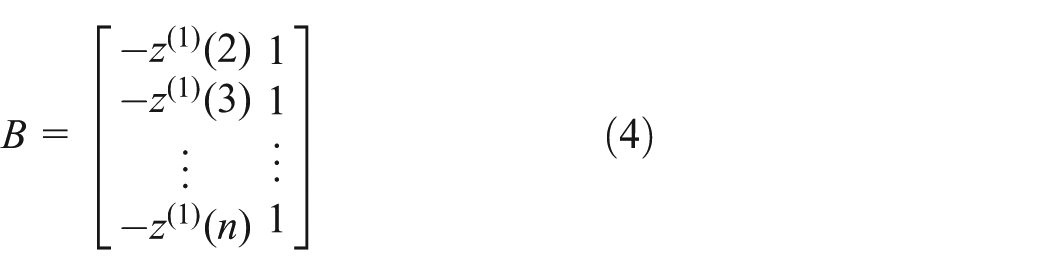
Step 3. Solve for parameters a and b. Use least-square method to confirm the parameter list


Step 4. Under starting condition

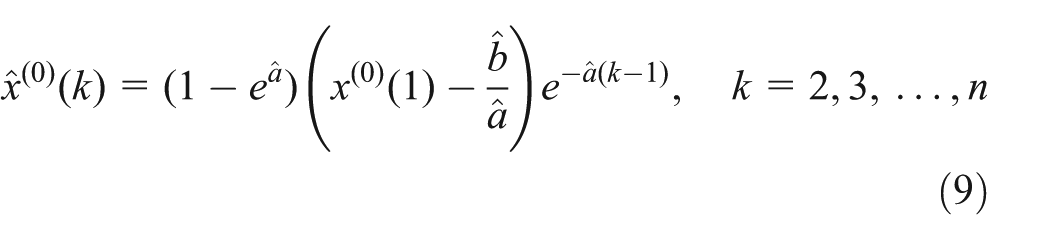
Step 5. Under starting condition

That is,
Note that if
Grey forecasting model has the characteristics of simple principles and convenience of calculations. But under restrictions of development coefficient, it can only forecast a rough trend of a long-term data set and the corresponding accuracy is not high, which makes its practical value low. So, the grey forecasting model has some theory drawbacks and many researchers try to optimize and improve it.
Literature17–19 shows that the data smoothness is an important factor that can influence the accuracy of grey forecasting model. In other words, increasing the data smoothness can improve the model accuracy effectively. Particularly, trigonometric function is used to address the data smoothness. This article improves the grey forecasting model, based on the one shown in Figure 1, using trigonometric function

Steps of building SGM.
To normalize the sequence

For

using trigonometric function

Forecast the result based on one-step grey forecasting model and use

Original sequence
SVM
SVM includes two parts: support vector classification (SVC) and support vector regression (SVR). The SVR algorithm is mainly discussed in this article. 20
SVR is a function that uses limited training sample data
Under most circumstances, data for training sample have non-linear relationship. For non-linear cases, the idea of SVR is to transform space non-linear problems to linear problems in a space with high dimension through a non-linear mapping and replace the inner product of sample vector by kernel function

In equation (10), the sample points
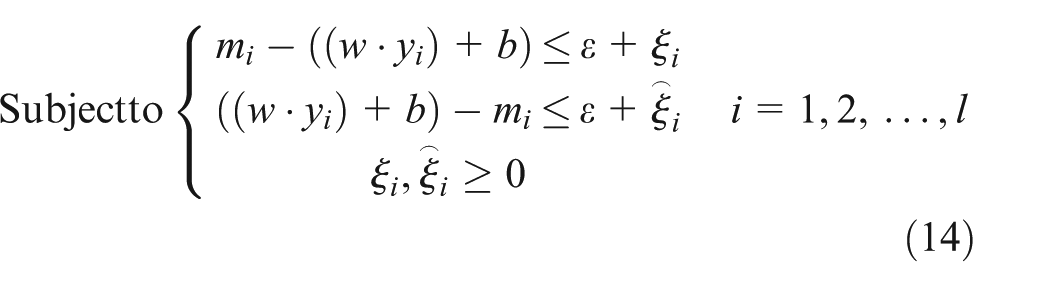
For an unknown value x outside the training sample collection, optimal solutions w and b could be found which make


In equation (12),
If

where


Then, SVR estimate function can be written as

SGM-SVM
Establishment of model
Although the prediction accuracy of original grey forecasting model is low, the improved GM can use trigonometric functions and the accumulation generation operation to enhance the data smoothness and weaken the randomness. In this section, a new method called SGM-SVM that combines the improved GM and SVM is proposed. Specific steps are included in Figure 3.

Steps of building SGM-SVM.
Selection of the model parameters
For the SGM-SVM, the most important question is how to select the model parameters.
Kernel function
The structure of the characteristic space depends on the type of kernel function, so the selection of kernel function directly influences the effect of transformation from a non-linear separable space to a linear separable space. Previous research23,24 analyses and compares the SVM algorithms based on different kernel functions, making a conclusion that the accuracy of SVM algorithm based on Gaussian kernel (Radial Basis Function) is the best. The Gaussian kernel function has the advantage of fewer parameters and smaller prediction errors; thus, it is selected as the kernel function

where
– the cost function parameter and penalty factor C
For the cost of function parameters and penalty factor, the existing literatures have not given more reasonable options, most of which present empirical value according to different data. Genetic algorithm is used for these two parameters to global search for better parameter values.
Battery RUL prediction model
This article chooses two sets of data provided by the Center for Advanced Life Cycle Engineering (CALCE) to forecast the battery RUL and selects the discharge capacity of the battery as the health indicator. To verify the prediction accuracy of the proposed SGM-SVM model, as for data 1, the top 200 data of battery discharge capacity is selected, in which the prior 120 data are training samples, and the rest 80 data are predicted samples, while as for data 2, the top 150 data of battery discharge capacity is selected, in which the prior 90 data are training samples, and the rest 60 data are predicted samples. Then, establish the prediction model. In particular, to prove the superiority of the proposed model, comparing to other models, the original GM and the single SVM are used to predict the battery RUL as well. Finally, a comparison is made among the results of the three different models.
Now, the original GM is used to forecast the battery RUL. Because grey prediction model is just a simple predictive model of first-order differential equation, its prediction accuracy is not very high and it can just predict rough trends. The results are shown in Figure 4.

Prediction results of GM.
Then, a single SVM is used to realize a prediction. Due to the fact that SVM itself has a strong predicting ability, to demonstrate the effect of the proposed SGM-SVM, a further research should be conducted on the predicting results of a single SVM, including determination of the model parameters of SVM, selection of the historical data of different length from the first training data and establishment of forecasting model to predict the rest of the data. As for data 1, the parameters of model are

Prediction results of SVM.
The picture implies that the predicted results are close to the actual values. So, the SVM can predict the overall trend and has a strong predicting ability. However, the prediction at the inflection point is not ideal, and there are some errors and deviations between the actual discharge capability and predicted discharge capability. The predicated data curve is inconsistent with the actual data curve when they come across each other. Meanwhile, the trend of actual data curve and predicated data curve is not consistent with each other. Hence, trigonometric function and cumulative generation is used in the improved grey forecasting model to handle the original data. The processed data are shown in Figure 6. This operation can improve the regularity and smoothness at the inflection point and enhance the accuracy of model prediction. Prediction results of SGM-SVM are shown in Figure 7.

Processed data by SGM.

Prediction results of SGM-SVM.
From Figure 6, it could be concluded that the SGM-SVM can predict the battery discharge capacity accurately and has a higher accuracy than simple SVM model. We provide root mean square error (RMSE) of each model to compare the predicted results of these three models.
If the actual observed value is

The RMSEs of the three models are presented in Table 1. The results show that the predicting accuracy of SGM-SVM is higher than that of GM and SVM models.
RMSE of three models.

GM: grey model; SVM: support vector machine; SGM-SVM: grey support vector machine; RMSE: root mean square error.
As for the prediction result, it is just for one case of the ratio of training samples and prediction samples. In order to prove whether the SGM-SVM is the best model for predicting, it is necessary to discuss the case of different ratio of training samples and prediction samples. The RMSEs of the different ratio of training samples and prediction samples are presented in Tables 2 and 3.
RMSE of different ratio of training samples and prediction samples (data 1).

RMSE: root mean square error; GM: grey model; SVM: support vector machine; SGM-SVM: grey support vector machine.
RMSE of different ratio of training samples and prediction samples (data 2).

RMSE: root mean square error; GM: grey model; SVM: support vector machine; SGM-SVM: grey support vector machine.
Analysing the table above, the results show that no matter what ratio of training samples and prediction samples number, the predicting accuracy of SGM-SVM is higher than that of GM and SVM models.
Conclusion
The original grey forecasting model is improved using trigonometric function. Then, an SGM-SVM model that integrates the improved GM with the SVM is proposed. Genetic algorithm is applied to search for optimal model parameters. Finally, RMSEs of three models are compared, and the results conclude that the accuracy of SGM-SVM is higher than that of GM and SVM models. This SGM-SVM provides an efficient way to estimate battery RUL.
Footnotes
Academic Editor: Joo Ho Choi
Declaration of conflicting interests
The author(s) declared no potential conflicts of interest with respect to the research, authorship, and/or publication of this article.
Funding
The author(s) received no financial support for the research, authorship, and/or publication of this article.