
Abstract
Hydraulic pump degradation feature extraction is a key step of condition-based maintenance. In this article, a novel method based on high-frequency harmonic local characteristic-scale decomposition sub-signal separation and discrete cosine transform high-order singular entropy is proposed. In order to reduce noises and other disturbances, the vibration signal is processed by the local characteristic-scale decomposition modified by the high-frequency harmonic. Sub-signal with sensitive information is obtained by blind source separation of the selected intrinsic scale components. Furthermore, the discrete cosine transform high-order spectral analysis algorithm is proposed to extract singular entropies of Shannon and Tsallis to be the degradation features of the hydraulic pump. Analysis of the hydraulic pump experiment demonstrates that the proposed method is feasible and effective in indicating the performance degradation of the hydraulic pump.
Keywords
Introduction
Since the hydraulic pump is one of the most important components of hydraulic system, it has direct effects on the reliability of the whole system. 1 Unlike the rolling bearing, the structure of the hydraulic pump is complex. Its vibrations are mainly caused by striking of swash plate by pistons and the inherent mechanism such as bearing. And their feature frequencies are different. This character contributes to vibration signal nonlinearity, which means the nonlinear hybrid of various source signals containing distortion and aliasing. Furthermore, the liquid compressibility and the coupling effect between fluid and solid may influence the abrasion of piston and swash plate. Therefore, the vibration signal of hydraulic pump seems to be complicated and nonlinear, and it is hard to extract the feature information. 2 Consequently, an effective method is required for extracting the appropriate fault feature.
Blind source separation (BSS) is able to reveal sensitive information in source signals on the basis of observation by mathematic model. 3 Therefore, it has been applied in various fields, such as signal processing 4 and fault diagnosis. 5 Considering the structural characteristics of hydraulic pumps, it is hard to effectively separate the sub-signal with sensitive fault information by traditional BSS. To solve this problem, various algorithms have been introduced to make modification on BSS, such as independent component analysis (ICA),6,7 order filtering (OF), 8 and empirical mode decomposition (EMD). 9 However, ICA requires that the signals should be statistic independent; OF has poor ability to deal with related source, and EMD has the problems of mode mixing, over envelope, and the end effect. 10 Being one of the late proposed algorithms for signal analyzing, local characteristic-scale decomposition (LCD) is able to adaptively divide a complex signal into several intrinsic scale components (ISCs). 11 Compared with EMD, LCD has advantages in iterations and end effect restraining. 12 However, because of the three spline function fitting, the mode mixing still exists leading to the disturbances of noise and some useless components. In order to reduce the disturbances and improve feature information, the high-frequency harmonic (HFH) is introduced to modify LCD for sub-signal separation in this article.
Furthermore, recent studies of fault feature extraction mainly center on fault mode feature, such as most features in time domain and frequency domain. However, few researches for fault degradation feature extraction are carried out. Since bispectral analysis (BA) is one of the high-order statistics methods, it is sensitive to unsymmetrical and nonlinear components and reveals information which cannot be obtained by second-order statistics analysis. 13 However, it selects bi-coherence as the only feature vector based on Fourier coefficients, which may influence the feature sensitivity. As the spread of Fourier transform, discrete cosine transform (DCT) has the property of energy aggregation. 14 Its coefficients are sensitive to energy changing. 15 Consequently, it is reasonable to replace Fourier transform in BA by DCT to improve the feature sensitivity.
The article is organized as follows: in section “Model of sub-signal separation,” the model of the sub-signal separation is simply introduced; in section “Sub-signal separation algorithm based on HFHLCD,” we demonstrate means for sub-signal extraction based on HFHLCD in detail. Simulation analysis is also presented for validation in this part; in section “Degradation feature extraction by DCT high-order entropy,” the DCT high-order spectrum analysis algorithm is proposed and degradation features are extracted; and in section “Experimental results,” the results are verified through the experiment of the hydraulic pump; while in section “Conclusion,” we draw some conclusions.
Model of sub-signal separation
Assume that s(t) is the N-dimensional original signal and x(t) is the M-dimensional observation signal. x(t) is the linear combination of s(t)

where A denotes the M × N dimensional mixing matrix. The aim of standard BSS algorithm is searching for the N × M dimensional separating matrix W and making linear transform on x(t), ensuring that the separated signal y(t) is one of unbiased estimations of s(t). The model is shown in equation (2)

If N = M, equation (1) can be described by equation (3)

where

In order to get the required sub-signal, the only work is to find N sub-band components with higher independency for estimating separation matrix W.
Sub-signal separation algorithm based on HFHLCD
HFHLCD
In common LCD algorithm, the first achieved ISC always contains a wide frequency range. According to the cubic spline interpolation, some useful pulse components may remain in the first ISC together with other abnormal components. To solve this problem, we apply the HFH 17 in LCD, so as to retain more disturbances and reduce useful components in the first ISC. The amplitude of HFH should be large enough to improve the extreme values’ distribution. Commonly, we can use the peak value of the original signal to be the amplitude. On the basis of Cheng et al., 18 the HFH is first added into the vibration signal


where x(t) denotes the original signal and H(t) means the HFH. U is the amplitude, and U = max{x(t)}. f is the frequency which can be taken as f = fs/2.
On this basis, the HFHLCD algorithm can be indicated as follows:
1. Confirm the extremum point
2. Calculate


Then get the left and right extremum points by prolongation and calculate
3. Fit

If
4. Separate ISC1 from the original data and get the new signal. Then repeat 1–3 until
It is clear that based on HFHLCD, feature information is specifically detailed in various ISCs, so that the sensitive information may be easier to obtain.
Source number estimation
The basis for sub-signal separation is the source number estimation. The Bayesian information criterion (BIC) is used to deal with this issue. Based on the HFHLCD, we can get ISCs and

where

where p is the number of nonzero feature values,
Sub-signal separation
As is analyzed, the more independent the ISC, the more sensitive information of the original signal can be revealed. Therefore, the mutual information is applied as evaluation rule for ISCs’ selection. The ISC with less mutual information tends to be more independent. For declining computation, the mutual accumulation 21 is used to approximately calculate the mutual information by equation (12)
where cum2, cum3, and cum4, respectively, denote the two-order, three-order, and four-order mutual accumulation of x.
Above all, the procedures for HFHLCD sub-signal separation are detailed in the following:
Step 1. Decompose the original observation signal x(t) by HFHLCD algorithm and get ISC1, ISC2,…, ISCn, and
Step 2. Build the multi-dimensional observation signal xob and calculate the correlation matrix. Make SVD and estimate the source number m by equation (11).
Step 3. Calculate the mutual information of each ISC. Select m ISCs with the least mutual information and build the new m-dimensional observation matrix
Step 4. Make albefaction on

where
Step 5. Take use of joint approximate diagonalization of eigen-matrices (JADE) 22 to deal with e(t) and obtain the required sub-signal yi(t)

Simulation analysis
In order to verify the performance of the proposed sub-signal separation method, simulation analysis is carried out in this section. Assume that f

where a1(t) and a2(t), which are correlated sources, denote the simulation of periodic pulse signals during fault degradation. The striking frequencies are 16 and 24 Hz. a3(t) denotes the disturbance of the harmonic signal
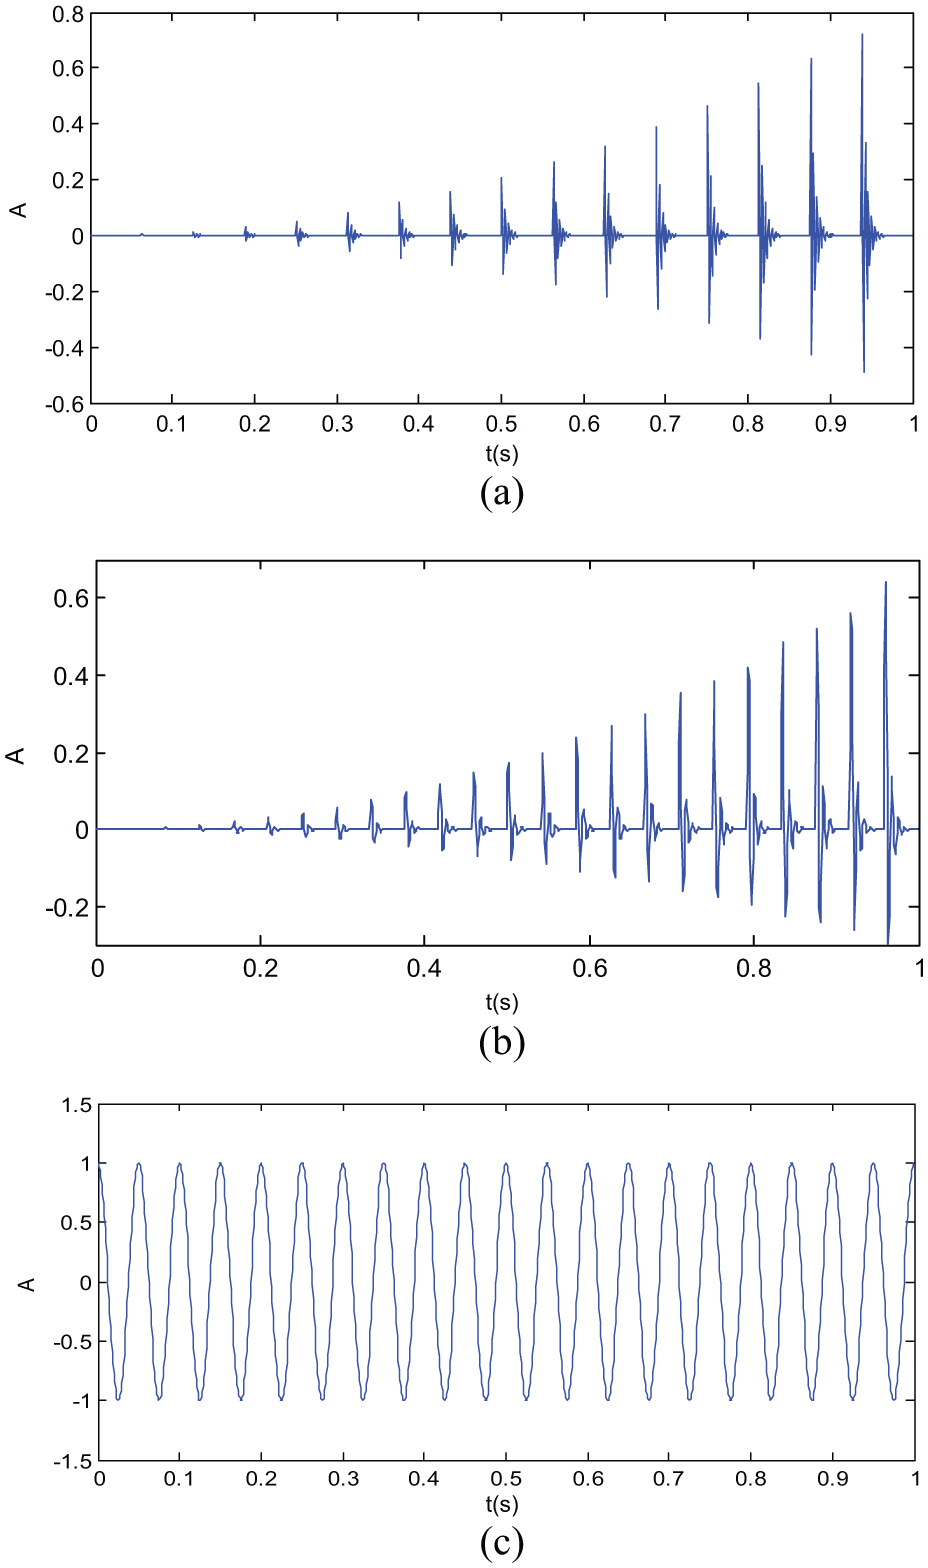
Time domain of the simulation signals: (a) time domain of a1(t), (b) time domain of a2(t), and (c) time domain of a3(t).
The 3 × 3 mixing matrix A is generated randomly to combine the three simulation source signals into the observation signals S

Assume that S1(t) is the observed single-channel signal. Its time domain is shown in Figure 2.

Time domain of S1(t).
Source number estimation
According to equations (5)–(9), S1(t) is decomposed by HFHLCD. Six ISCs and one trending component
Sub-signal separation
Based on equation (12), the mutual information of the six ISCs are 9.18,

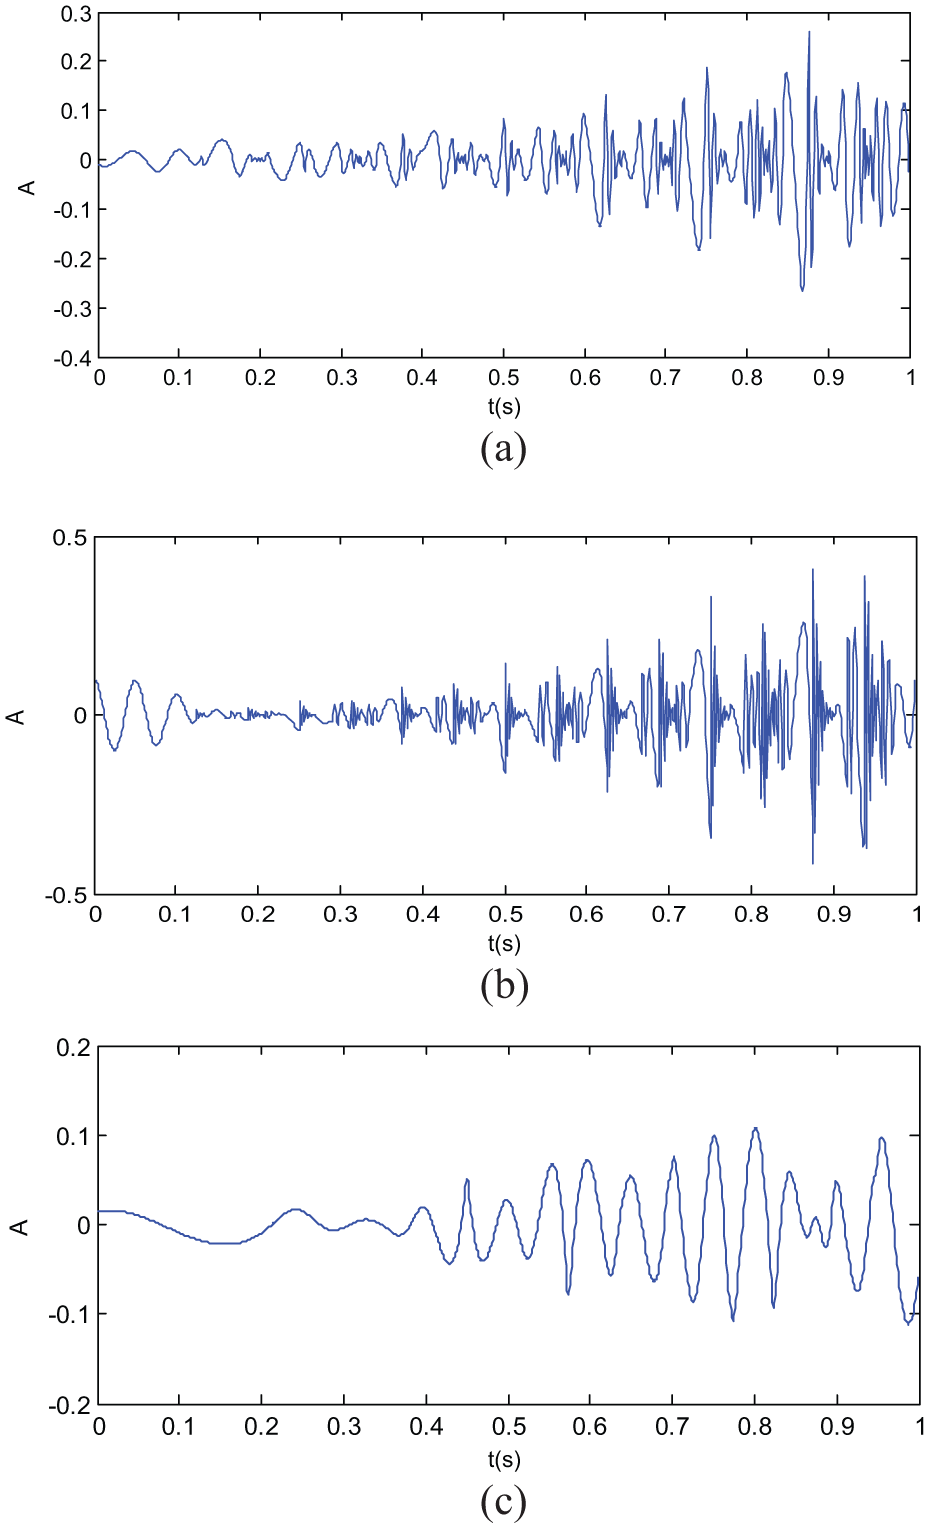
Time domain of the selected ISCs: (a) time domain of ISC4, (b) time domain of ISC3, and (c) time domain of ISC5.
In Figure 3(a), ISC4 contains most information of the source signal a1(t) and the frequency is relatively pure. The reason can be explained that as the use of HFH, the abnormal components are greatly retained in the first ISC. It can also be explained by the mutual information. The mutual information of ISC1 is 9.18, which is much higher than others. In Figure 3(b) and (c), the information of source signals a2(t) and a3(t) are also obtained obviously. To further show superiority of the selected components’ processing by HFHLCD, the standard LCD algorithm is taken to deal with S1(t). Selected components are
Time domain of the selected ISCs by standard LCD algorithm: (a) time domain of
Figure 4(a) clearly shows that
The three-dimensional observation signal

Time domain of the separated sub-signals: (a) time domain of
Figure 5 shows the sub-signals

where m denotes the source signal number,
Average approximate coefficient

BSS: blind source separation; ICA: independent component analysis; EMD: empirical mode decomposition; LCD: local characteristic-scale decomposition; HFHLCD: high-frequency harmonic local characteristic-scale decomposition.
Because of the combination of HFH and LCD, disturbances are effectively reduced and the selected ISCs contain more source feature information. Consequently, the proposed HFHLCD-BSS performs much better in sub-signal separation than other algorithms.
Degradation feature extraction by DCT high-order entropy
DCT high-order spectral analysis
Being a high-order statistic method, BA is able to effectively avoid the influences of Gauss noise and extract rich feature information. Assume that {x(n)} is a steady random process with zero-average, its three-order accumulation is described by equation (17) 23

If

Considering the disadvantages in BA analyzed before, the DCT high-order spectral analysis is proposed by the replacement of Fourier transform in BA by DCT to improve the sensitivity and extract effective degradation features.
Information entropy is one of the effective factors to quantitatively reveal the uncertain information in the signal, so that it is able to reflect the characteristics of the signal. Therefore, the information entropy is used in this article as the spectrum analysis factor of the proposed DCT high-order spectral. It is capable of reflecting the degradation trend, which possesses high sensitivity. One of the information entropy is the Shannon entropy (SE), which is defined in logarithmic form. For a system which contains Q microstates, the SE is defined by equation (19)24,25

where B is the Boltzmann constant and pi means the occurrence probability of the ith status. SE is always used to reveal the property of the scope system and it reflects the general trend. However, the factual system may be correlated in time and space more or less, and SE can hardly reveal all the inner characteristics of the system. Being the generalization of SE, Tsallis entropy (TE) is able to reveal the non-scope information which cannot be obtained by SE. TE is defined by equation (20)

where q is the non-scope parameter, and we can take q = 3 in this article. Compared with SE, the values of TE range only from 0 to 1 and it is able to reveal the microcosmic information of the system. Since the degradation of hydraulic pump is complex, there may be the correlations in time and space in certain degradation stages. TE is needed to be the supplement of SE. As a result, in order to effectively and sensitively reveal the performance degradation of hydraulic pump, the high-order singular Shannon entropy (HSSE) and high-order singular Tsallis entropy (HSTE) are selected to be the features.
The procedures of the algorithm are detailed as follows:
1. Make standard procession on the obtained sub-signal and the result is {x(t), t = 1,2,…, N}. Then divide x(t) into K parts and each part has M points. N = KM.
2. Calculate DCT coefficients

where
3. Calculate the triple correlation of DCT coefficients
where
4. Calculate the DCT high-order estimation matrix B
5. Carry out SVD on B and calculate weights of each singular value

where D = diag(x1,x2,…, xL), and L is the order of B

6. Calculate HSSE and HSTE


Degradation feature extraction
Based on former analysis, degradation feature extraction of the hydraulic pump can be detailed as follows, and the flowchart is shown in Figure 6:
Step 1. Sample the vibration signal X of the hydraulic pump.
Step 2. Separate the required sub-signal X′ from X by HFHLCD: Step 2.1. Add HFH to X and carry out LCD by equations (5)–(9) to achieve ISCs. Step 2.2. Rebuild the observation signal xob and estimate the source number by equation (11). Step 2.3. Calculate the mutual information. And select m ISCs to reconstruct the observation signal Step 2.4. Make BSS on
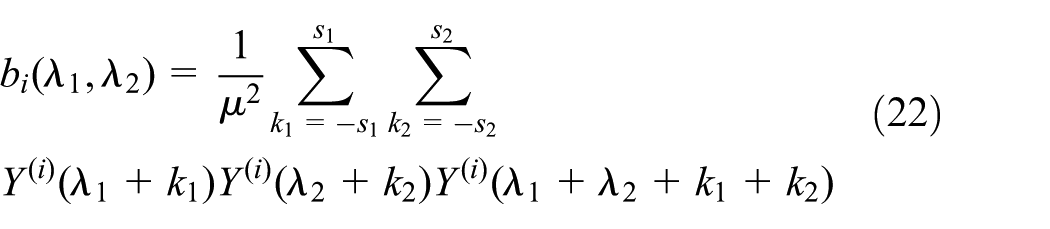
Step 3. Extract degradation features by DCT high-order singular spectral analysis on X′: Step 3.1. Make standardization and segmentation on X′. Step 3.2. Calculate DCT coefficients of each part of data by equation (21). Step 3.3. Calculate the triple correlation of DCT coefficients and achieve singular weights of the estimating matrix by equations (22)–(25). Step 3.4. Calculate the high-order singular entropy HSSE and HSTE by equations (26) and (27) and get the degradation feature vector of the hydraulic pump.
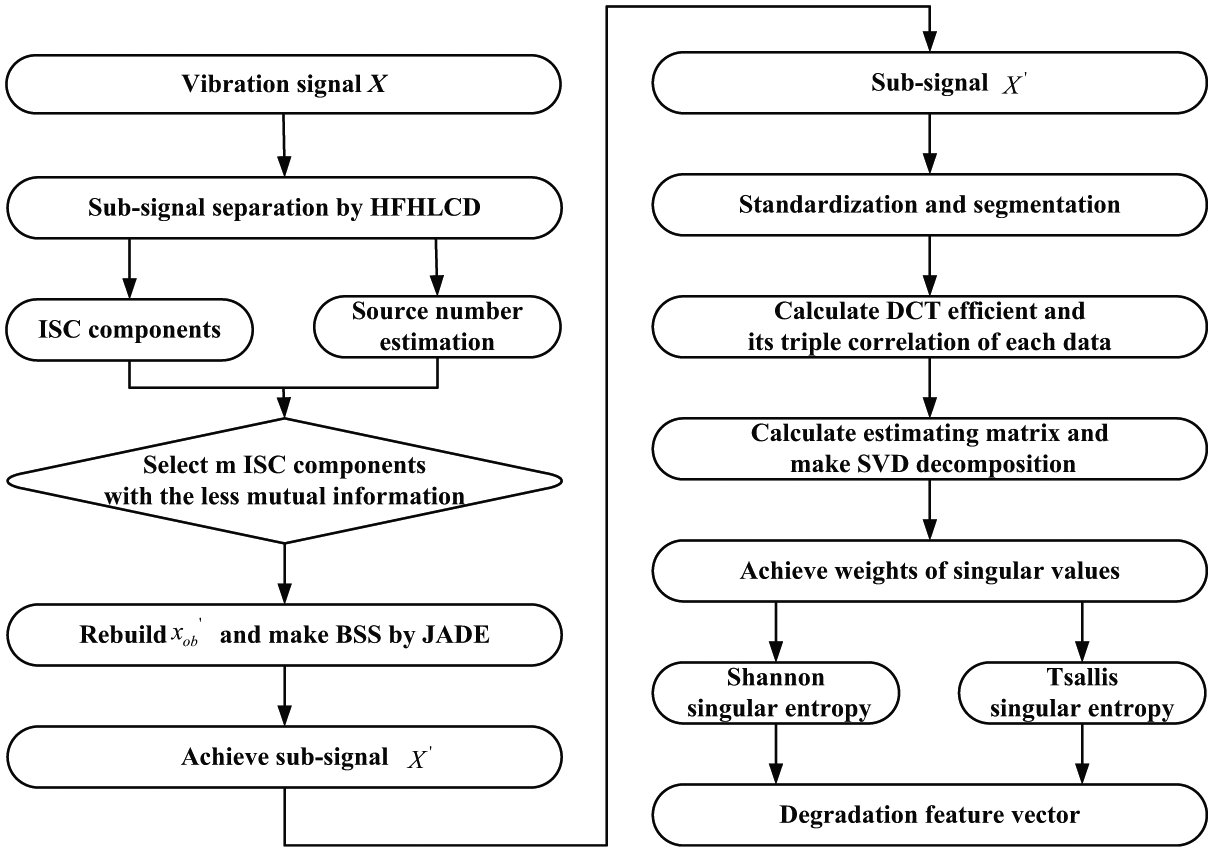
Flowchart of degradation feature extraction.
Experimental results
In order to verify the effectiveness and utility of the proposed algorithm, the method is applied in the vibration signal analysis of the hydraulic pump. In this article, we take degradation of loose slipper for research. Normally, the distance between the piston top and the slipper tends to increase along with the aggravation of loose slipper. Consequently, it is reasonable to take this distance for describing degradation degree. In order to evaluate detailed performance degradation in various stages, we take five pistons for experiment, which are the normal piston and four loose slipper pistons with distances 0.15, 0.24, 0.38, and 0.57 mm. Figure 7 shows these experimental pistons.
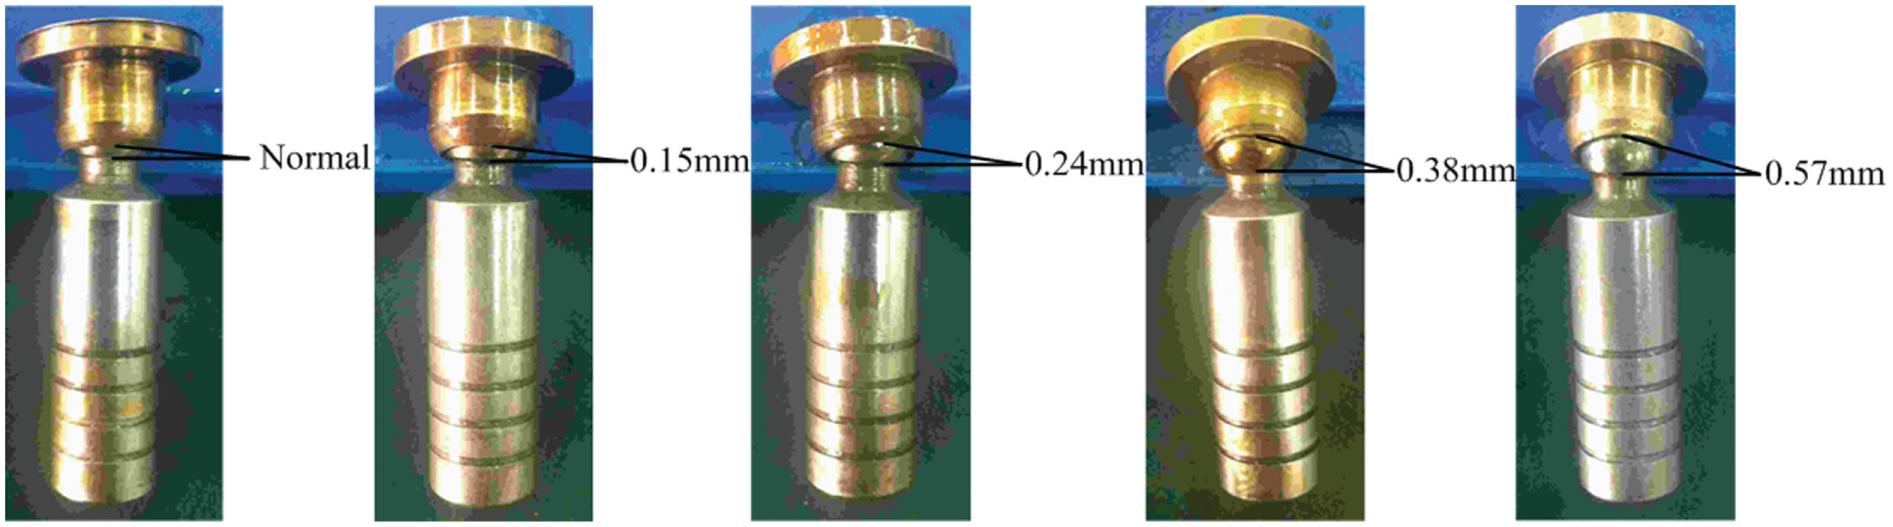
Experimental pistons.
The hydraulic pump tested is SY-10MCY14-1EL, which has seven pistons. Only one of these seven pistons is changed for each experiment. The driving dynamo is Y132M-4, which has the settled speed of 1480 r/min and the period of 0.041 s. The sampling frequency is 12,000 Hz. The sampled vibration signal is saved in computer by DH-5920 dynamic signal testing and analyzing system. Installation of the vibration sensor is shown in Figure 8.

Installation of vibration sensor.
We take the 0.38-mm loose slipper for example. And time domain and frequency domain of its vibration signal X are shown in Figures 9 and 10, respectively.

Time domain of vibration signal X.

Frequency domain of vibration signal X.
By the analysis of Figure 9, there are seven strikes in each period in X, which is accorded with the hydraulic pump structural characters. Figure 10 shows the frequency domain of X. Since the real speed of the pump bearing is 1480 r/min, the rotating bearing frequency is 1480/60 = 24.6 Hz. As there are seven pistons, the inherent striking frequency of the pump vibration signal is 24.6 × 7 = 172.2 Hz. Both frequencies exist in vibration signal X, while the amplitude of 172.2 Hz should be relatively large. For the single loose slipper fault, its feature frequency should be equal or approximate to the rotating bearing frequency of 24.6 Hz. However, both the inherent frequency and the fault feature frequency can hardly be seen in Figure 10, so that we cannot get any useful feature information. Therefore, the method proposed in this article will be applied in the following.
First of all, the vibration signal X is processed by HFHLCD algorithm to achieve the required sub-signal. According to equations (5)–(9), X is decomposed by HFHLCD. Seven ISCs and one u(t) are achieved. On the basis of the rebuilt observation signal xob, the correlation matrix is further decomposed by SVD and the feature values are 693.1, 135.8, 3.186, 1.121, 0.534, 0.097, and 0.008.Therefore, the number of source signals is m = 2, which is estimated by BIC.
Furthermore, the mutual information of seven ISCs are calculated by equation (12). And the selected components are ISC5 and ISC3. The two-dimensional observation signal

Frequency domain of the separated sub-signals: (a) frequency domain of
Figure 11 shows the feature information in the separated sub-signals. It is clear that the sub-signal
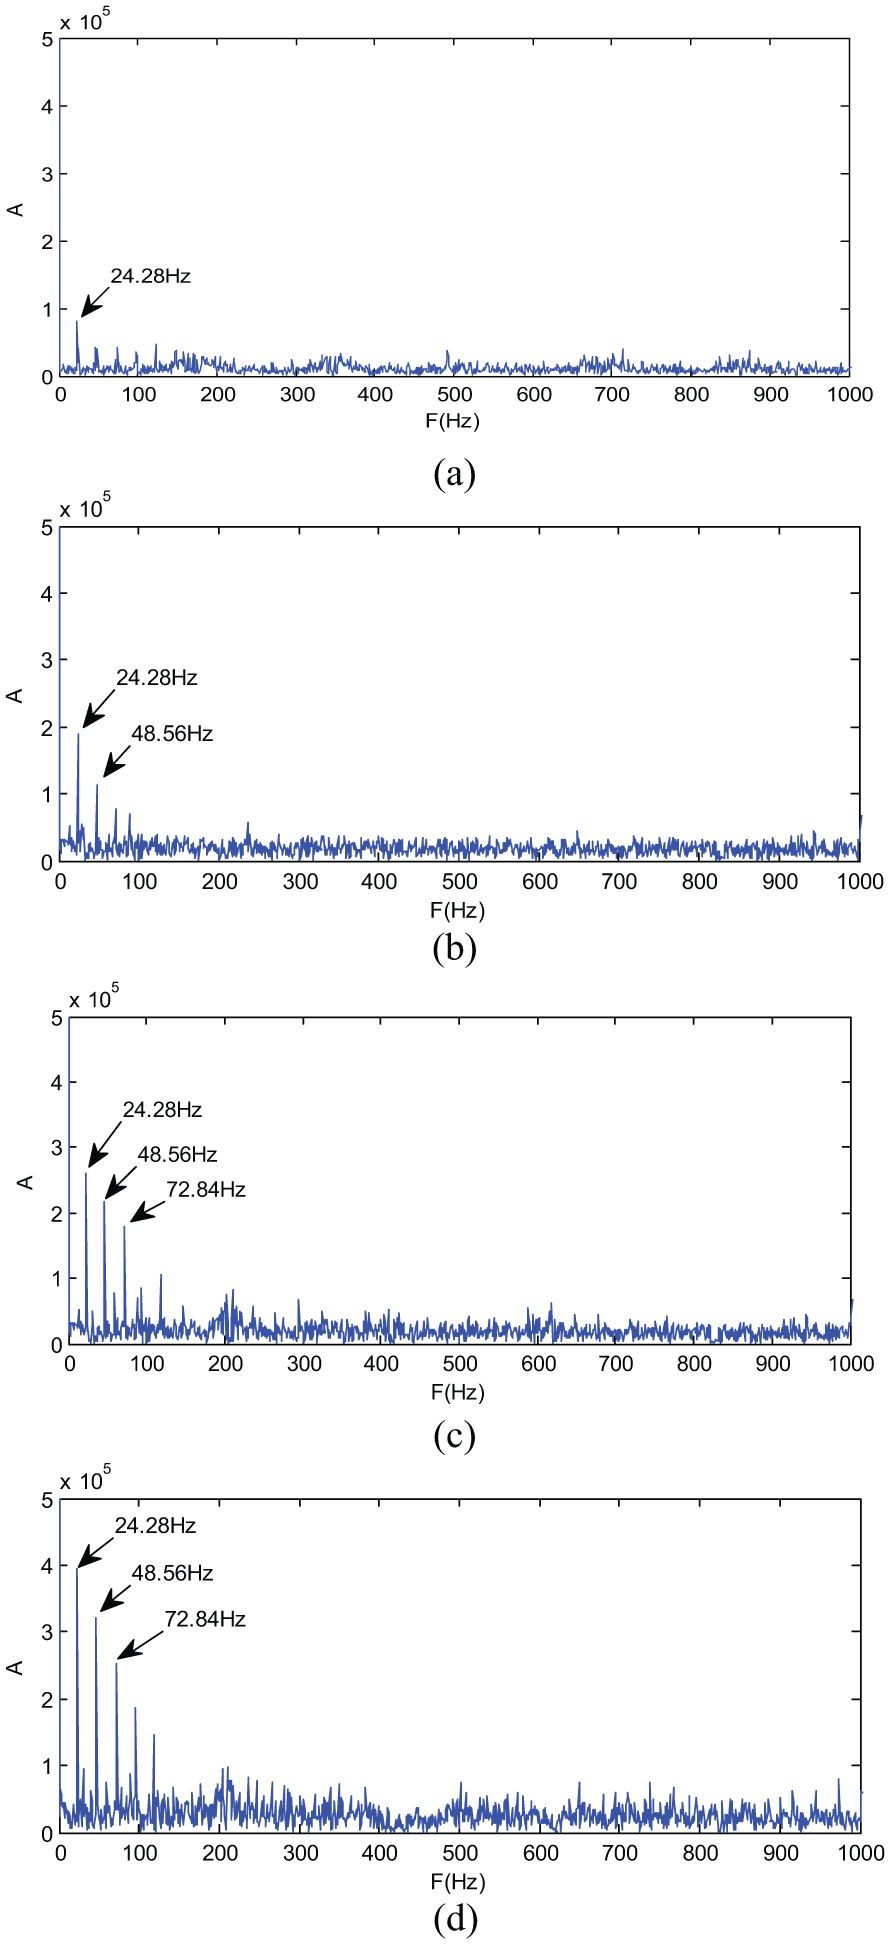
Results of sub-signals separated based on HFHLCD: (a) sub-signal of the normal signal, (b) sub-signal of the 0.15-mm loose slipper signal, (c) sub-signal of the 0.24-mm signal, and (d) sub-signal of the 0.57-mm signal.
Figure 12 shows the results of sub-signal separation based on HFHLCD. Compared with the original signal X, disturbances of abnormal frequency components are effectively reduced and the loose slipper feature information is improved. For signals containing failure information, the energy mainly centers on several frequency bands such as feature frequency band of 24.28 Hz. Along with the aggravation of the loose slipper, the strike on the swash plate from the fault slipper becomes stronger so that the energy in the feature frequency becomes higher. As a result, these separated sub-signals effectively reveal that along with aggravation of loose slipper, feature frequency of 24.28 Hz (≈24.6 Hz) tends to be more obvious and the rate of feature information keeps increasing.
On this basis, the proposed DCT high-order spectral analysis algorithm is carried out to extract features of these five conditions. According to the degradation degree ranging from light to heavy, the separated sub-signals are renumbered {xF1, xF2, xF3, xF4, xF5} and each one contains 12,000 data points. After standardization, each sub-signal is divided into 60 parts and each part has 200 points. Therefore, K = 60 and M = 200. According to equations (21) and (22), we can get DCT coefficient and its triple accumulation of each part. SVD is carried out on estimating matrix by equation (24) and weights of singular values are achieved. On this basis, high-order singular entropies of xF1–xF5 are calculated by equations (26) and (27), which make up the feature vector. The results are shown in Table 2. To further indicate the effectiveness of the features extracted in this article, three other entropies in these five conditions are calculated for comparison, which are the singular entropy of original vibration signal (SE1), the singular entropy of the separated sub-signal (SE2), and the bispectral singular entropy of the separated sub-signal (BSE). The results are also shown in Table 2.
Different features in various loose slipper conditions.

SE1: singular entropy of original vibration signal; SE2: singular entropy of the separated sub-signal; BSE: bispectral singular entropy of the separated sub-signal; HSSE: high-order singular Shannon entropy; high-order singular Tsallis entropy.
The changes in main singular Q1–Q5 along with the degradation aggravation of xF1–xF5 are shown in Figure 13. And the variances of features in Table 2 along with the degradation aggravation are shown in Figure 14 and the changes in these features after normalization are shown in Figure 15.

Changes in main singular values along with the degradation aggravating.

Variances of features along with the degradation aggravating.

Changes in various features along with the degradation aggravating after normalization.
Figure 13 shows the changes in main singular values of xF1–xF5. It is clear that the curves tend to be increasing along with the degradation aggravation, especially Q1. However, the slopes of the curves are not keeping growing. In the position of the 0.38-mm loose slipper, Q4 and Q5 even happen to be decreasing. Consequently, the ability of main singular values to describe degradation is limited.
Figure 14 shows that along with the degradation, entropies are decreasing, which indicates that the system tends to be some unique failure mode. By the comparison of the five curves in Figure 14, SE1 is the highest. The reason can be explained that the original vibration signal contains lots of unnecessary components and the complexity is relatively high. As a result, the extracted feature SE1 is not sensitive enough to degradation. SE2 denotes the singular entropy of the separated sub-signal. Because of the restraining of redundant components, the feature information has been improved so that SE2 is lower than SE1. However, the changes in curve SE2 are still not satisfying. Based on the BA, the performance of BSE for describing degradation is much better than SE1 and SE2. However, the slope of BSE still reduces in certain stage of degradation. On the basis of the triple accumulation of DCT coefficients, HSSE and HSTE, which are proposed in this article, tend to be much more sensitive to the degradation. And the changes in these two curves mainly meet the real degradation process.
Figure 15 shows the changes in each feature along with the degradation in detail. It is clear that after normalization, the performances of SE1, SE2, and BSE are still not satisfying. However, slopes of HSSE and HSTE tend to be obviously increasing, which shows the strong sensitivity to degradation.
Conclusion
A novel method for degradation feature extraction of the hydraulic pump based on HFHLCD sub-signal separation and DCT high-order singular entropy is proposed, which is verified by the hydraulic pump experiment. Conclusions can be drawn as follows:
The sub-signal separation method is proposed. The LCD modified by HFHs is applied in the decomposition of vibration signal, and the sub-signal is obtained by the BSS on the selected ISCs. Noises and disturbances are effectively reduced and the sensitive information is obtained.
The DCT high-order spectral analysis algorithm is presented to extract Shannon and Tsallis singular entropies as features. The sensitivity and performance of the extracted features are effectively improved.
The experimental results of hydraulic pump show that the features extracted by the presented method are effective in revealing degradation and it is meaningful for the realization of condition-based maintenance.
Footnotes
Acknowledgements
The authors appreciate the Guiyang hydraulic pump manufacturers for their support to this experiment. The authors are grateful to the Mechanical Engineering College, China, for providing the experimental situation. The authors also express their sincere appreciation to the anonymous.
Academic Editor: Neal Y Lii
Declaration of conflicting interests
The author(s) declared no potential conflicts of interest with respect to the research, authorship, and/or publication of this article.
Funding
The author(s) disclosed receipt of the following financial support for the research, authorship, and/or publication of this article: This project was supported by National Natural Science Foundation of China (grant no. 51275524).