
Abstract
Hydraulic pump degradation feature extraction is a key step of condition-based maintenance. In this article, a novel method based on local characteristic-scale decomposition (LCD) and discrete cosine transform–composite spectrum (DCS) fusion algorithm is proposed. In order to reduce noises and other disturbances, vibration signals are first processed by LCD with the high frequency harmonic. Detail components with sensitive information are achieved by the selection of intrinsic scale components. Furthermore, on the basis of the earlier composite spectrum (CS), the DCS fusion algorithm is proposed to make fusion of the obtained detail components for improving the feature performance. The DCS entropy is extracted as the fault degradation feature. Analysis of the hydraulic pump degradation experiment demonstrates that the proposed algorithm is feasible and effective to indicate the performance degradation of the hydraulic pump.
Keywords
Introduction
Since the hydraulic pump is one of the most important components of the hydraulic system, it has direct effects on the reliability of the whole system. 1 Unlike the rolling bearing, the structure of the hydraulic pump is complex. Its vibrations are mainly caused by the striking of the swash plate by pistons and by the inherent mechanisms such as bearing.2,3 Furthermore, the liquid compressibility and the coupling effect between fluid and solid may influence the abrasion of pistons and the swash plate. 4 Therefore, the vibration signal of hydraulic pump seems to be so complicated and nonlinear that it is hard to effectively extract the feature information. Consequently, an effective method is required for extracting the appropriate fault feature.
Feature extraction methods can be divided into two categories: the one is the failure mode feature extraction. It is required that the extracted features should be sensitive enough to distinguish various failure modes. Many studies have been performed in failure mode feature extraction and the typical methods are the wavelet transform and the empirical mode decomposition (EMD). Wavelet transform is able to divide the signal into various frequency bands and obtain useful information.5,6 However, in wavelet transform, selection of the threshold and the wavelet basis can hardly be completely solved. EMD is capable of dividing the signal into several components and searching for useful fault information in each component.7,8 Since the mode fixing and the end effect are severe, the sensitive information may not be accurately extracted by EMD sometimes. The other category is the degradation feature extraction which requires the extracted features to be sensitive to the degradation changes. Because of the complex degradation vibration signals and the weak feature information, fewer researches are carried out in this field.
In order to obtain the sensitive information and improve the feature performance, the fusion algorithms are required to deal with multi-channel vibration signals. Currently, various fusion algorithms have been proposed for mechanical signal analysis, such as the weighted fusion, the Kalman filtering and the wavelet analysis.9,10 However, the weighted fusion algorithm is subjective to adjust the fusion weights.11,12 The Kalman filtering algorithm lacks the strict filtering functions for nonlinear system.13,14 The wavelet analysis fusion algorithm may lose some sensitive information during the sampling operation. 15 Consequently, the fusion performances based on these conventional algorithms are not appropriate for degradation feature extraction. As a novel fusion algorithm, composite spectrum (CS), based on Fourier transform, is able to realize information fusion of various signals by calculating the correlative index and the mutual power spectrum of neighboring signals. 16 It can effectively restrain noises and obtain sensitive feature information of signals simultaneously. 17 Considering the structural characters of hydraulic pumps, some modifications have to be made on the CS algorithm in this article so as to extract the effective and sensitive feature. On one hand, the CS algorithm itself needs to be improved to solve the information losing problem. Being the spread of Fourier transform, discrete cosine transform (DCT) has the property of energy aggregation. 18 Its coefficients are sensitive to energy changing. 19 Therefore, it is reasonable to replace Fourier transform by DCT to improve the feature sensitivity. On the other hand, an appropriate method is required for CS fusion to obtain detail components from the original signals, which contain sensitive feature information. Local characteristic-scale decomposition (LCD) algorithm, which is an efficient nonlinear signal processing method, is able to adaptively divide a complex signal into several intrinsic scale components (ISCs).20,21 As a result, the feature information in original signal is detailed into various ISCs. The sensitive information is relatively easy to be achieved for CS fusion.
The article is organized as follows: In section “Detail components obtaining by LCD,” the LCD is simply introduced and the method for obtaining the detail component by the selection of ISCs based on the mutual information is presented. Meanwhile, the proposed method is applied in simulation signal analysis; in section “The proposed LCD-DCS fusion algorithm for degradation feature extraction,” the DCT-composite spectrum (DCS) fusion algorithm is proposed and degradation feature extraction by LCD-DCS is discussed in detail; in section “Experimental results,” we confirm the results through the degradation experiment of the hydraulic pump. In the final section, we draw some conclusions.
Detail components obtaining by LCD
Decomposition of the vibration signal by LCD
In common LCD algorithm, the first achieved ISC always contains a wide range of frequencies. According to the cubic spline interpolation, some useful pulse components may be remained in the first ISC together with some abnormal components. To solve this problem, the high frequency harmonic (HFH) 22 is applied in LCD. The algorithm is detailed as follows.
1. Add the proper HFH into the original signal


where x(t) denotes the original signal and H(t) means the HFH. U is the amplitude, always using U = max{x(t)}. f is the frequency which can be taken as f = fs/2.
2. Confirm the extremum point
3. Calculate

Obtain the left and right extremum points by prolongation and calculate
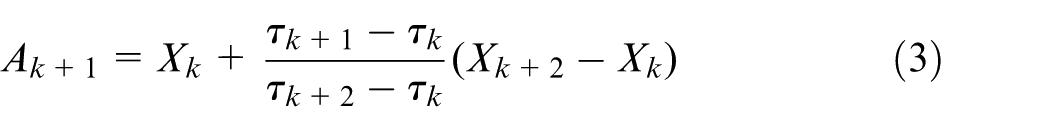
4. Fit L1–LK by the cubic spline function and acquire the baseline

If
5. Separate ISC1 from the original data and get the new signal. Then repeat (2)–(4) until
It is clear that, based upon LCD, the feature information is specifically detailed in various ISCs. Therefore, the sensitive information becomes much easier to be obtained.
Selection of ISCs
Assume that X1–X3, respectively, denote vibration signals probed by sensor1–sensor3. According to equations (1)–(5), X1–X3 are decomposed by LCD. The achieved ISCs collections are ISC-1 = {ISC11, ISC12, … , ISC1U}, ISC-2 = {ISC21, ISC22, … , ISC2U} and ISC-3 = {ISC31, ISC32, … , ISC3U}. In order to reduce disturbances and improve the feature sensitivity, it is necessary to make selection of these ISCs for the required detail components. As is analyzed that the more independent the ISC is, the more sensitive information of the original signal can be revealed. Therefore, the mutual information is applied as the evaluation rule for ISCs selection. The ISC with less mutual information tends to be more independent. For declining computation, the mutual accumulation 24 is used to approximatively calculate the mutual information by equation (6)
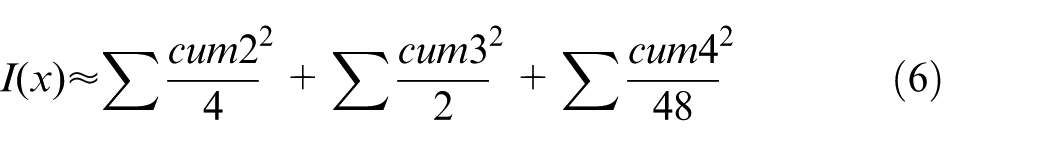
where cum2, cum3 and cum4, respectively, denote the second-order, third-order and fourth-order mutual accumulation of x.
Based on the ISCs collection of each signal, the one with the least mutual information is selected as the detail component, and other ISCs are abandoned. Therefore, noises and unnecessary components are effectively reduced so that it is easier to obtain the sensitive feature information.
Simulation analysis
In order to verify the performance of the proposed algorithm, simulation analysis is carried out in this section. Assume that f


where each signal consists of two parts, which are the degradation signal a1(t) and the harmonic signal a2(t). a1(t) means the simulation of the periodic pulse signal
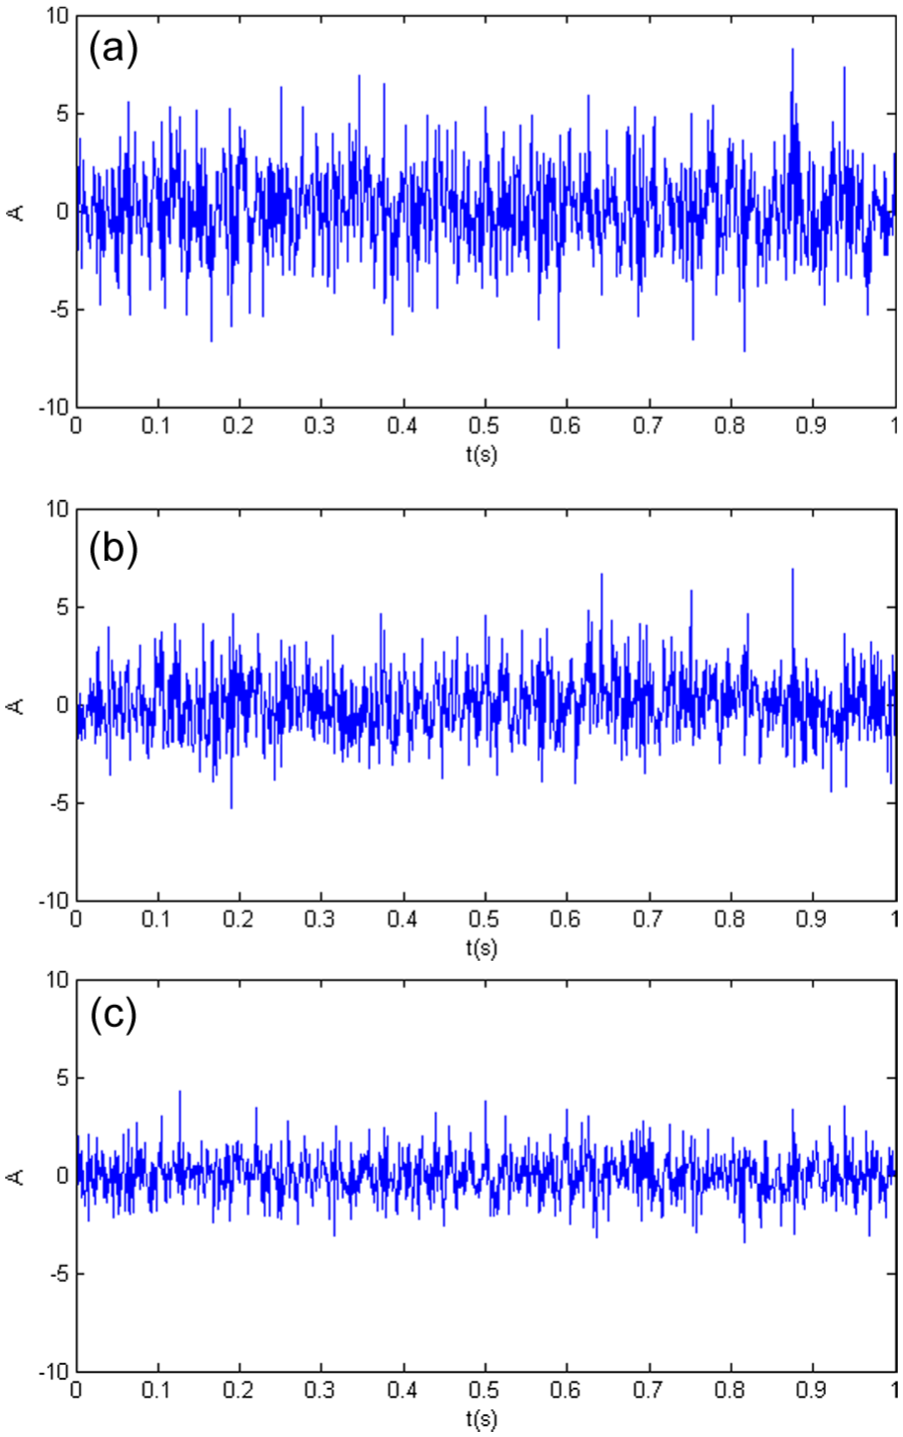
Time domains of simulation signals: (a) time domain of y1–6(t), (b) time domain of y2–6(t) and (c) time domain of y3–6(t).
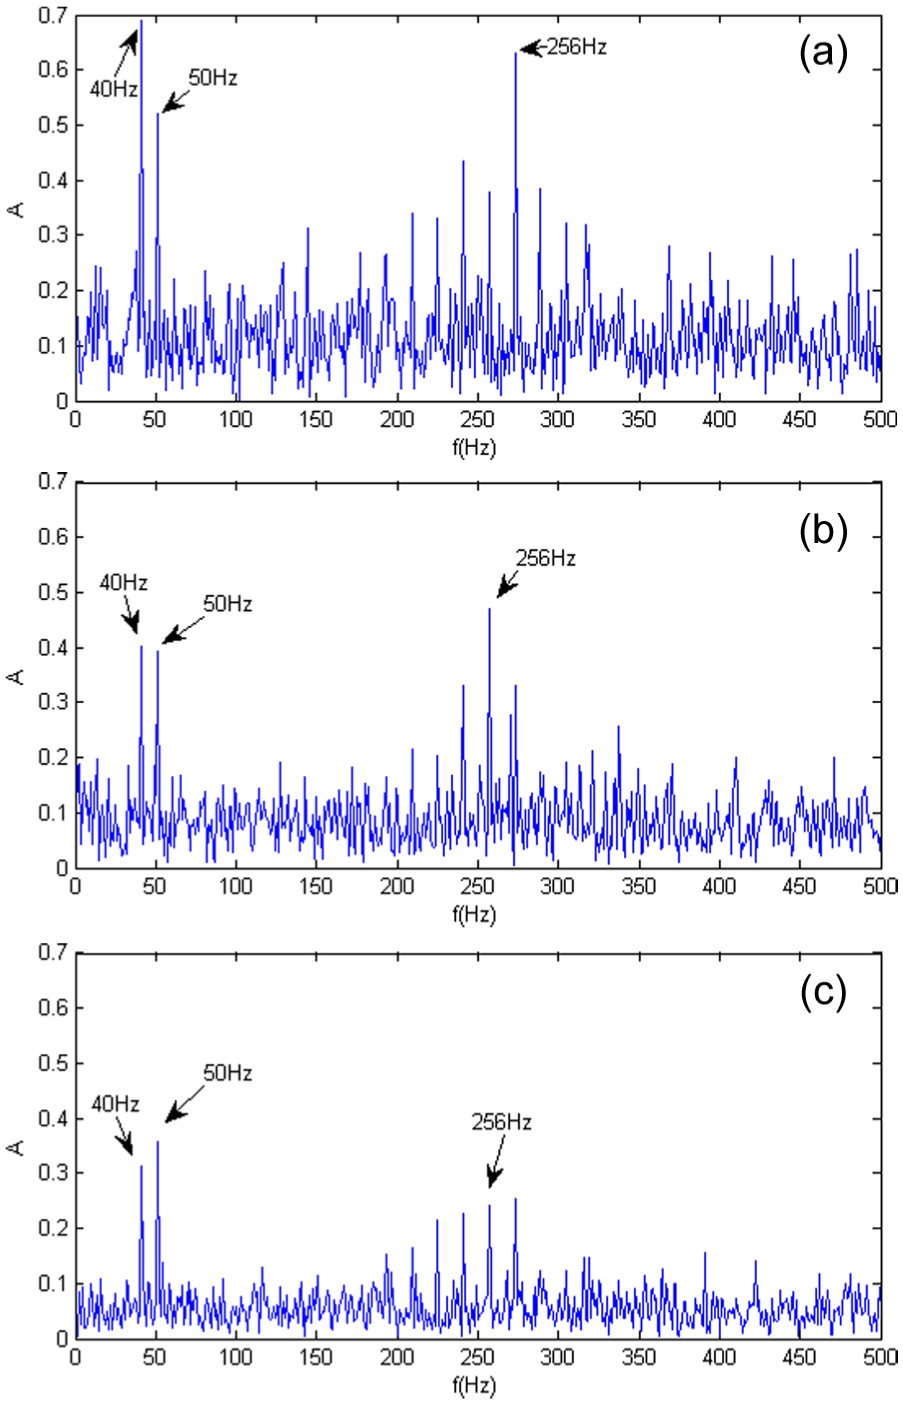
Frequency domains of simulation signals: (a) frequency domain of y1–6(t), (b) frequency domain of y2–6(t) and (c) frequency domain of y3–6(t).
Figure 2 obviously shows that, in all simulation signals, there are harmonics of 40 and 50 Hz and the modulation in the resonant frequency of 256 Hz. The fault feature frequency 16 Hz is severely influenced by disturbances. In the following, the proposed method is utilized to achieve detail components.
According to equations (1)–(5), y1–6(t) is decomposed by LCD. Eight ISCs and one trending component are obtained. Based on equation (6), the mutual information of these eight ISCs are 7.05 × 10⁴, 2.6515, 0.0354, 6.2 × 10⁻³, 2.8 × 10⁻³, 5.94 × 10⁻⁴, 5.92 × 10⁻⁵ and 8.1 × 10⁻³. Because of the application of HFH, noises and disturbances are mostly remained in ISC11. The mutual information of ISC11 is much higher than the others. According to the presented selection rule, the mutual information of the seventh ISC (ISC17) is the lowest. Therefore, the ISC17 is selected as the detail component of y1–6(t). The same method is applied in y2–6(t) and y3–6(t). ISC25 and ISC37 are selected as other two detail components. Frequency domains are shown in Figure 3.
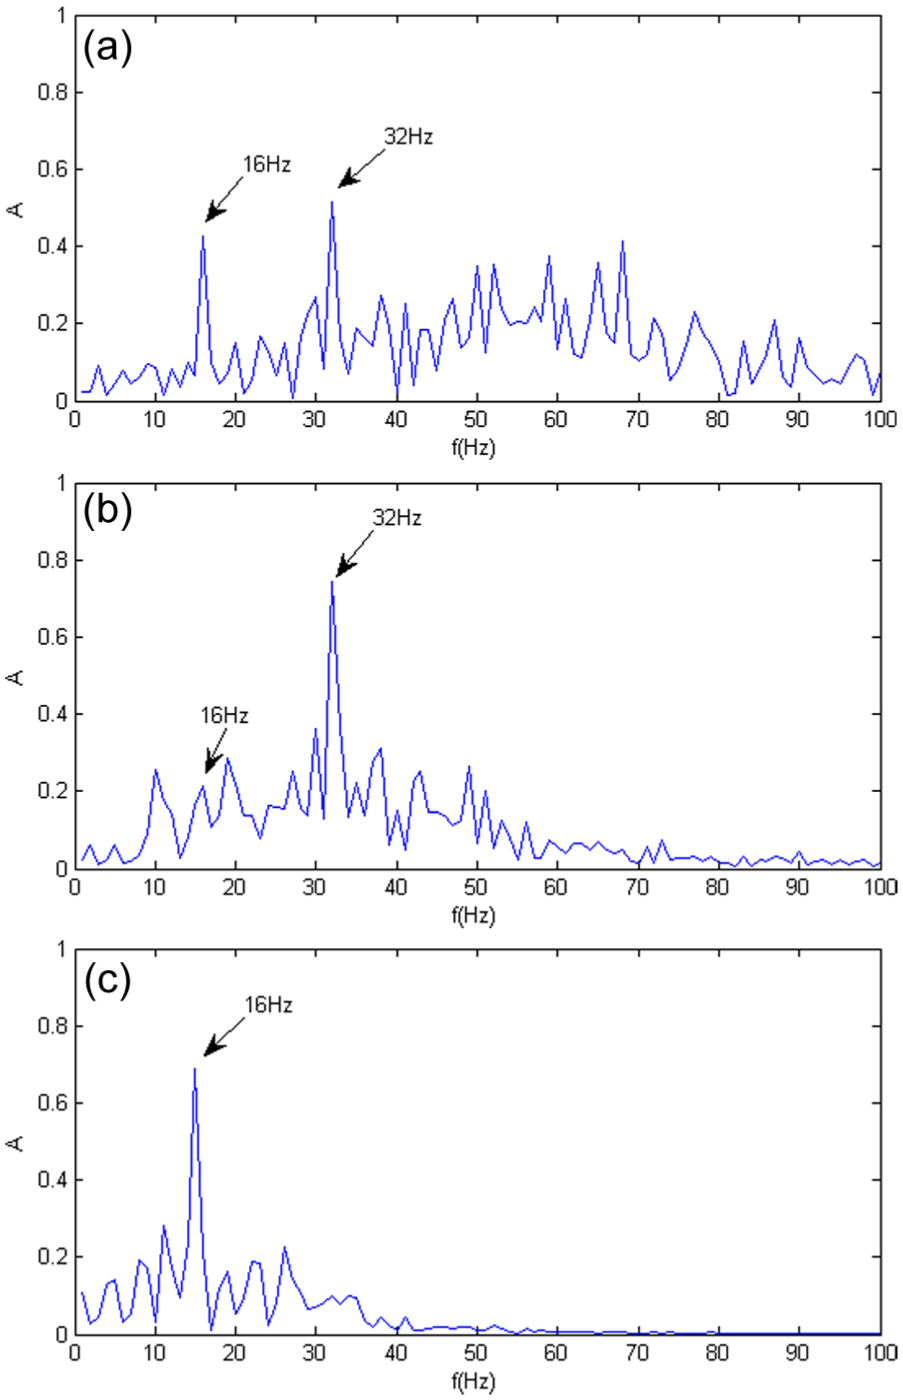
Frequency domain of detail components: (a) frequency domain of ISC17, (b) frequency domain of ISC25 and (c) frequency domain of ISC37
Figure 3 shows the three detail components obtained by the proposed method. Compared with original signals in Figure 2, noises and disturbances are mostly reduced. The sensitive frequency 16 Hz is effectively obtained in detail components. Simulation analysis result indicates that feature information in detail components is better improved and the sensitive information is effectively obtained.
The proposed LCD-DCS fusion algorithm for degradation feature extraction
DCS fusion algorithm
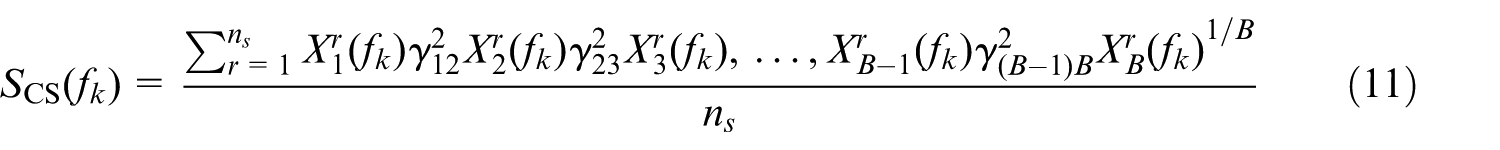
Assume that the number of the sampled signals is B. Each signal is equally divided into
where
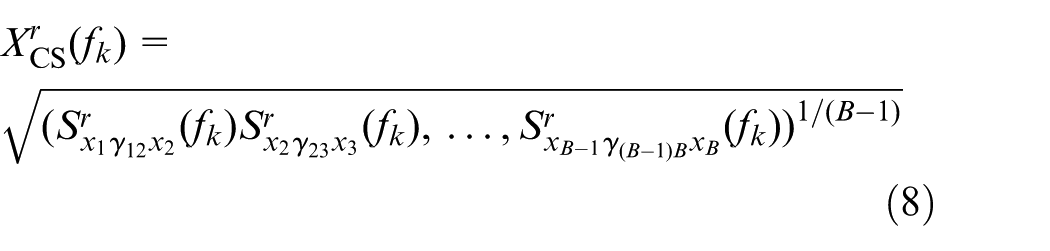
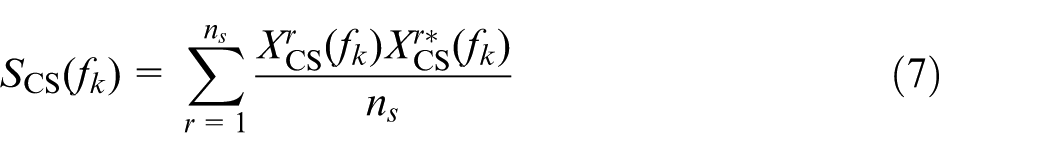
where

It is clear that the CS algorithm is capable of realizing fusion of various signals. The spectrum
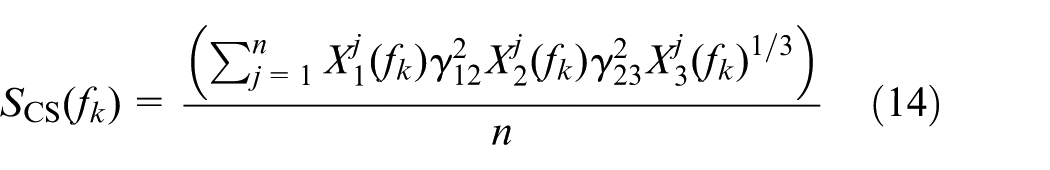
As a result, the DCS fusion algorithm is proposed in this article. To improve the feature performance, Fourier transform in earlier CS is replaced by DCT to make full uses of the high sensitivity of DCT coefficients. The signals are first divided into K parts. Each part contains M points. The DCT coefficients are defined by the following formula 18
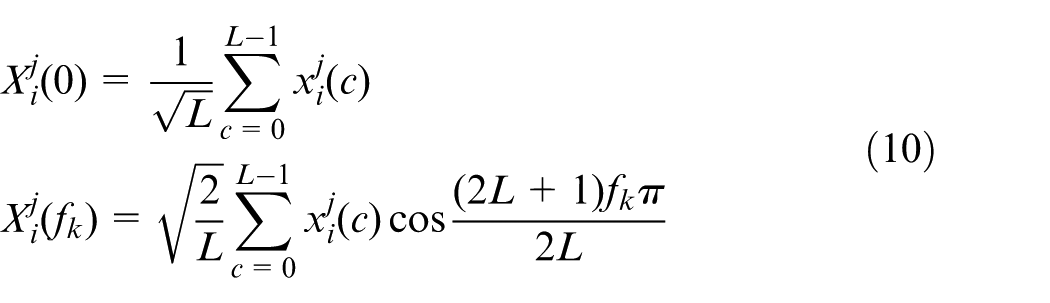
where
Compared with equation (7), DCS fusion algorithm employs DCT instead of Fourier transform. All coefficients are real numbers. Consequently, equation (11) is able to combine equation (8) with equation (9) to avoid information losing caused by the multiplication between the Fourier coefficient and its complex conjugate. Furthermore, the high sensitivity of DCT coefficients is introduced in the proposed DCS algorithm. Theoretically, the feature performance may be effectively improved.
Degradation feature extraction by LCD-DCS
As an effective spectral analysis parameter, spectrum entropy is able to generally describe the performance degradation trend. Therefore, the DCS-composite spectrum entropy (DCSE) is extracted as the feature. Three-channel vibration signals are taken for research in this article. Procedures for degradation feature extraction based upon LCD-DCS are detailed in the following.
Step 1. Utilize the LCD with HFH to deal with three-dimensional (3D) vibration signals and achieve three detail components (specific algorithm is indicated in section “Detail components obtaining by LCD”).
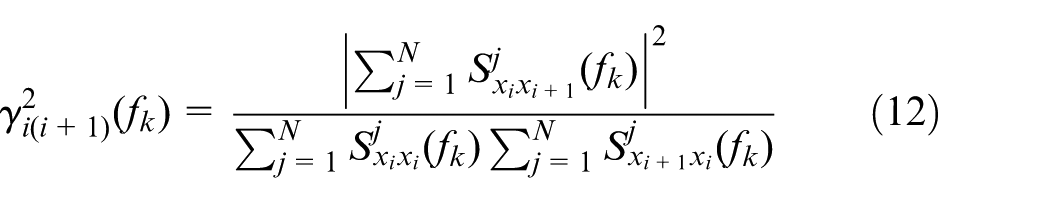
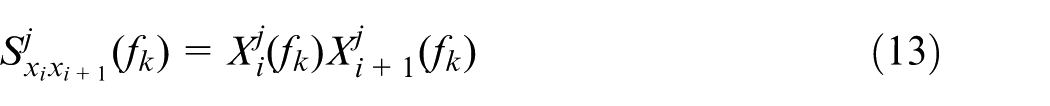
Step 2. Make fusion of the detail components by the proposed DCS algorithm. Step 2.1. Divide each detail component into n parts. Conduct DCT in each part and obtain Step 2.2. Calculate the correlation coefficient between the ith component and the (i + 1)th component in frequency
where
where Step 2.3. Calculate the CS
Step 3. Calculate the DCSE, which is defined as follows
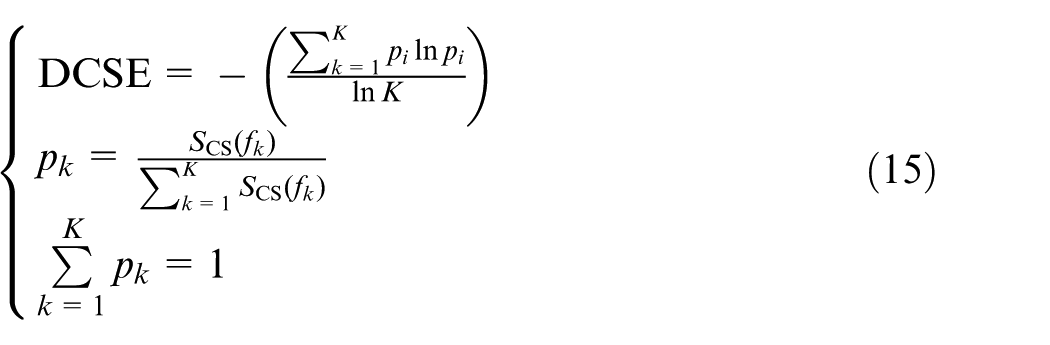
where K means the number of the frequency bands. Based on the fusion of various detail components, the extracted DCSE is sensitive to the energy changing. When the fault degradation degree is light, the energy distributes in frequency bands in balance and the DCSE will be higher. When the degree is heavy, the energy mainly centers on certain frequency bands and the DCSE will be lower. Flowchart of the proposed method is shown in Figure 4.
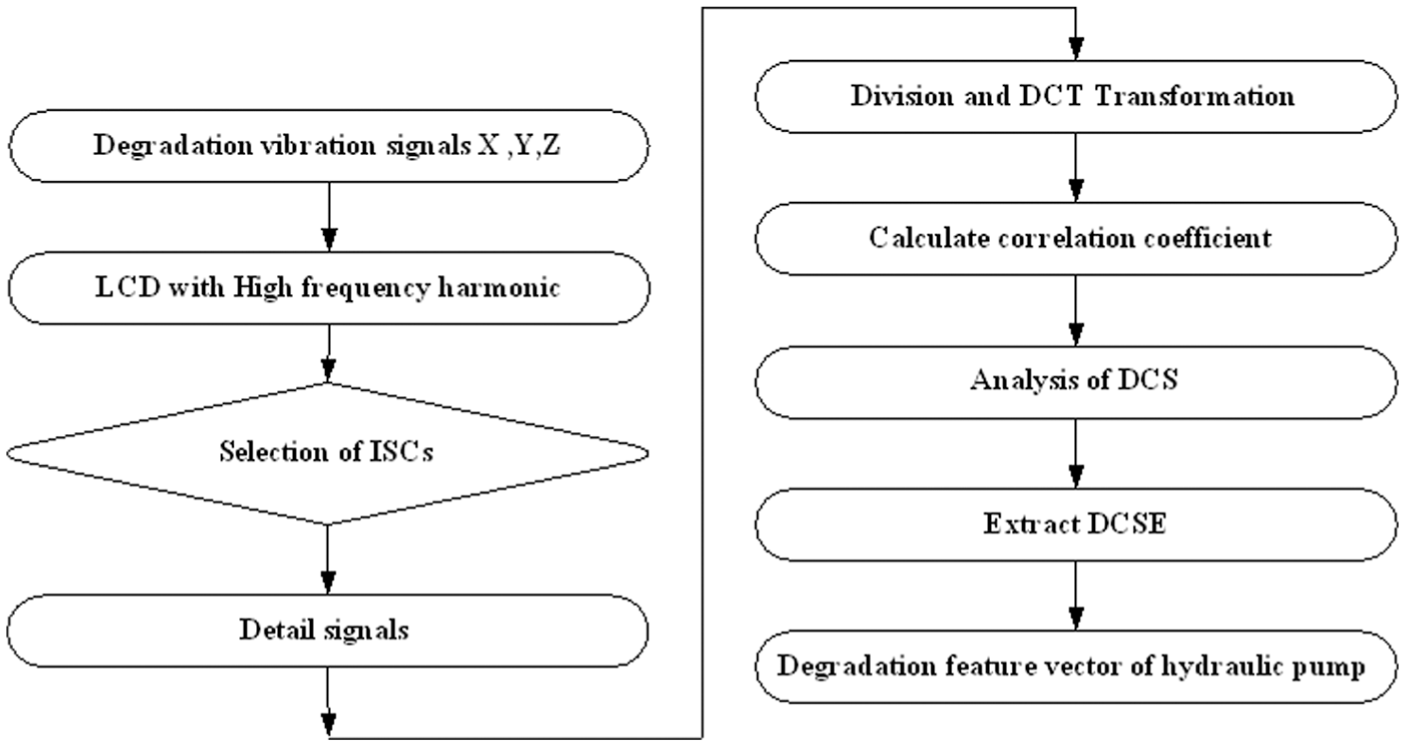
Flowchart of degradation feature extraction based on LCD-DCS fusion algorithm.
Experimental results
Sampling of the hydraulic pump degradation data
In order to obtain the real degradation data, the experiment was carried out on the hydraulic pump test-bed, which is shown in Figure 5. The hydraulic pump tested was L10VSO28DFR. Its rated speed was 2200 r/min and the working pressure was 28 MPa. The driving dynamo was YPT-280M-2, which had the settled speed of 0–3000 r/min.
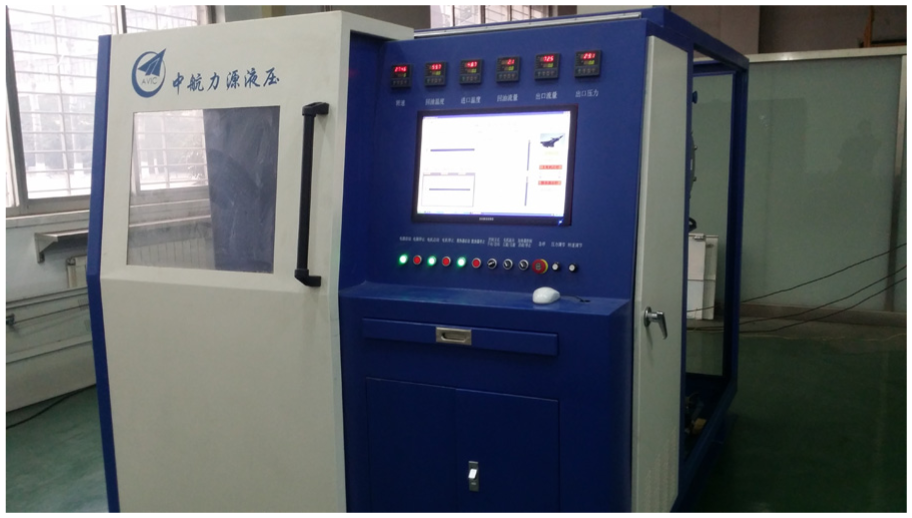
Test-bed for hydraulic pump degradation experiment.
Since the degradation period of hydraulic pump is so long, in order to improve the efficiency, a new hydraulic pump was taken for degradation experiment under the accelerated condition that the settled pressure was 29 MPa (29 MPa = 1.036 × 28 MPa) and the speed was 2780 r/min (2780 r/min = 1.264 × 2200 r/min). Three vibration sensors (603C01) were, respectively, installed on X-, Y- and Z-directions of the hydraulic end cap, which is shown in Figure 6. 3D vibration signals were sampled and stored by cDAQ-9171 system of the NI Corporation. The sampling frequency was 5200 Hz and the sampling time was 10 s. Interval time was 600 s. Specific parameter setting is shown in Figure 7 and the operation interface is described in Figure 8.
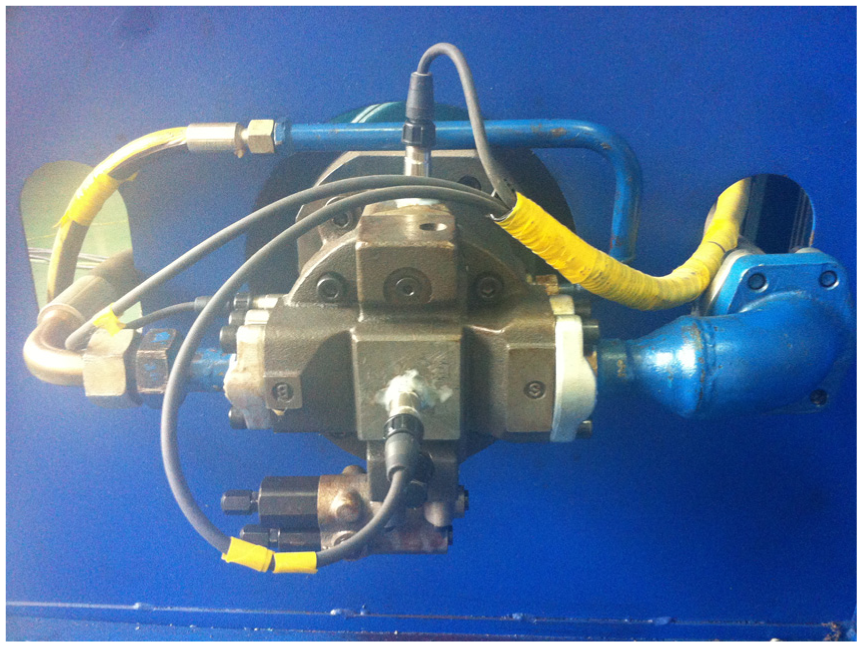
Installation of three-dimensional sensors.
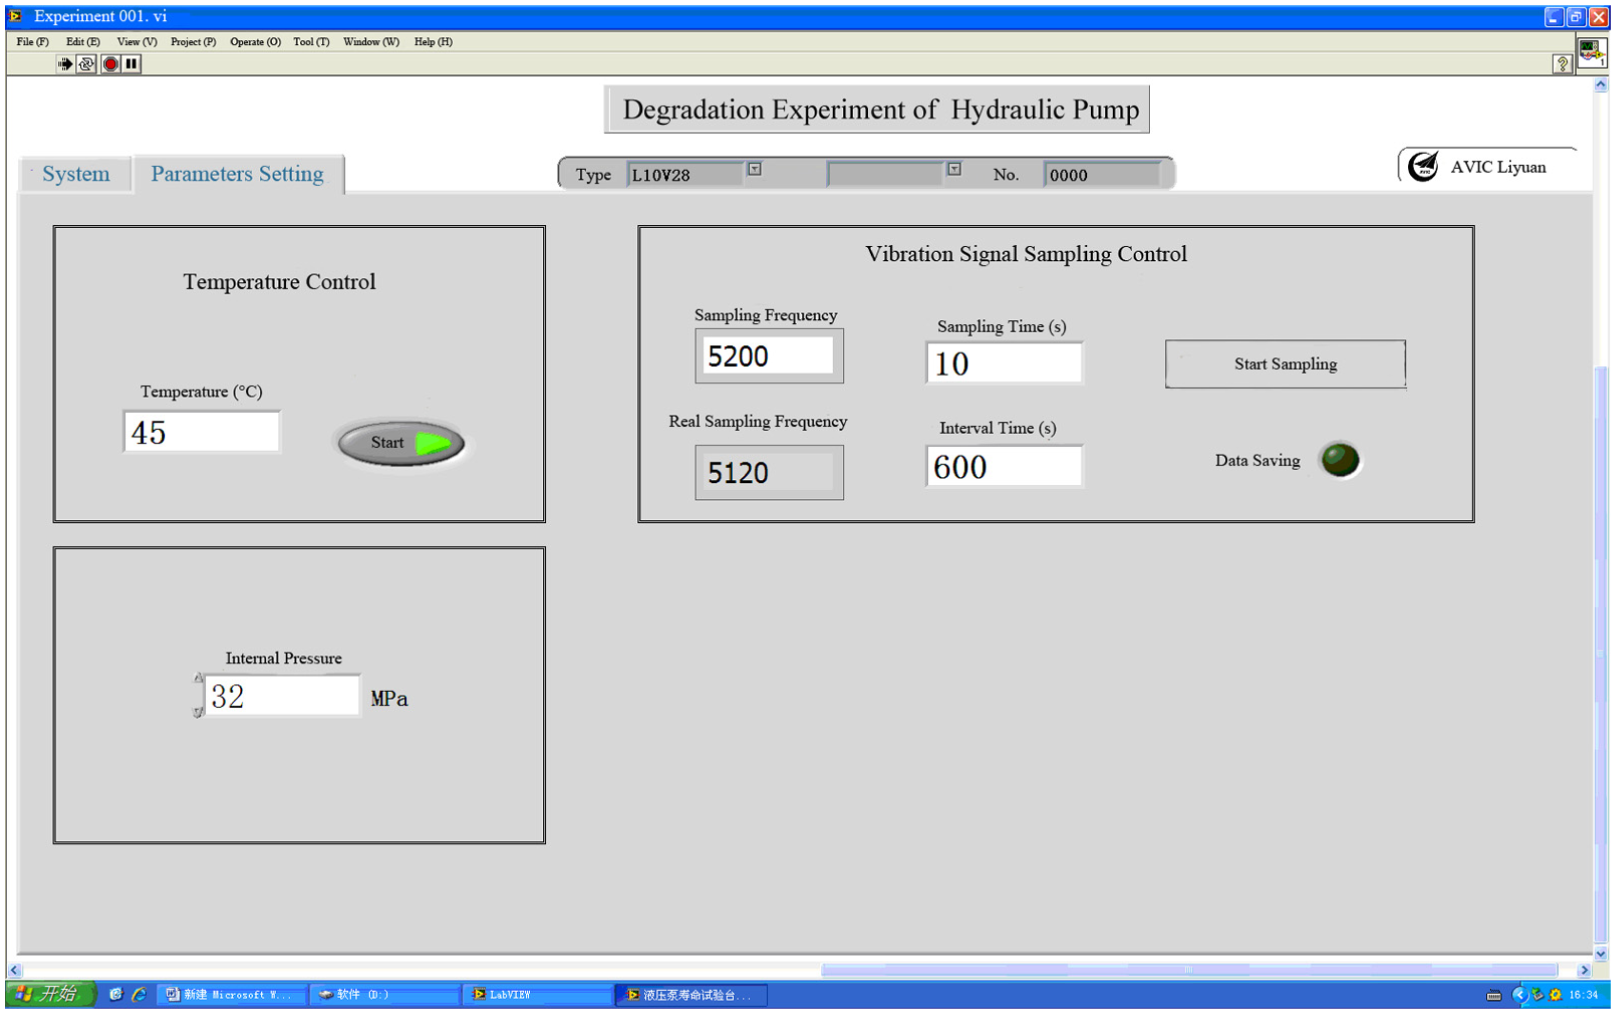
Parameter setting interface.
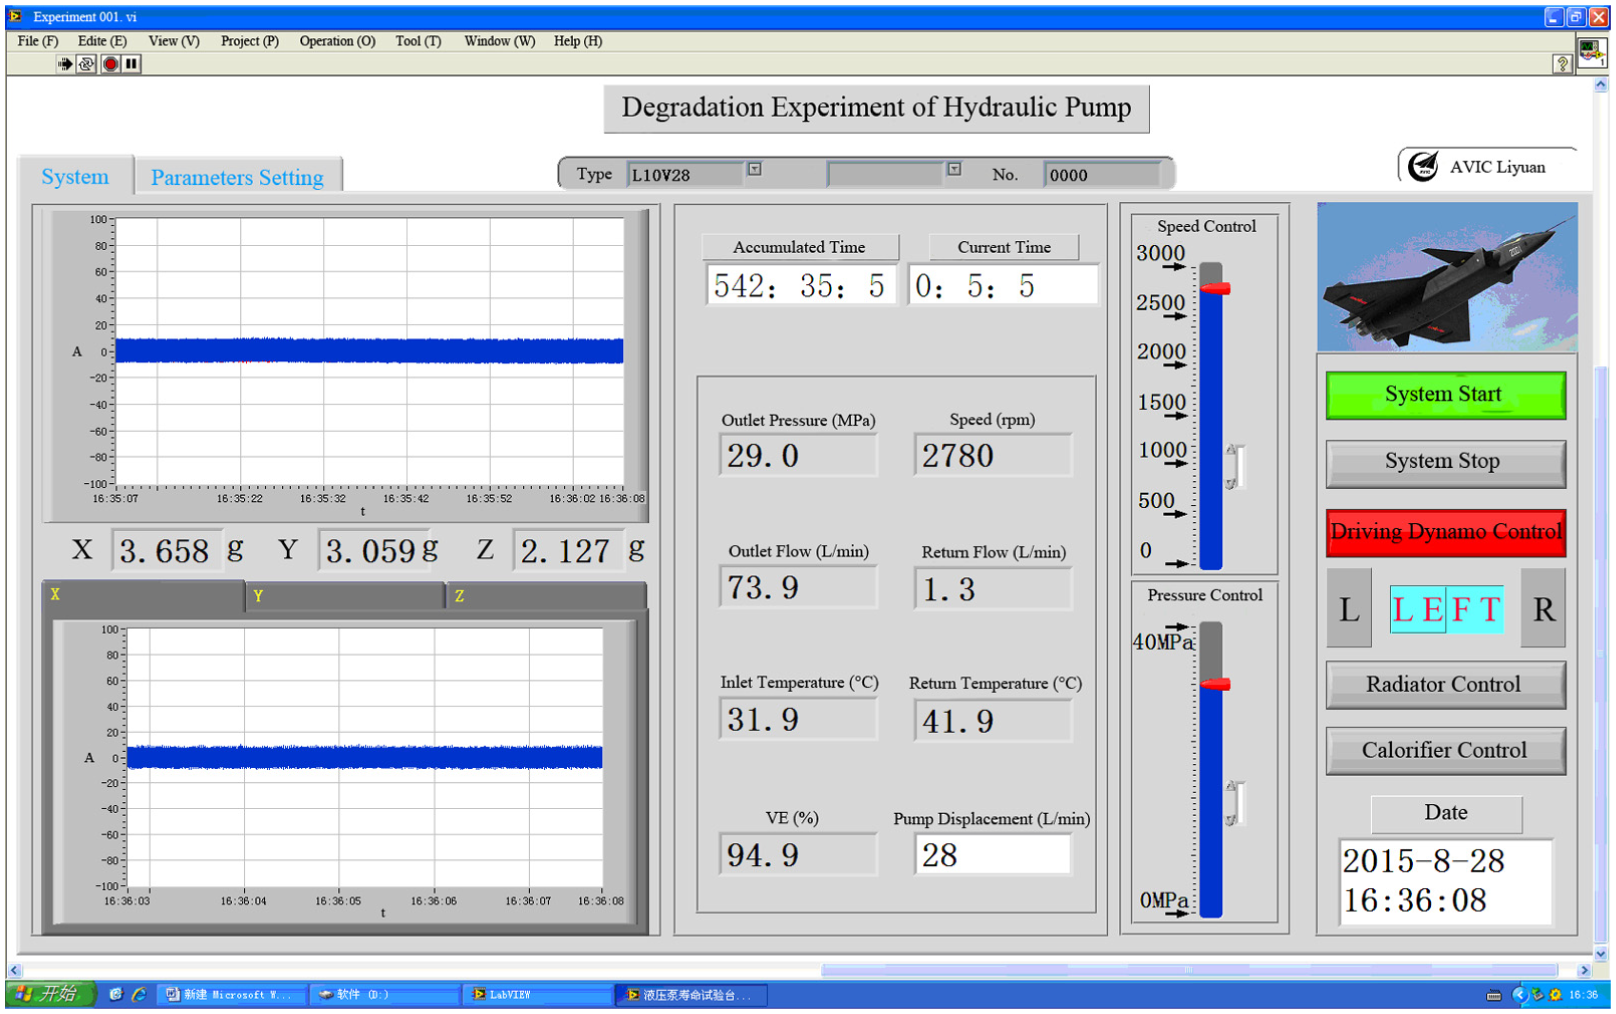
Operation interface.
In Figure 7, the top left part shows the temperature control for the radiator switch which was set as 45 °C. The part below the temperature control is the internal pressure which was 32 MPa. The top right part is the vibration sampling control switch and related parameters, which contain the sampling frequency 5200 Hz, the sampling time 10 s, the real sampling frequency 5120 Hz and the interval time 600 s.
Figure 8 shows the print-screen of the operation interface in 542 h 35 min 5 s of the whole degradation experiment. The left two parts, respectively, show the real-time vibration signals and the past ones. The middle part shows the current condition of the experimental pump, which contain the accumulation experimental time, 542 h 35 min 5 s; the current operating time, 5 min 5 s; the outlet pressure, 29 MPa; the speed, 2780 r/min; the outlet flow, 73.9 L/min; the return oil flow, 1.3 L/min; the inlet temperature, 31.9°C; the return oil temperature, 41.9°C; the volumetric efficiency (VE), 94.9%; and the pump displacement, 28 L/min. The right parts show the state of the experimental system, such as the adjusting bars of the speed and the pressure, the system start and stop control buttons, and the radiator and the calorifier control buttons.
The VE is employed as the hydraulic pump performance index in the experimental system. If VE is lower than 80%, the pump reaches the failure state. In other words, the degradation process is over. In this experiment, when the operating time was 34,935 min, VE was lower than 80%. The pump was confirmed failed by the experimental system and the experimental operation was shut down automatically. After the experiment, the tested pump was disassembled. The failure mode was confirmed the single loose slipper, which is shown in Figure 9.
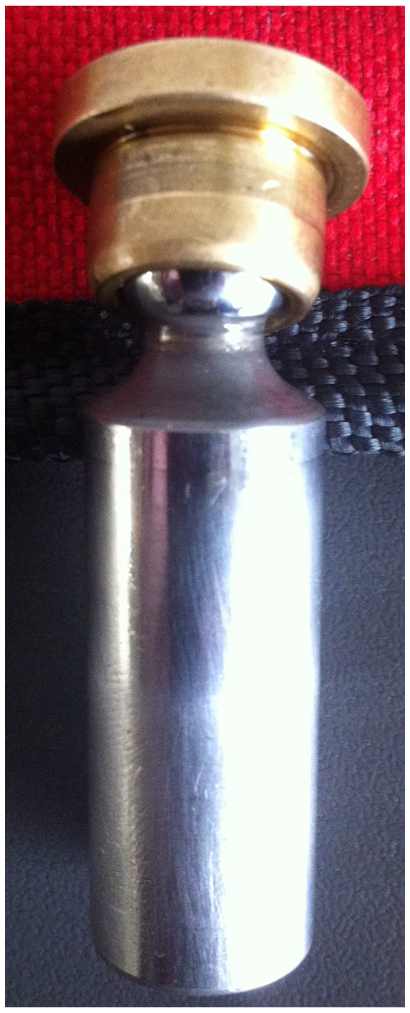
Failure of the loose slipper.
Based on the manufacturer criterion, the whole degradation process can be divided into several stages, which are shown in Table 1.
Various degradation stages.
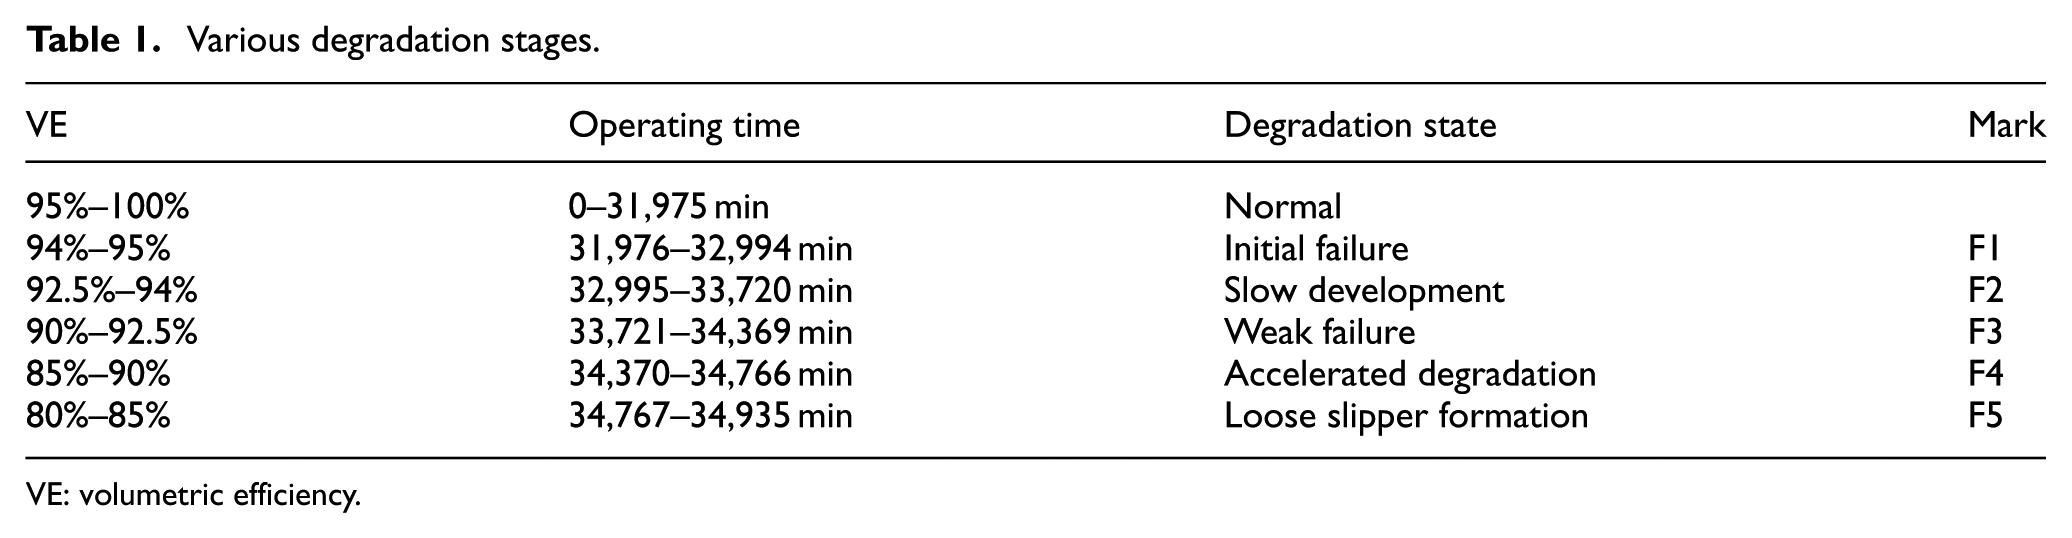
VE: volumetric efficiency.
Five samples are, respectively, taken from each of the above five degradation periods (F1–F5) for analysis. {xF1, xF2, … , xF5} is defined to represent these five samples. Every sample contains 3D vibration signals and the sampling time is 1 s. Each signal contains 5200 points. xF4 is taken for analysis in detail in this article. Frequency domain of its 3D vibration signals is shown in Figure 10.
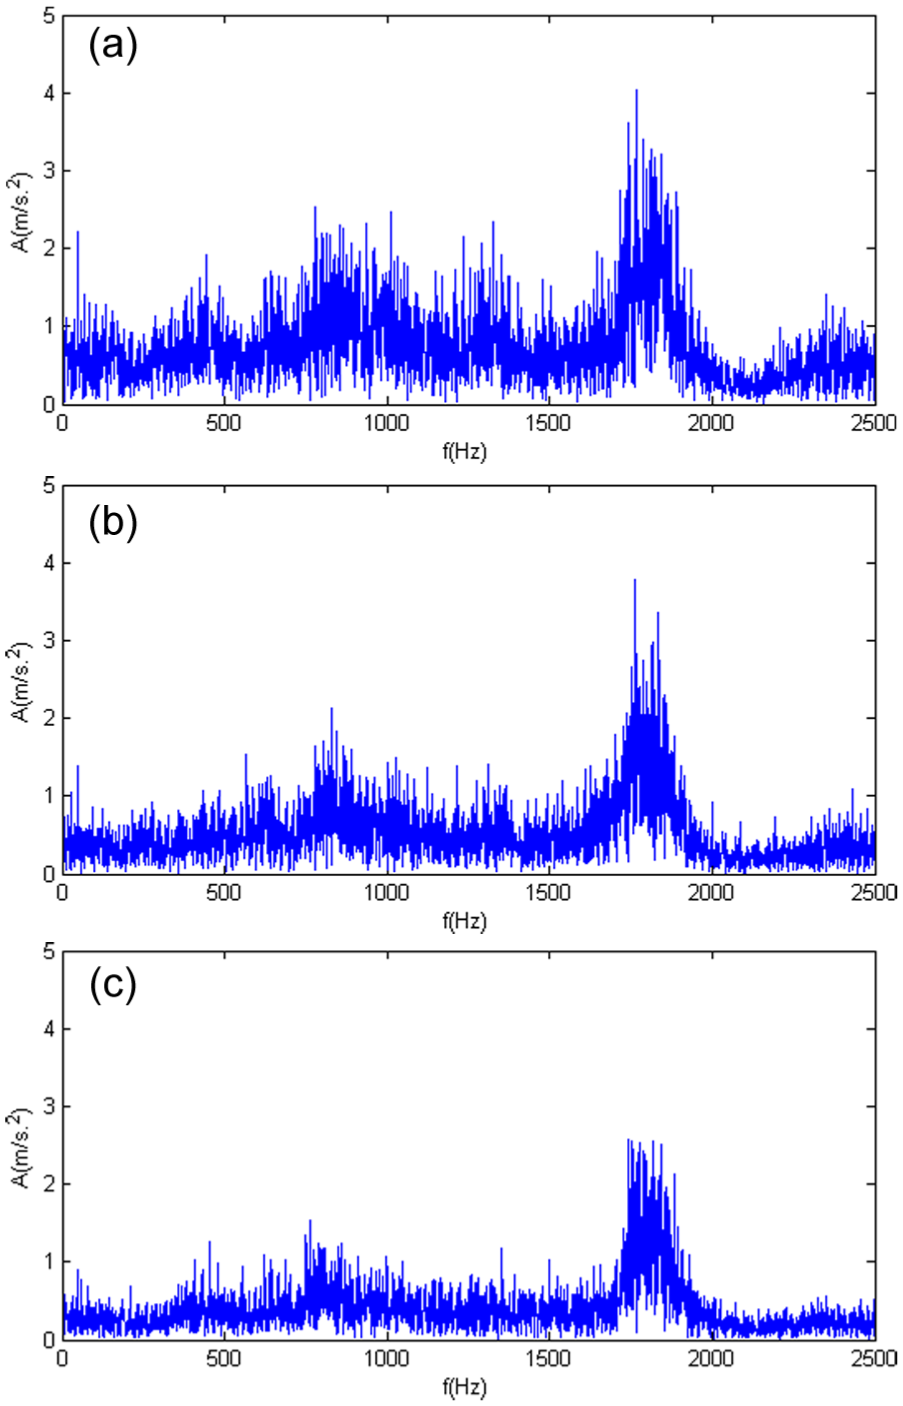
Frequency domains of the vibration signals xF4:(a) frequency domain of xF4-X, (b) frequency domain of xF4-Y and (c) frequency domain of xF4-Z.
Since the real speed of the pump is 2780 r/min, the rotating bearing frequency is 2780/60 = 46.3 Hz. As there are nine pistons, the inherent striking frequency of the pump is 46.3 × 9 = 417 Hz. For the single loose slipper fault, its feature frequency should be equal or approximate to the rotating bearing frequency 46.3 Hz. However, both the inherent frequency and the fault feature frequency are not able to be seen in Figure 10. We can hardly get any useful feature information. Therefore, the method proposed in this article is applied in the following.
Degradation feature extraction based on LCD-DCS
First of all, detail components need to be obtained from original signals xF4-X, xF4-Y and xF4-Z. According to equations (1)–(5), vibration signals are decomposed by LCD. Based on the ISCs selection with the mutual information, the achieved detail components are ISCX4, ISCY7 and ISCZ5. Frequency domains of the detail components are shown in Figure 11.
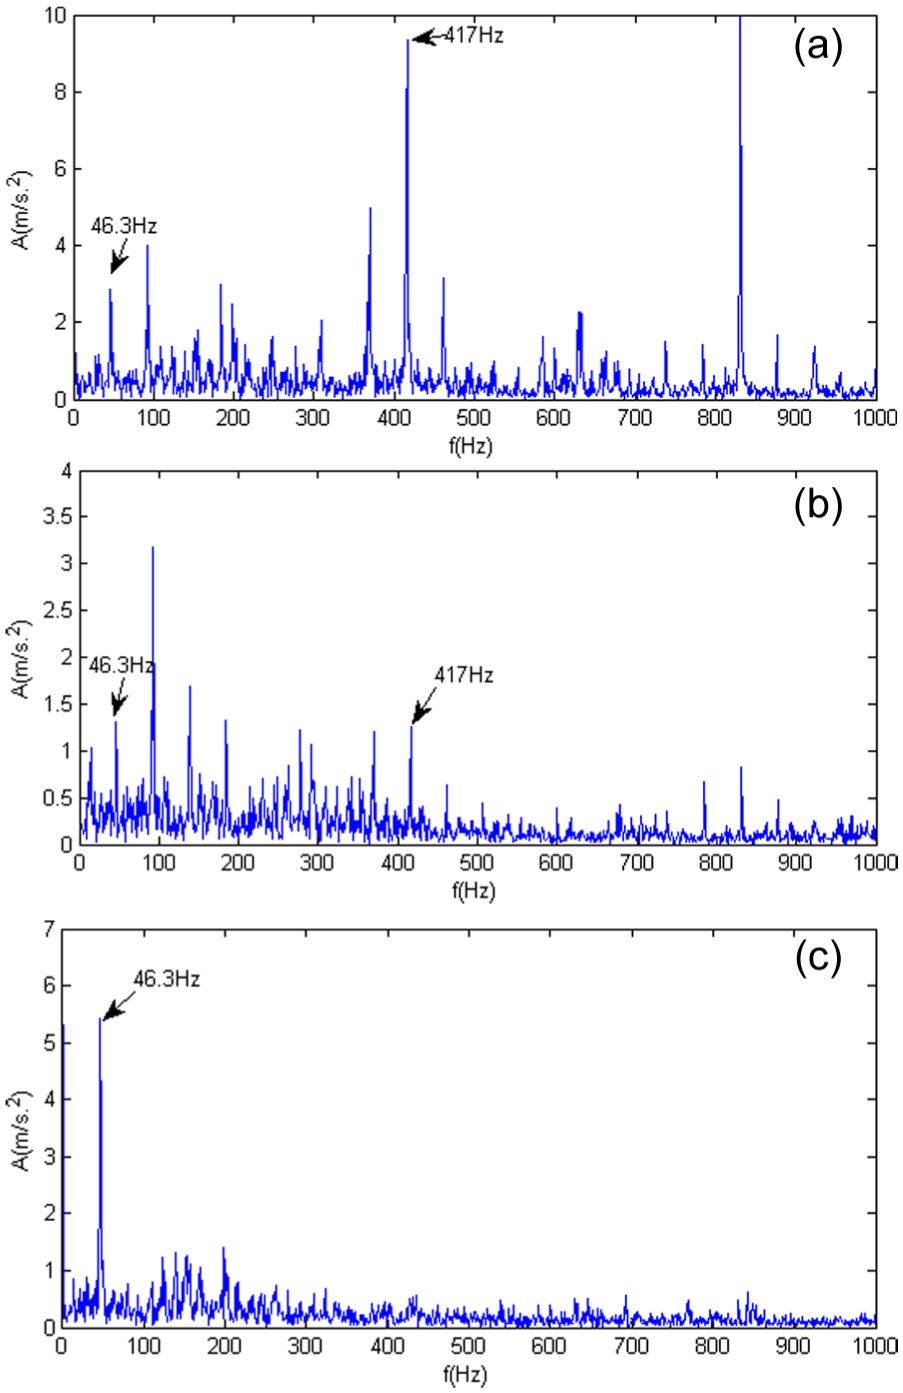
Frequency domains of the obtained detail components: (a) frequency domain of ISCX4, (b) frequency domain of ISCY7 and (c) frequency domain of ISCZ5.
Figure 11 shows that, because of LCD processing and ISCs selection, noises and other disturbances are mostly reduced. The sensitive information of the loose slipper frequency 46.3 Hz and the inherent frequency 417 Hz are effectively obtained.
On this basement, detail components ISCX4, ISCY7 and ISCZ5 are equally divided into n = 20 segments and DCT is conducted on all segments. The coefficients
Similarly, DCSE of other degradation stages (xF1, xF2, xF3 and xF5) are obtained in the same way. The achieved feature vectors are regarded as one group of results. Other nine groups of samples are also taken from F1 to F5 to achieve corresponding DCSE in the same way. Finally, there are 10 groups of DCSE results, which are shown in Figure 12.
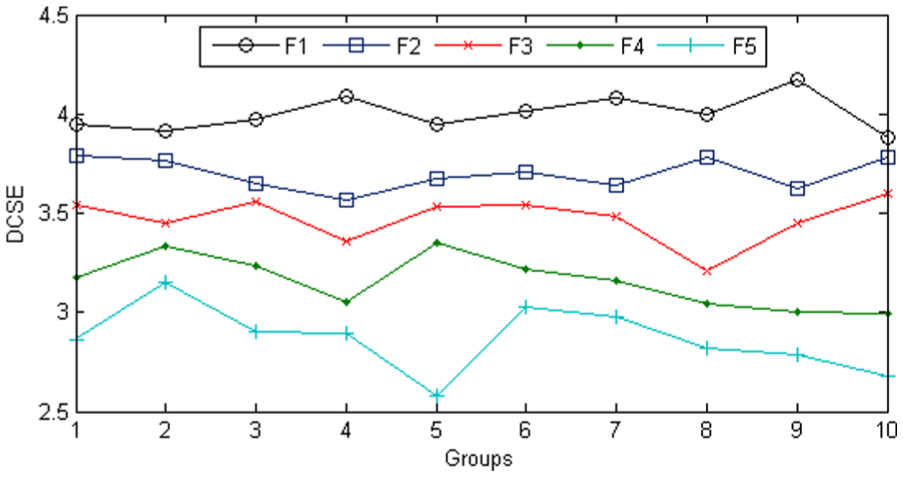
DCSE of various degradation stages.
Figure 12 shows that DCSE of F5 is much lower than those of F1. From the overall trend, DCSE tends to reduce along with the aggravation of degradation, which means the pump tends to be certain failure mode (loose slipper in this experiment). This changing reveals the tracking ability of DCSE to the degradation. The details show that some fluctuations exist in each curve of F1–F5. However, neighboring curves are not crossed and overlapped, which reveals the distinguishing ability of DCSE to various degradation states. In other words, it shows the high sensitivity of DCSE. The above performances of DCSE indicate that, because of obtaining of detail components, most disturbances are reduced and sensitive feature information are effectively extracted. Furthermore, since the proposed DCS fusion algorithm has settled the information losing problem in earlier CS, the sensitivity of DCSE is effectively improved.
To qualitatively evaluate the extracted feature, the earlier CS entropy (CSE) and the LCD–earlier CS entropy (LCSE) of the same 10 groups of samples of F1–F5 are also calculated. Results are shown in Figures 13 and 14.
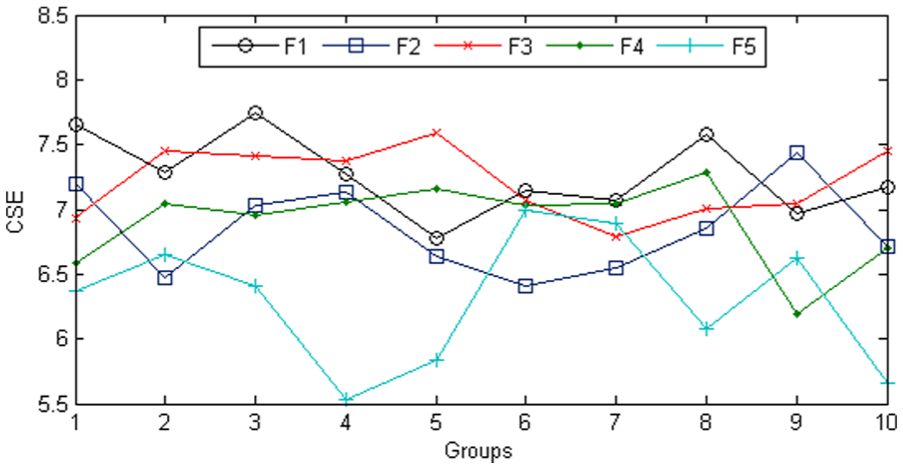
CSE of various degradation stages.
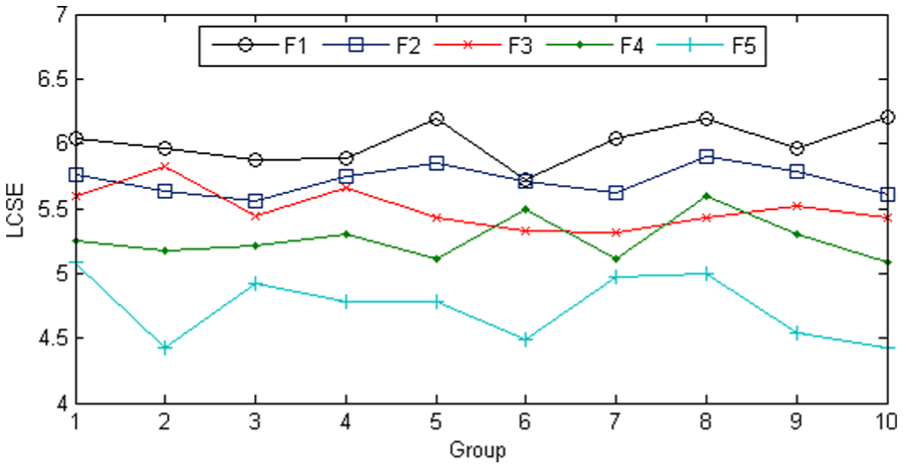
LCSE of various degradation stages.
Figures 13 and 14, respectively, show the performances of CSE and LCSE. Generally speaking, CSE and LCSE of F1–F5 are higher than DCSE. Specific analysis is indicated as follows: In Figure 13, trends of CSE along with the aggravation of degradation are hardly to be found. Meanwhile, fluctuations of each curve are obvious, which means that the stability of CSE is not very well. Additionally, curves between various degradation states cross over each other, especially between F2 and F3, F3 and F4. The reason can be explained that original signals are directly fused by CS leading to the introduction of most noises and disturbance information. Meanwhile, some sensitive information is lost because of the CS inherent disadvantages. Therefore, CSE shows poor performances for degradation evaluation. Compared with CSE, performances of LCSE in Figure 14 have been improved. Fluctuations of each curve are decreased and the crossover between curves is declined. The reason is that on the basement of the obtained detail components, disturbances are reduced. The feature performance after CS fusion is better improved. However, curves of F2, F3 and F4 still cross over each other. This is caused by the information losing in earlier CS, which influences the feature sensitivity.
Based on the above qualitative analysis, the double sample Z test (DSZT) is introduced to make quantitative evaluation on the feature sensitivity. The higher the Z value is, the better distinguishing ability of various degradation states the feature will possess and the more sensitive it will be. The computation is explained by equation (16) 26
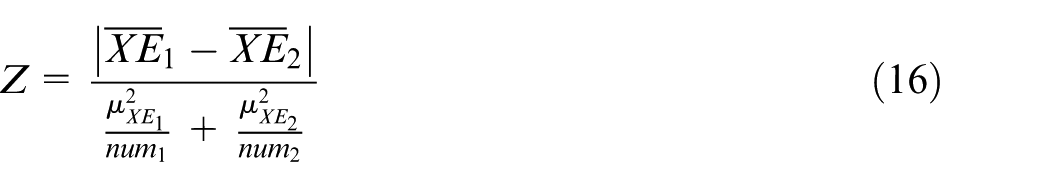
where XE1 and XE2 denote the sample sets of the degradation feature XE in various degradation stages.
Sensitivity of various features to the degradation of loose slipper.
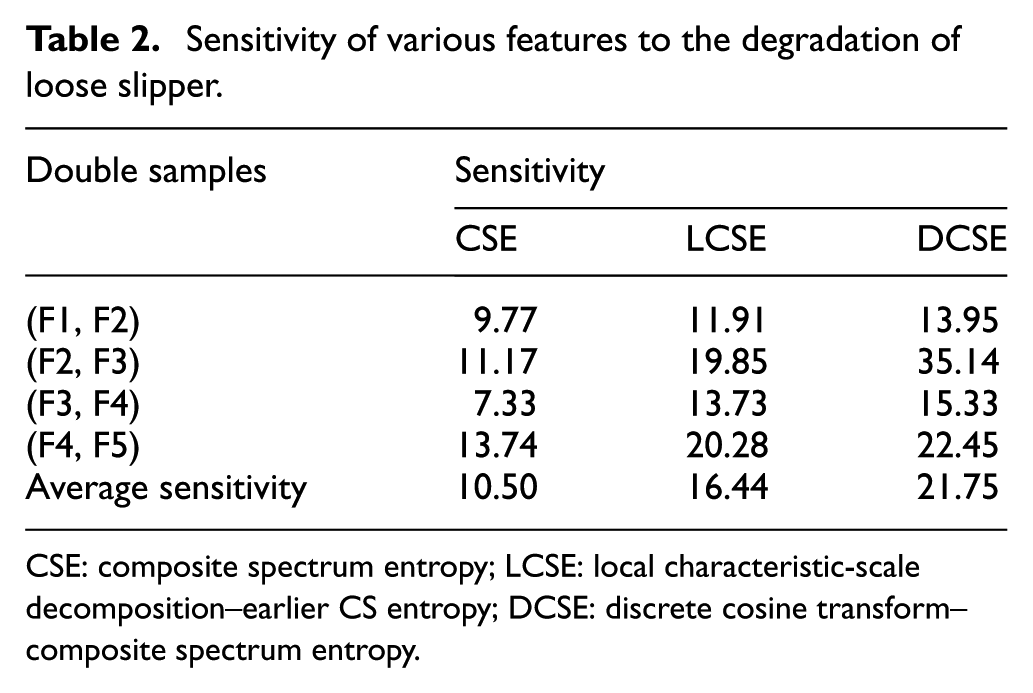
CSE: composite spectrum entropy; LCSE: local characteristic-scale decomposition–earlier CS entropy; DCSE: discrete cosine transform–composite spectrum entropy.
In Table 2, the sensitivity of CSE is the lowest which is caused by the influences of disturbances. Its distinguishing ability of various degradation stages is also limited. Compared with CSE, the sensitivity of LCSE is higher, since the unnecessary components are mostly reduced. However, influenced by CS inherent disadvantages, the sensitivity of LCSE is not desirable. For DCSE proposed in this article, the sensitivity to various degradation stages is much higher than CSE and LCSE. Furthermore, the average sensitivity 21.75 is also the highest. It means that the performance of DCSE is much better than CSE and LCSE, which is accorded with the qualitative analysis before.
Consequently, based on the experimental results, the proposed LCD-DCS method is effective in degradation feature extraction. Disturbances are mostly reduced and the sensitive information is effectively obtained. Therefore, the extracted DCSE shows better performances for degradation measurement.
Conclusion
A novel method for degradation feature extraction based upon LCD-DCS is proposed in this article, which is verified by the application analysis in the hydraulic pump degradation experiment. Conclusions can be drawn as follows:
The method for obtaining detail components is presented based on the LCD processing and the ISCs selection. Noises and disturbances are mostly reduced and the sensitive information is effectively obtained.
The DCS fusion algorithm is proposed by the modification on earlier CS to make fusion of the achieved detail components. DCSE is extracted as the feature vector, which shows satisfying performance to the degradation.
Results of the application in the hydraulic pump degradation experiment show that the feature extracted by the presented method is effective to reveal degradation information, which is meaningful for the realization of condition-based maintenance.
Footnotes
Acknowledgements
The authors are grateful to the Mechanical Engineering College, China, for providing the experimental situation. The authors would also like to express their sincere appreciation to the anonymous.
Declaration of conflicting interests
The author(s) declared no potential conflicts of interest with respect to the research, authorship and/or publication of this article.
Funding
The author(s) disclosed receipt of the following financial support for the research, authorship, and/or publication of this article: This project is supported by National Natural Science Foundation of China (Grant No. 51275524). The authors appreciate the AVIC Liyuan Hydraulic Corporation for their support to the experiment.