
Abstract
The flow characteristics of slender-column flow in wedge-shaped channel under microgravity condition are investigated in this work. The one-dimensional theoretical model is applied to predict the critical flow rate and surface contour of stable flow. However, the one-dimensional model overestimates the critical flow rate for not considering the extra pressure loss. Then, we develop a three-dimensional simulation method with OpenFOAM, a computational fluid dynamics tool, to simulate various phenomena in wedge channels with different lengths. The numerical results are verified with the capillary channel flow experimental data on the International Space Station. We find that the three-dimensional simulation perfectly predicts the critical flow rates and surface contours under various flow conditions. Meanwhile, the general behaviors in subcritical, critical, and supercritical flow are studied in three-dimensional simulation considering variations of flow rate and open channel length. The numerical techniques for three-dimensional simulation is validated for a wide range of configurations and is hopeful to provide valuable guidance for capillary channel flow experiment and efficient liquid management in space.
Introduction
Open capillary channel is a structure that contains a liquid with one or more gas–liquid interfaces, which plays an important role in a number of applications in liquid management in space science, such as heat pipes and propellant management devices (PMD) in on-orbit refueling tanks of satellites.1,2 Under the condition of microgravity, the gravity is negligible and the flow in the channel is dominated by convection, viscous stress, and surface tension. With the increase in flow rate, the pressure difference across the gas–liquid interface gradually increases, and the free surface has to bend inward to balance it. The subcritical phenomenon is observed when the interface is stable. Once the growth rate of pressure difference exceeds the surface curvature change rate, the surface collapses and gas ingests into the channel. This phenomenon is called choking, and we also call it as supercritical phenomenon, which is undesired for many applications. In critical state, the maximum flow rate is reached before the free surface becomes unstable. Thus, the study of flow rate limitation and behavior of the free surface in capillary channel is critical for efficient tank design and liquid management in certain fields.
Early research on capillary channel flow (CCF) under microgravity conditions began with the liquid flow experiments between parallel plates in drop tower. 3 Jaekle 1 presented the governing equation for theoretical analysis but the errors of analytical solution are too high due to the neglect of curvature along the flow direction. Rosendahl et al.4–6 proposed the steady one-dimensional (1D) momentum equation to investigate forced flow between parallel plates and validated with drop tower and sounding rocket flights. The unsteady flow in parallel plates is studied theoretically, numerically, and experimentally by Grah and colleagues.7–9 Haake et al. 10 expanded 1D theory to groove-shaped channel and verified the numerical solution in the Bremen drop tower.
The wedge-shaped channel (Figure 1) has also been investigated with numerical and experimental methods. The geometry is verified for its good performance in experiment of positioning the liquid 11 in PMD. Klatte et al. 12 developed an iterative procedure with surface evolver (SE) algorithm to calculate the critical flow in wedge channel and validated it with drop tower experiments. Wei et al. 13 also performed theoretical and experimental study of flow characteristics in wedge channel with a constant geometrical configuration. Both studies on wedge channel did not consider the influence on surface behavior caused by flow rate and open channel length. The CCF experiment abroad the International Space Station (ISS 14 ) provides a chance to thoroughly validate the 1D theory and other numerical method. With reference to CCF ISS experiments, this article presents a comprehensive numerical study on flow rate limitation for steady flow in wedge channel considering variation of flow rate and open channel length. The CCF experiment on ISS is briefly introduced first. Then, we apply the 1D theoretical model to slender-column flow in wedge channel. The critical flow rate and the surface contour in stable flow can be calculated using Newton method. But the flow separation in supercritical flow cannot be observed. Furthermore, the three-dimensional (3D) simulation is performed with the computational fluid dynamics (CFD) tool to investigate the surface behaviors in subcritical, critical, and supercritical flows. The numerical results are verified with CCF ISS experiments. The descriptions of all symbols used in this work are provided in the appendix. This work aims to study the flow mechanism in wedge channel and provides valuable advices for liquid management in space.
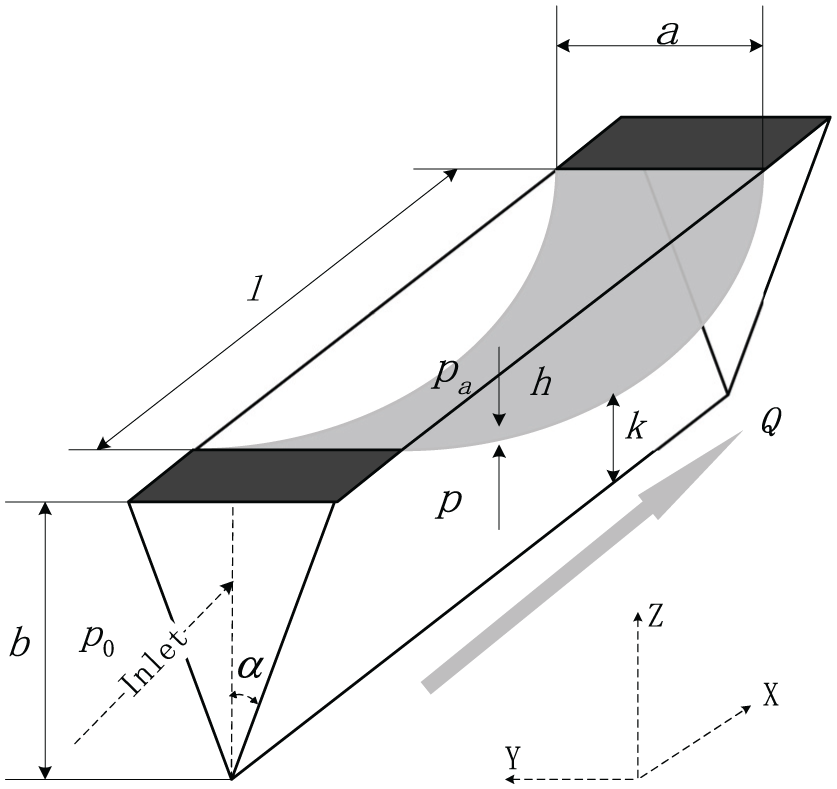
Flow model in a wedge-shaped channel.
CCF experiment on the ISS
The experiments on flow rate limitation in open CCF were extensively performed in drop tower and ballistic rockets.15–17 But none of the previous experiments like CCF experiments on ISS enabled a broad study with different parameters in order to investigate the stability of CCF. The CCF ISS experiment is a robotic experiment and is operated within Microgravity Science Glovebox (MSG). 14 Till now, the experimental data provide significant reference basis for this area.
The fluid loop in CCF experiment is shown roughly in Figure 2. Along the direction of flow, the liquid is driven by a pump (P) which is connected to the channel’s outlet. Through a flow meter (F), liquid is forced into phase separation chamber (PSC). When gas is ingested into the test channel (TC), the porous screen (S) holds the gas back. In the flow preparation chamber (FPC), the liquid obtains an equal velocity distribution and then goes into the TC. The compensation tube (CT) with a radius of 30 mm maintains a constant pressure in the system and also compensates displaced liquid when the free surface collapses. The knowledge of fluid loop is helpful for numerical study using 1D model and 3D simulation in the following.
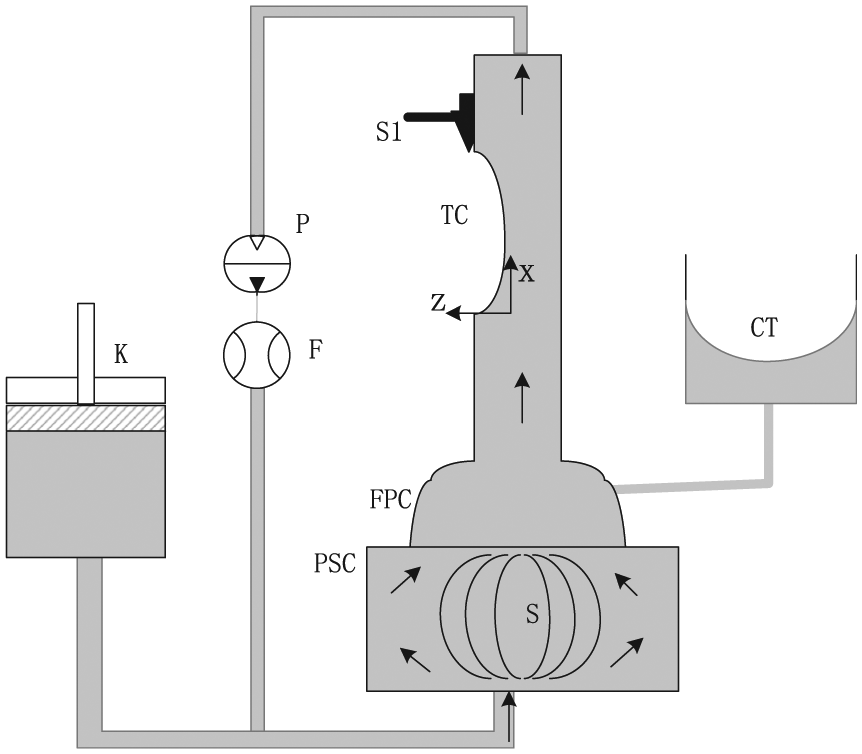
Fluid loop in the CCF experiment on the ISS. Wedge geometry in test channel is considered. The open channel length can be adjusted with movable slider at the outlet.
In this article, we only consider a wedge-shaped channel as shown in Figure 1. The channel has a height b, a width a, and an opening angle
Channel dimensions and physical attributes of the fluid HFE-7500(in 30°C).

1D theoretical model
The 1D theoretical model could provide approximate flow characteristics for steady capillary flow with little cost. This model has been widely studied as reference for CCF experiments. With an analogy of 1D theoretical model on parallel plates, 5 this work applied the 1D model to the slender-column flow in wedge-shaped channel. In the 1D model, the flow characteristics are obtained through fast numerical calculations, such as the value of critical flow rate and the free surface contour along the channel in stable flow. The 1D model assumptions, governing equations, and boundary conditions are presented in this section.
Governing equations
As shown in Figure 1, the wedge-shaped CCF is driven by a pump in the x-direction. The flow is assumed to be steady, incompressible, and isothermal. Assuming that the velocity along y- and z-directions is negligible, the 1D form of the momentum equation reads as follows

where

Free liquid surface in the channel is exposed to ambient pressure
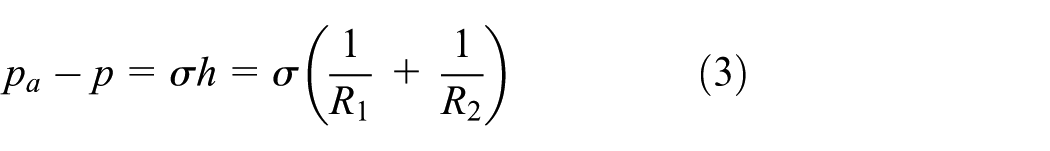
where


Cross sections of wedge channel and the radii of curvature
In equation (1),

where the calculation of R is related to the value of the surface height k, which is given by

where
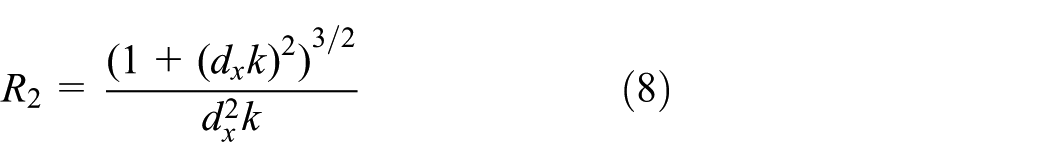
For the radius of curvature

The radius of curvature
For the viscous pressure loss in the channel, the first derivative form reads as follows

where

where
Boundary condition of inlet pressure
The inlet pressure

The pressure loss along the triangle-closed channel could be approximately calculated. The details are presented by McComas 19

where

where
Scaled details, dimensionless parameters and pressure loss constants are used to solve the 1D model.

1D: one-dimensional.
Detailed descriptions of all symbols in this work are provided in the appendix.
Numerical techniques for 3D simulation
The 1D theoretical model discussed above is a fast approximate method to calculate the surface contour of capillary flow. However, it has a limitation that the 3D effect of flow velocity is neglected and the supercritical flow cannot be obtained. Thus, a 3D computational tool is necessary to study the 3D influence of wedge-shaped capillary flow. In this work, 3D simulation is performed with OpenFOAM. The surface behaviors under different flow rate and open channel length are investigated through numerical simulation.
OpenFOAM is an open-source CFD toolbox 20 and is widely used to solve complex fluid flows.21–23 The solver interFoam is used to compute the two-phase flow in the capillary channel. The finite volume program uses a technique called the volume of fluid (VOF) method to model the interaction between the fluid and the air.
The motion of an incompressible, isothermal flow is governed by the continuity equation

where v is the velocity, and the momentum balance equation is as follows

where

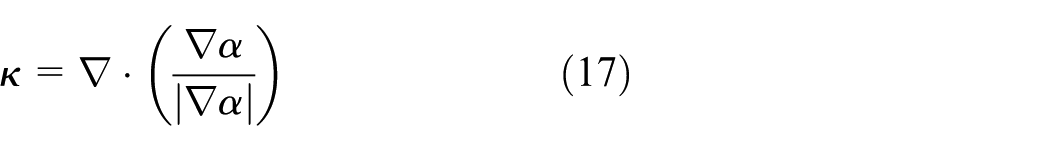
where
The governing equations are discretized using the finite volume method. Lots of discretization schemes with different accuracy are provided by OpenFOAM toolbox, and those terms applied for the simulation of two-phase flow are listed in Table 3.
Summary of discretization schemes.

A typical structured mesh used for wedge-shaped flow in 3D simulation is shown in Figure 4. The channel section is located on right side. The block above the interface is built to provide a constant ambient pressure

A typical structured mesh used for wedge-shaped flow in 3D simulation.
A mesh convergence analysis is performed in this work. We choose three typical meshes with different densities as listed in Table 4, where
Properties of meshes with different densities.
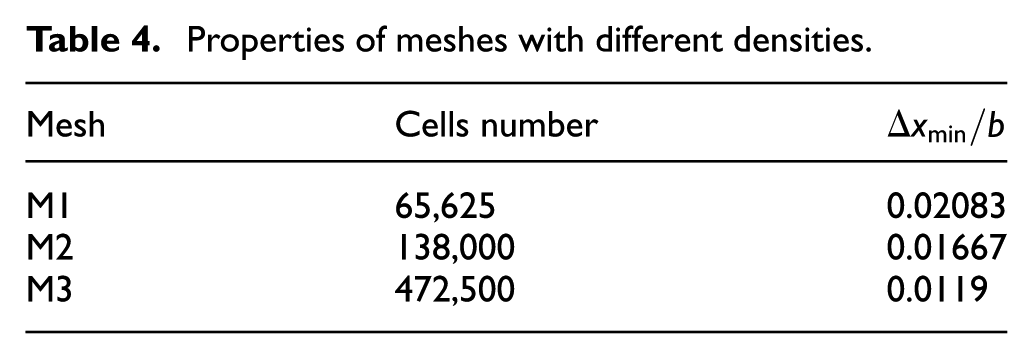
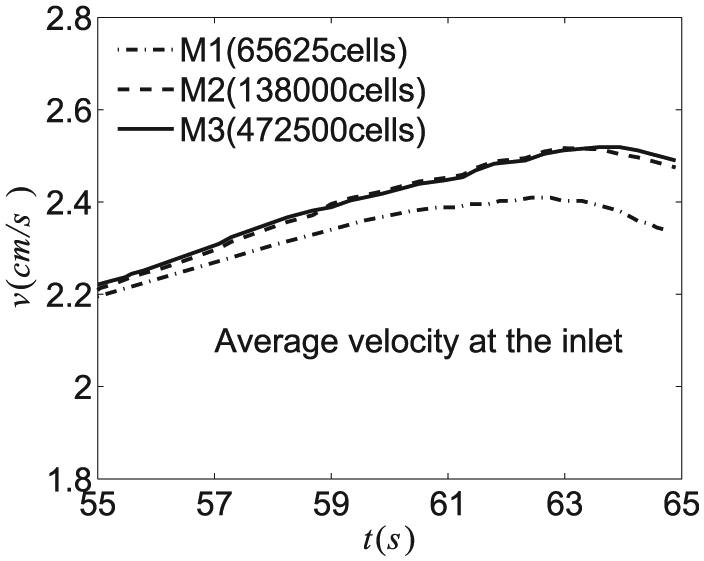
Mesh convergence study of the 3D simulation. Results show that the simulation converges after 138,000 cells.
The critical flow rate
The average velocity of cross section at the outlet is chosen to be probe, because it is sensitive to the behavior of the free surface. When the flow rate is small, the free surface is stable and the value of the velocity grows linearly with flow rate increased. Once the critical flow rate is exceeded, the free surface collapses and the average velocity decreases immediately. Critical flow can be determined when the sudden decrease in the average velocity occurs. Assuming that the average velocity changes at the value
The 3D simulation is applied in different capillary channels with a wide range of parameters and its validity will be discussed in the following. The 3D simulation turns out to be helpful to understand the steady flow mechanism in the process of experimental operation.
Numerical results and discussions
In order to verify the effectiveness of the 1D model and the 3D simulation for stability of CCF in wedge-shaped channel under microgravity condition, both the numerical results are compared with the CCF experimental data on ISS. 14 The comparative analysis is presented with variation of flow rate and open channel length. Flow free surface evolution process under various flow conditions is also studied in 3D simulation.
Critical flow rate
In the CCF experiments, an essential purpose is to determine the maximum flow rate before the free surfaces of the liquid becoming unstable. The critical flow rate is also a significant index to verify the numerical model. The numerical results tested in 1D model and 3D simulation are validated with ISS experiments in the following.
In the 3D simulation, the critical flow rate is determined by the incremental approach. Figure 6 shows the average velocity

Variation of the average velocity at the outlet in the process of the flow rate acceleration. The value corresponding to the turning point is regarded as critical flow rate. As the channel with l = 25 mm, the critical flow rate obtained in 3D simulation is 3.1 ml/s.
It is worth mentioning that we found the change rate of free surface is related to the acceleration time period
The predictions of critical flow rate calculated in 1D model and 3D simulation are verified with results in CCF ISS experiments. As shown in Figure 7, a clear boundary between the stable (subcritical) and unstable (supercritical) regime is observed. With increasing open channel length, the critical flow rate seems to decrease hyperbolic for channels with l < 15 mm and the decline appears to be linear for longer channel l > 15 mm. For channels with short length, the viscous pressure loss is small and the flow is dominated by the convective pressure, which results in higher values of critical flow rate. The comparisons in Figure 7 show that for channels with short free surface length (l ≤ 10 mm), the discrepancies between the numerical results (1D model and 3D simulation) and experimental data are obvious. The relative difference between 1D model and experimental data is up to 20% while the relative difference between 3D simulation and experimental data is less than 10%. In contrast, both the relative differences decrease with the increase in the free surface length and are less than 5% for long channel (l ≥ 20 mm). The predictions of critical flow rate in 3D simulation are found to agree well with the experimental data in the entire measurement range. The analysis and comparisons show that the mechanism of steady flow is well understood and the 3D simulation could provide a good and low-costing prediction for CCF experiments.

Critical flow rate versus open channel length for experimental data and numerical predictions (1D model and 3D simulation) for slender-column wedge-shaped channel.
Critical free surface contours
The 1D model and 3D numerical technique can also be used to calculate the free surface contour for flow rate
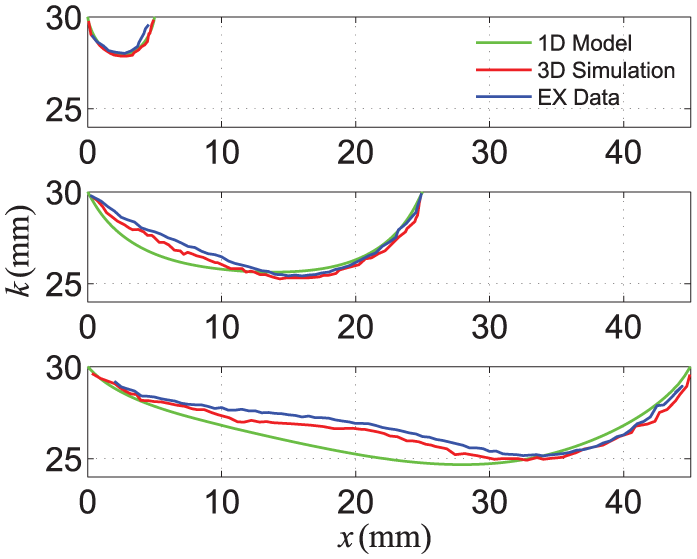
Three representative free surface contours height k along x-direction in critical state for experimental data and numerical predictions (1D model and 3D simulation). They are obtained in channels with l = 5 (top), l = 25 (middle), and l = 45 (bottom), respectively.
As shown in Figure 8, for short channels, the contour of surface is almost symmetrical with respect to center of channel and the numerical results of 1D model and 3D simulation are almost the same as the experiment. With the increase in open channel length, the surface contour becomes asymmetrical gradually, and deviation between 1D theory and CCF experiments occurs. The lowest point of free surface
For further analysis on the surface contour deviations between the numerical results and experiments, note that
Relative differences of the lowest point between 1D model, 3D simulation, and ISS experiments with different open channel lengths.

1D: one-dimensional; 3D: two-dimensional.
As discussed above, the 1D theory generally predicts the critical flow rate and the contours of critical free surface profiles for wedge-shaped channels. However, it overestimates critical flow rate for short channels l ≤ 10 mm, and the numerical contours of free surface differ from the results of experiment typically in long channels. These deviations expose disadvantages of 1D model. During the experiments on ISS, the velocity on the wall is accelerated with flow transforming from the closed duct to the open channel, the process will result in extra pressure loss. Moreover, the separation of the free surface causes an increase in the pressure loss. Both extra pressure losses are not involved in the governing equations of 1D model. This could explain the overestimation of critical flow rate for short channel and differences in the shape of liquid level. Meanwhile, those influences are considered in 3D simulation, and the numerical results are in good agreement with the experimental data. It is concluded that the 1D theory can be effective for fully developed flow and the 3D simulation could provide a good approximation for open CCF.
Free surface evolution process in 3D simulation
Based on the validity of numerical techniques for 3D simulation discussed above, free surface behaviors under various flow conditions are studied in the 3D simulation. Figure 9 shows the representative free surface evolutions in subcritical, critical, and supercritical flow, respectively, in channel with l = 25 mm. The free surface evolution is captured in time period of 10 s after the flow rate was exceeded. It is obvious that the surface behaviors vary with the flow rate under the same open channel length. As introduced above, the lowest point of free surface
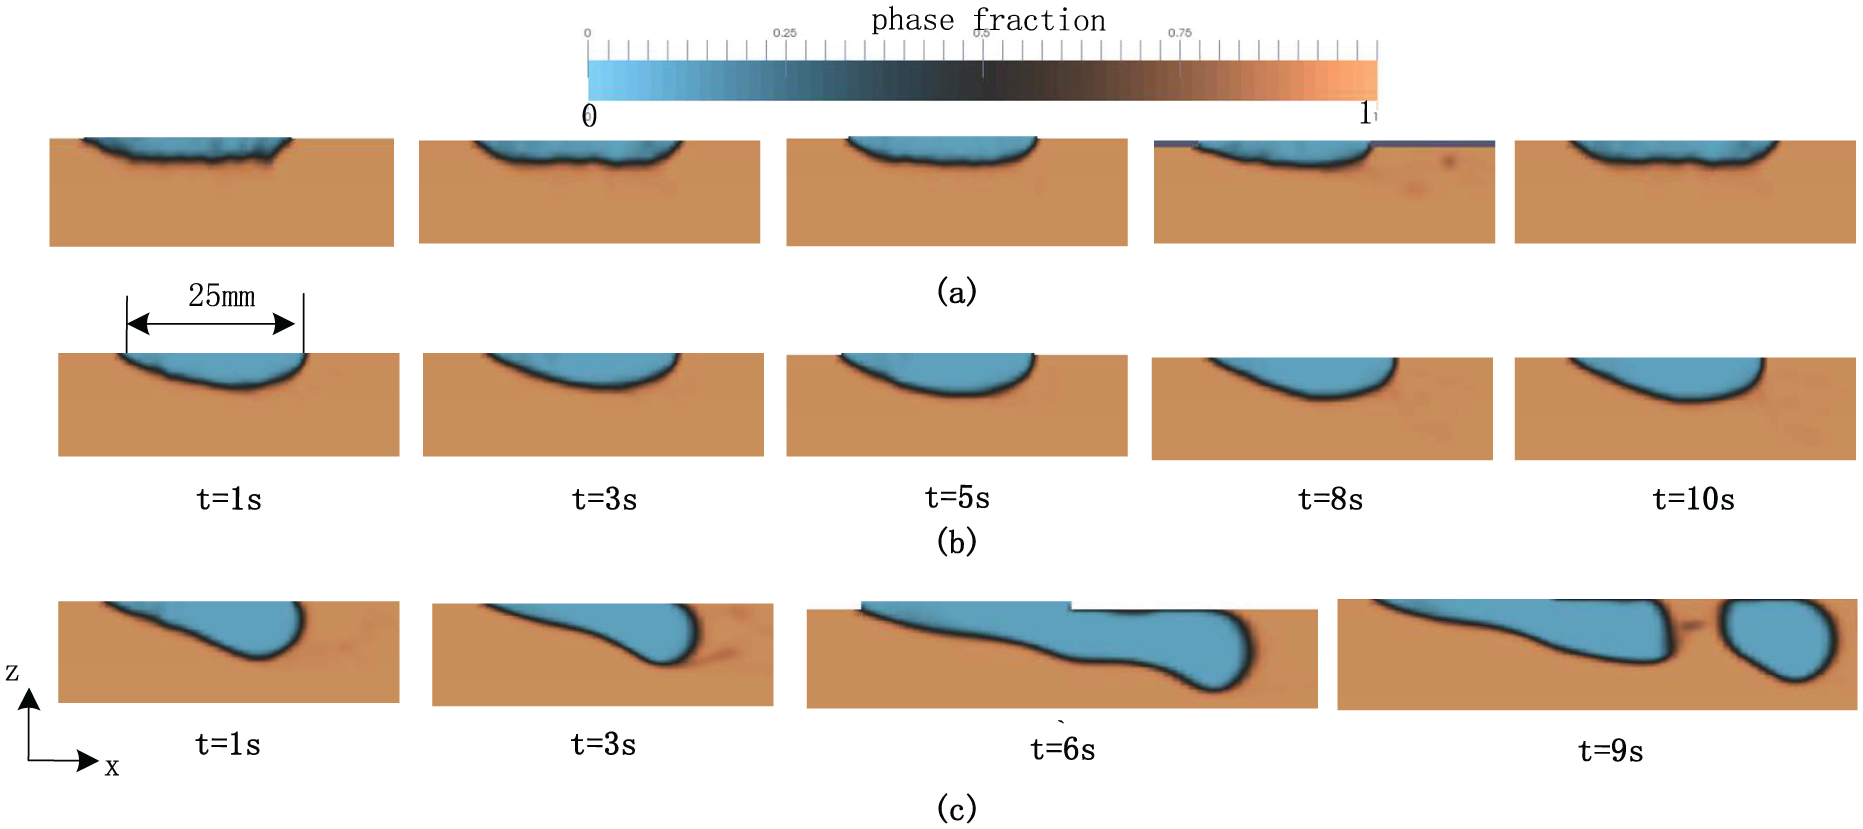
Free surface development processes of subcritical, critical, and supercritical flow in 3D simulation. These phenomena are observed at flow rate of Q = 2 ml/s, Q = 3.1 ml/s, and Q = 4 ml/s, respectively. In this case, the length of interface l = 25 mm: (a) subcritical flow, Q = 2 ml/s; (b) critical flow, Q = 3.1 ml/s; and (c) supercritical flow, Q = 4 ml/s.

Position of the spatial coordinates of the lowest point
In the capillary channel with length l = 25 mm, the subcritical flow is found at the flow rate of 2 ml/s. Evolution of the free surface during the simulation is shown in Figure 9(a). The liquid–gas interface can be observed with the description of phase fraction and is drawn in black color. In the stable case, the surface stops moving inward and keeps a certain curvature. Figure 10(a) shows the change of position of
In the test with
When the critical flow rate is exceeded, the free surface collapses and supercritical flow is observed. The process of bubbles involvement at flow rate
Conclusion
The mechanism of open CCF has been a hot topic and is widely investigated experimentally and numerically. The CCF experiments on ISS developed a broad study on the stability of open channel flow under microgravity conditions with a large range of parameters. For slender-column flow in wedge-shaped channel, the 1D theoretical model with combination of the Young–Laplace equation and the momentum equation is presented to study the flow behavior in this work. Only the velocity in x-direction along the channel is considered in 1D model. We calculate the critical flow rate and the height of fluid level using Newton method. The numerical results are compared with experimental data which shows that the 1D model generally predicts the shape of flow rate and the value of critical flow rate. Nevertheless, the neglect of extra pressure loss in 1D model results in not only higher predictions of the critical flow rate for short channels but also more stable free surface contour in subcritical flow.
Since the limitation that the supercritical flow cannot be obtained through 1D model, the CFD tool is employed for further investigation of general behavior of gas–liquid interfaces in open capillary channels in this work. It helps to understand surface behaviors at different flow rates. Critical flow can be determined when sudden decrease in velocity at the outlet occurs with the step-increasing flow rate. The simulated results have been validated by comparison with experimental data on ISS. Meanwhile, the predicted contours of free surface are in good agreement with experiments in investigated channels with various lengths. Furthermore, surface behaviors under various flow conditions are perfectly reproduced in 3D simulation, The flow mechanisms in subcritical, critical and supercritical flow are studied in detail respectively. The numerical techniques for 3D simulation can be employed to evaluate the general behavior of the gas–liquid interface which is beyond the physical constraints of the CCF experiment.
Footnotes
Appendix 1
Academic Editor: Ishak Hashim
Declaration of conflicting interests
The author(s) declared no potential conflicts of interest with respect to the research, authorship, and/or publication of this article.
Funding
The author(s) disclosed receipt of the following financial support for the research, authorship, and/or publication of this article: This work was supported by the National Natural Science Foundation of China (Grant Nos 61303071 and 61120106005) and Open fund from State Key Laboratory of High Performance Computing (Nos 201303-01, 201503-01, and 201503-02).