
Abstract
In this work, we propose a principal component analysis and system identification–based failure assessment approach for evaluating the partial actuator debonding failures in smart composite structures. Actuator debonding failure changes the structural dynamic characteristics and reduces the actuation capabilities as well in smart composite structures. First, the modeling of actuator debonding in smart composite laminate is developed using the finite element method, which incorporates the improved layerwise theory and higher-order electric potential field for the electromechanical coupling. Second, the structural responses obtained from the developed modeling are fed into the system identification to identify the system parameters of both healthy and damaged systems. Third, the achieved system parameters are further used for the statistical analysis by principal component analysis to extract the failure-sensitive features. Finally, a numerical example is studied using a 16-layer cross-ply laminate ([0/90]4s) as the substrate with various actuator debonding sizes. The results show that the actuator debonding failures can be well assessed, and the failure intensity and location can also be evaluated using the proposed approach.
Keywords
Introduction
Composite laminated structures with surface-bonded or embedded active piezoelectric layers or distributed piezoelectric actuators and sensors are considered as smart composite structures,1,2 which are capable of self-actuating and self-sensing in response to an external change. The application of smart composite structures to aerospace systems, vehicles, and other industries is expanding rapidly due to their high mechanical properties, light weight, as well as the smart nature of piezoelectric materials. Nevertheless, the failures, such as interfacial delamination, crack, and actuator/sensor debonding, in smart composite laminates severely affect their service life. Such failures can be caused by imperfect bonding during the manufacturing process or induced by external forces.
Until now, numerous mathematical approaches have been developed3,4 for the modeling of smart composite laminates in presence of delamination or debonding failures. The failure effect on system responses has been inspected from both the static and dynamic aspects. Sun et al. 5 investigated the actuator and sensor debonding effect on active control of beam structures. They studied the debonding effect on both the collocated and non-collocated control schemes. Kumar et al. 6 also investigated the active vibration control with partially debonded actuator for plate structures, and they found that the debonding influenced both the active damping and active stiffening effects. Kim and colleagues7,8 developed the improved layerwise theory using the Heaviside unit step function to address the discontinuity of displacement field for delamination analysis. Raja et al. 9 developed the theoretical model for composite beams and plates with delamination or debonding using a sublaminate technique for the delaminated region. They imposed the strain-based multipoint constraints to satisfy the continuity condition of displacement across the delaminated edge. Jin et al. 10 investigated the dynamic behaviors of surface-bonded piezoelectric actuators taking into consideration of debonded adhesive layers. The interfacial debonding effects on the dynamic response of layered structure and the interlaminar strain and stress transfer mechanism were studied. The debonding issues on dynamic characteristics and vibration suppression were investigated experimentally by Seeley and Chattopadhyay. 11 They observed the significant changes of open-loop and closed-loop frequencies and damping ratios due to the debonding failure.
From these literatures, it has been found that the actuator debonding failure influences the system characteristics and reduces the actuation capabilities. Moreover, the stability of closed-loop system may also be affected due to the actuator debonding failure. Based on these descriptions, detection of the actuator debonding failure and evaluation of the failure severity are of vital importance in smart structures. The authors previously developed a damage classification approach 12 for delamination failures in smart composite structures based on the principal component analysis (PCA) 13 and system identification. The locations and the severity of delamination failures were evaluated successfully. In this work, the PCA combined with system identification method is applied to assess the partial actuator debonding failure in smart composite structures. PCA is a powerful data reduction method and it has been applied in the vibration-based structural health monitoring14,15 since recent decades. However, in the previous studies, PCA is normally used for data compression, and damage is further recognized by other intelligent methods. For example, in the principal component analysis–artificial neural network (PCA-ANN) method,16,17 the frequency response functions are compressed by PCA, and the damage is further recognized by ANN. Recently, PCA was explored to cluster the structural responses in civil engineering18,19 to recognize the structural damages. The damage clustering and classification using PCA was applied to composite structures by Johnson 20 to detect matrix cracks and delaminations based on the recorded acoustic emission transients. Sophian et al. 21 used PCA for feature extraction in the responses obtained from the pulsed Eddy current (PEC) and proved its efficiency in classifying the defects.
In the proposed failure assessment approach, the system parameters achieved from the system identification are employed to construct the input of PCA for the failure feature analysis, instead of using the direct time-domain system response data. The system identification 22 is an inverse algorithm in identifying a physical system in representation of state-space form by a set of input–output data. Until now, numerous system identification approaches have been developed and applied to the damage detections in various engineering fields. Phan and colleagues23,24 developed the time-domain eigensystem realization algorithm (ERA) using the input and structural output to determine a minimal order state-space representation of the system. However, the presence of measurement noise affects the identification accuracy. Fraraccio et al. 25 used the ERA for damage detection in frame structures and found the loss of structural stiffness. Xing et al. 26 adopted the frequency domain decomposition (FDD) and stochastic subspace identification (SSI) methods to extract the modal characteristics from the measurements for delamination detection. Damage detection by system identification techniques has also been applied to composite structures. Ali and Shankar 27 adopted the ERA for damage detection in laminated composite beams and successfully evaluated the damage by the loss of structural stiffness.
Therefore, in this work, we present a PCA and system identification–based failure assessment approach for evaluating the partial actuator debonding failure in smart composite structures. First, the smart composite laminate with partial actuator debonding failure is modeled using an improved layerwise theory and higher-order electrical potential field. In the modeling, the electromechanical coupling effect is fully taken into consideration. The finite element method (FEM) is adopted to obtain the governing equation using four-node plate element. To assess the failure categories, the random responses excited by piezoelectric voltage input are obtained from the developed modeling for various debonding cases. The random response data and the residual signals defined by the difference between the healthy case and the damaged case are fed into the system identification to achieve the system parameters. The achieved system parameters are used to construct the input matrix of PCA for the failure feature analysis. Finally, numerical example using a 16-layer cross-ply laminate ([0/90]4s) as the substrate is studied for the failure assessment. The results will show that the proposed failure assessment approach can successfully assess the failure categories and evaluate the failure intensity, but fail to evaluate the failure locations when using the direct output signals. However, when using the residual signals, it can successfully evaluate the failure locations.
Mathematical modeling
Figure 1(a) shows the geometric configuration of smart composite laminate with one piezoelectric actuator and one sensor bonded on the top surface. The dimension sizes of structure are given in the figure. The piezoelectric actuator is assumed to be partially debonded at the right edge, with various debonding sizes, 10%, 20%, 30%, 40%, and 50% of total area, shown in Figure 1(b). The piezoelectric actuator and sensor are attached close to the clamped root to achieve good actuation and sensing performance. The material properties of piezoelectric materials and the substrate, composite laminate, are given in Table 1. The actuator and sensor possess the same electric and mechanical properties in this work.

(a) Geometric configuration of smart composite laminate with actuator edge debonding failure and (b) debonding sizes and location of piezoelectric actuator.
Material properties of composite laminate and piezoelectric material.

Since the system is involved with piezoelectric elements, a coupled electromechanical formulation should be derived containing the electric and mechanical energy transfer. Thus, for a system with piezoelectric material, the linear constitutive relation of piezoelectric material is considered as follows

where
A higher-order electric potential field is adopted to describe the potential variation through the thickness, as shown in equation (2). Such assumption of potential field is able to satisfy the boundary conditions of applied voltages and charge conversation law4,28

where
The kinematics of smart composite laminate with debonding-like failure of piezoelectric actuator is modeled using the improved layerwise displacement field with the Heaviside unit step function, 29 as shown in equation (3)

where
The kinematic relation for elastic strain is further obtained by means of the strain–displacement relation. It should be noted that the normal strain

For the given geometry of smart composite laminate with piezoelectric patches, the general finite element approach can be adopted to derive the governing equation. A four-node plate element is used for FEM with 60 × 10 elements in length and width, as shown in Figure 2. The linear Lagrange interpolation function is used to interpolate the in-plane structural unknowns

where

Rectangular plate element with DOFs: nodes 1 and 2, healthy nodes; nodes 3 and 4, debonded nodes.
The extended Hamilton principle can be adopted to derive the equations of motion in the absence of body force as shown below
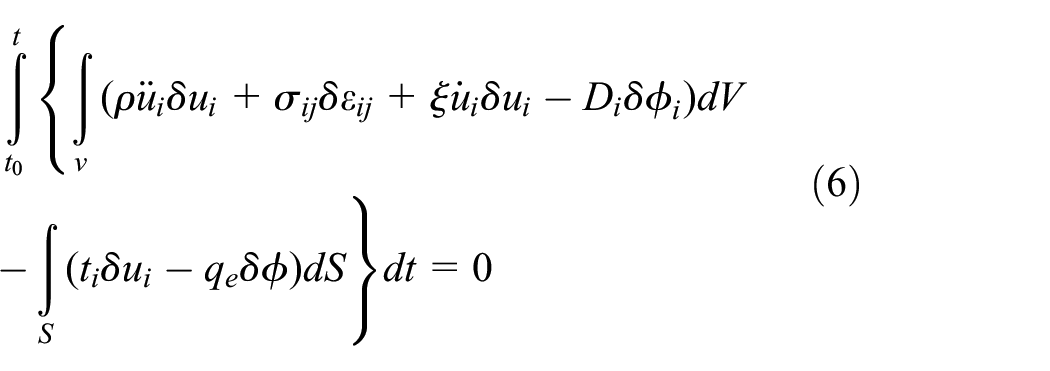
where the quantities
The governing equation can be obtained from equation (6) with the help of three-dimensional (3D) stress–strain constitutive relation and kinematic conditions as follows
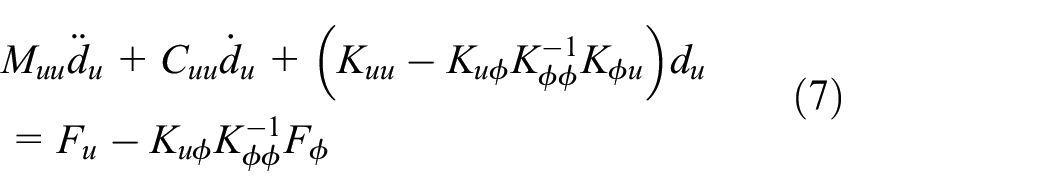
where
For the time response, the FEM-based governing equation can be solved using the numerical integration method, such as Newmark’s algorithm for linear vibration, 30 in which the structural output, its first and second derivatives can be approximated by Taylor’s expansions which term up to the second derivative. Newmark’s algorithm is widely used in the finite element analysis of structures for dynamic response. Only with the initial conditions of displacement, velocity, acceleration, and force input at each time step, the governing equation can be solved through the iterative process. Thus, this work adopts Newmark’s algorithm for calculating the time response of smart composite laminate with actuator debonding failure. The time response data will be further used for the failure assessment.
Failure assessment approach
In order to assess the debonding-like failure of piezoelectric actuator in smart composite laminates, a 16-layer cross-ply substrate laminate ([0/90]4s) is used for the numerical study. The debonding of actuator causes the reduction of actuation ability and consequently alleviates the structural response. The actuator debonding affects the dynamic characteristics of system in both frequency and time domains. Although the effect of actuator debonding on system natural frequencies is very subtle, we still provide the comparison of first four bending natural frequencies for various debonding cases. Table 2 shows the frequency ratios
Frequency ratios of first four bending modes, normalized by each mode of healthy case

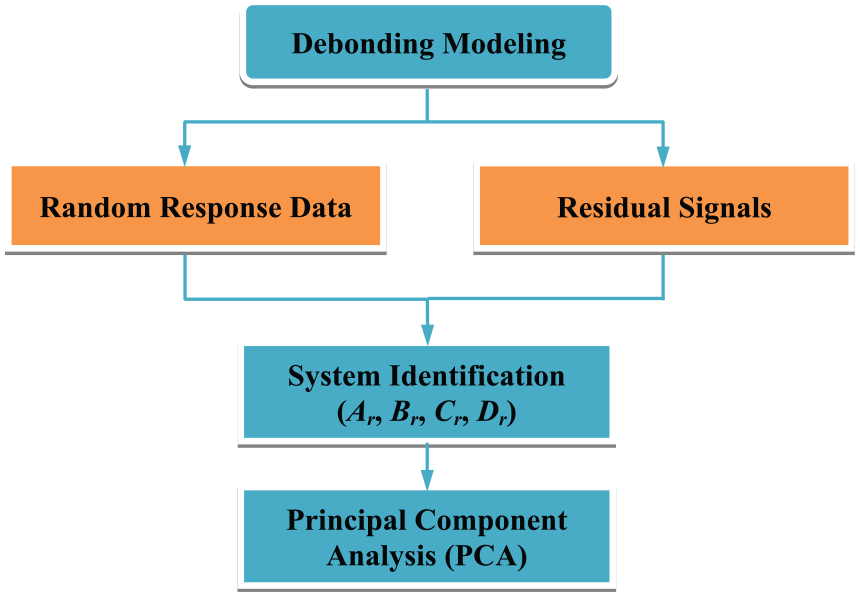
To investigate the debonding effect in the time domain, the random responses of sensor output are calculated, as shown in Figure 3. It should be noted that there is no distinguished failure information directly from the sensor output. Thus, further analyzing the time signal by calculating the power spectral density (PSD), as shown in Figure 4, it is able to probe the underlying frequency information of the time signal. The PSD curves show that although there are some differences of the natural frequencies and the magnitudes when debonding size increases, the divergences are not significant and still hard to be assessed. Therefore, further damage recognition has to be conducted. In the following sections, we propose a failure assessment approach for actuator debonding failures in smart composite structures. As the flow chart is shown in Figure 5, the developed failure assessment approach employs the method of PCA and makes use of the system parameters, identified by the system identification, as the input of PCA. Either of the random response data and the residual signal are used for the system identification. The residual signal is defined by the difference of the sensor outputs between the healthy structure and the damaged structure as shown below

With these ideas, the detail assessment approach will be introduced in the following subsections.

Sensor output under random response for smart composite laminate (a) with and (b) without actuator debonding failure.

PSD of sensor output for smart composite laminate with and without actuator debonding failure.
Flow chart of actuator failure assessment approach.
System identification
The system identification techniques can be used to extract a mathematical model from the measurements of an unknown physical system and identifies the system parameters in the state-space form. The system identification techniques can be applied to a variety of structures, including the laminated composite structures. 27 In this work, the direct system identification method, previously developed by Phan et al. 31 can be adopted, which is easily implemented without calculating any of the system Markov parameters.
Direct system identification method
The state-space model of a linear time-invariant system in discrete-time domain is expressed by equation (9), with nth order, q outputs, and r inputs

The proposed system identification approach can realize the system matrices A, B, C, and D by only the input {u} and output {y} data. First, through the iterative process, the system output at each time step can be calculated by the linear combination of the current state x(k) and p successive output values, as shown in equation (10)

where

and

Equation (10) has the following form by left multiplying
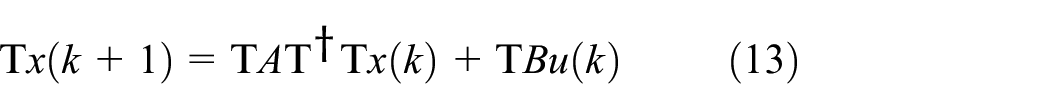
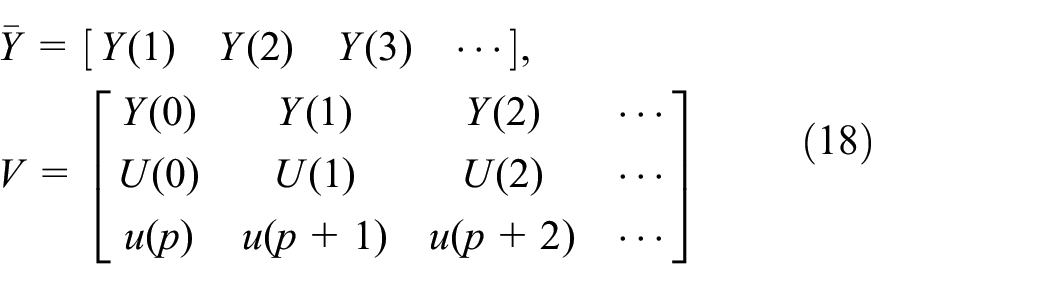
Defining

The output influence matrix Cr is simply defined by q rows, as shown below

Thus, substituting equation (10) into equation (14), the following key equation can be obtained, in which the reconstructed system matrix Ar is separated

In the above key equation, the matrices Ar and W can be solved by a set of linear equations, which are constructed by

where
Once the matrix W is partitioned into p + 1 partitions, the reconstructed input influence matrix Br can be obtained by further algebraic manipulations, as shown below

where the superscript (p) represents the pth partition.
System identification results
The identified system parameters (Ar, Br, Cr) in the state-space form are used to reconstruct the system and compare the system response with the original system response. To verify the efficiency of the system identification method, a healthy laminate with single electric input and single sensor output case is considered. The sensor outputs are shown in Figure 6 for the original and the reconstructed system responses with the state number p = 26 under random piezoelectric excitation. From the graph, it is found that the present direct system identification method successfully reconstructs the system with a small margin of error. It should be noted that the accuracy of the system identification mainly depends on the number of state. Thus, the absolute error e is defined by the difference between the original system output and the identified system output, shown in equation (20) in terms of the state number p


The original sensor output signal and the reconstructed sensor output signal for healthy laminate, p = 26.
The error function is plotted in Figure 7. It is found that when the state number p = 26, the error function shows the smallest value which implies the achievement of the best identification performance. While increasing the state number, the absolute error increases slightly and the accuracy of the identification results cannot be improved.

Absolute error function in terms of the state number p.
Concept of PCA
The PCA is a statistical technique that transforms a set of linearly correlated variables into a set of linearly uncorrelated variables, where it possesses the most of variance of the original data in the principal axes. Normally, when the data is in four-dimensional space or higher-dimensional space, it is invisible. While using PCA, it is feasible to reduce the data dimensionality into two dimensional (2D) or 3D space to visualize the data distribution through the orthogonal transformation. Based on these characteristics, PCA can be used for data dimensionality reduction and feature recognition of data. Thus, in this work, we prefer using the PCA to reduce the data dimensionality in order to assess the actuator debonding failures by means of lower dimensional data. The theory of PCA has been well stated by many existing literature sources.13,18,32 Therefore, the concept and detail calculation of PCA will just be introduced briefly.
The idea of PCA is to transform the original multidimensional data

The covariance matrix Cov of the input matrix can be calculated and further diagonalized by performing the singular value decomposition (SVD), as shown in equation (22)

where
Thus, the transformation from the original data to the principal components can be achieved by

where
In this study, for example, one healthy data group with five debonding failure groups, as shown in Figure 1(b), is considered as the total data groups M. For each group, N sets of the random response are prepared for the system identification. The PCA is now can be applied to extract the failure-sensitive features and assess the failure severity. For the proposed failure assessment approach, the system parameters are chosen as the input of PCA to explore the failure features. Herein, instead of using the eigenvalues of reconstructed system matrix, the normalized values of
Failure assessment results
Based on the failure assessment approach described in the previous section, the detail assessment results will be discussed in this section. To study the failure, it is normally by evaluating the failure severity and investigating the failure locations. In this study, the actuator debonding size is predefined and the severity of debonding will be evaluated by a failure intensity study for various debonding sizes. For the debonding location, it is necessary to examine whether the debonding existed at the actuator interface or inner composite interfaces. Thus, using the proposed failure assessment approach, these issues will be well introduced.
Failure intensity evaluation
As it is shown in Figure 1(b), the failure of actuator is defined by five different debonding percentages, 10%, 20%, 30%, 40%, and 50% of the total area. To evaluate the failure intensity, multi-failure recognition is conducted first. For each group, 10 sets of the random response are prepared and fed into the system identification to construct the input matrix of PCA. The multi-failure assessment results are shown in Figures 8 and 9. Figure 8 is a 2D illustration of the first two principal components, while Figure 9 is a 3D illustration of the first three principal components. From both the graphs, it is obviously observed that the debonding data sets are well separated from the healthy data sets and grouped into each debonding case, which proves that the failure categories can be well recognized using the proposed method. Further analyzing the assessment results, it is found that in the 2D graph, the data group of the 10% debonding case is very close to the healthy data group. Increasing the debonding area, the data group goes far away from the healthy data group. This is physically reasonable since increasing the debonding area makes the system more differentiable from the healthy system and this will be reflected in the distances between the data groups. Table 3 shows the variances of three principal components for each group and the distances between the healthy data group and the damaged data group. Herein, the distance which is used to evaluate the failure intensity is calculated by the mean position between the undamaged group and the damaged group. For the variance, it is found that the variance of the first component is much smaller than other two components, which implies that the data concentration in the first principal component axis is much better than other two axes. Such conclusions can be also found in the assessment figures. The distances of mean positions, shown in Table 3, increase with the increase of debonding area in both 2D and 3D results. This is due to the fact that the larger the distance is, the more severe the damage is. Thus, in a word, the failure assessment approach can successfully evaluate the failure intensity by the distance results.

Assessment result for multi-failure recognition using 2D component plot, p = 100.

Assessment result for multi-failure recognition using 3D component plot, p = 100.
Variances of first three principal components and the distance between the mean positions for multi-failure recognition.

PC1: principal component 1; PC2: principal component 2; PC3: principal component 3; 2D: two dimensional; 3D: three dimensional.
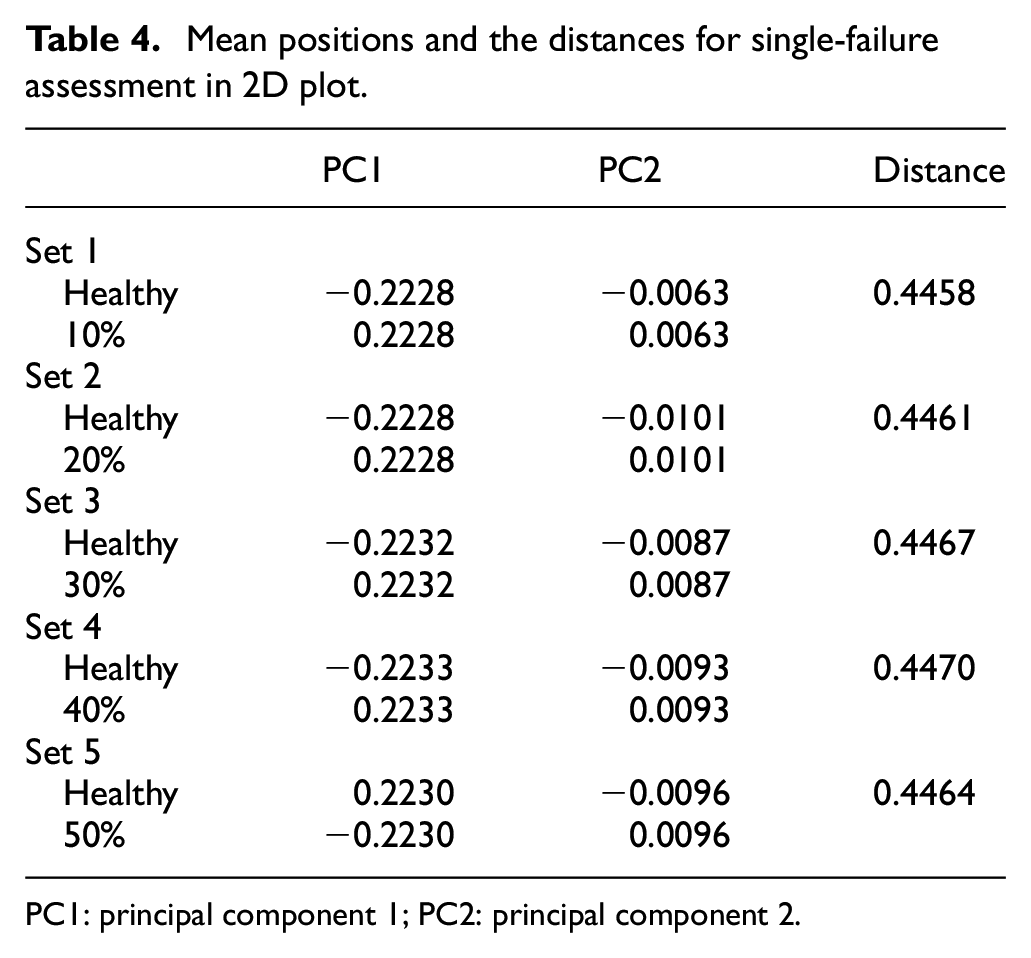
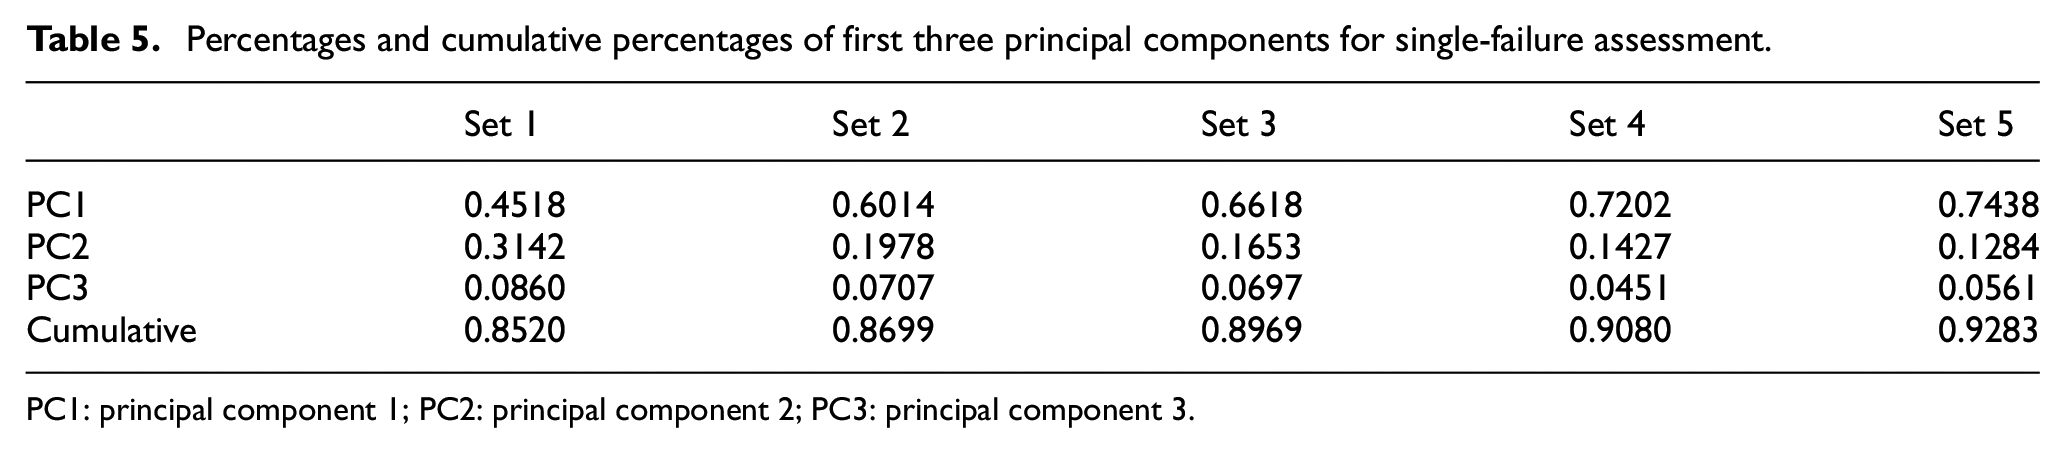
The single-failure assessment results are shown in Figure 10 for recognizing each debonding case from the healthy case. It is found that although there are several points separated from their groups, the healthy data and the debonding data are well grouped into each case. The reason of point separation from their groups is that during the system identification, the same number of the state has to be used to construct the input matrix with same dimension for PCA. This defect could lead to the inefficiency of some system identification results. However, it does not affect the group recognition when using ten measurements, even though there are one or two isolated points. Thus, these results show the feasibility of the proposed approach in recognizing the single failure. For the further study, the mean positions of two components and the distances of mean positions are calculated and shown in Table 4. It is found that the mean positions of the healthy data and each damaged data are symmetric to the original point. The distance results also correctively evaluate the failure intensity, except for set 5. But, it is still reasonable due to the defect appeared in the system identification, as mentioned earlier. The percentages and cumulative percentages of the principal components are given in Table 5 for five sets. The percentage is defined by the ratio between the variance in a specific principal axis and the total variance of the data. The cumulative percentage of first three principal components describes the concentration of the groups. Set 5 presents the largest cumulative percentage which indicates that the data concentration is the best. Similarly, if the data group concentrates well, the data group is more differentiable from each other. Physically, if the debonding data is more differentiable from the healthy data, it can be considered that the failure is more severe.
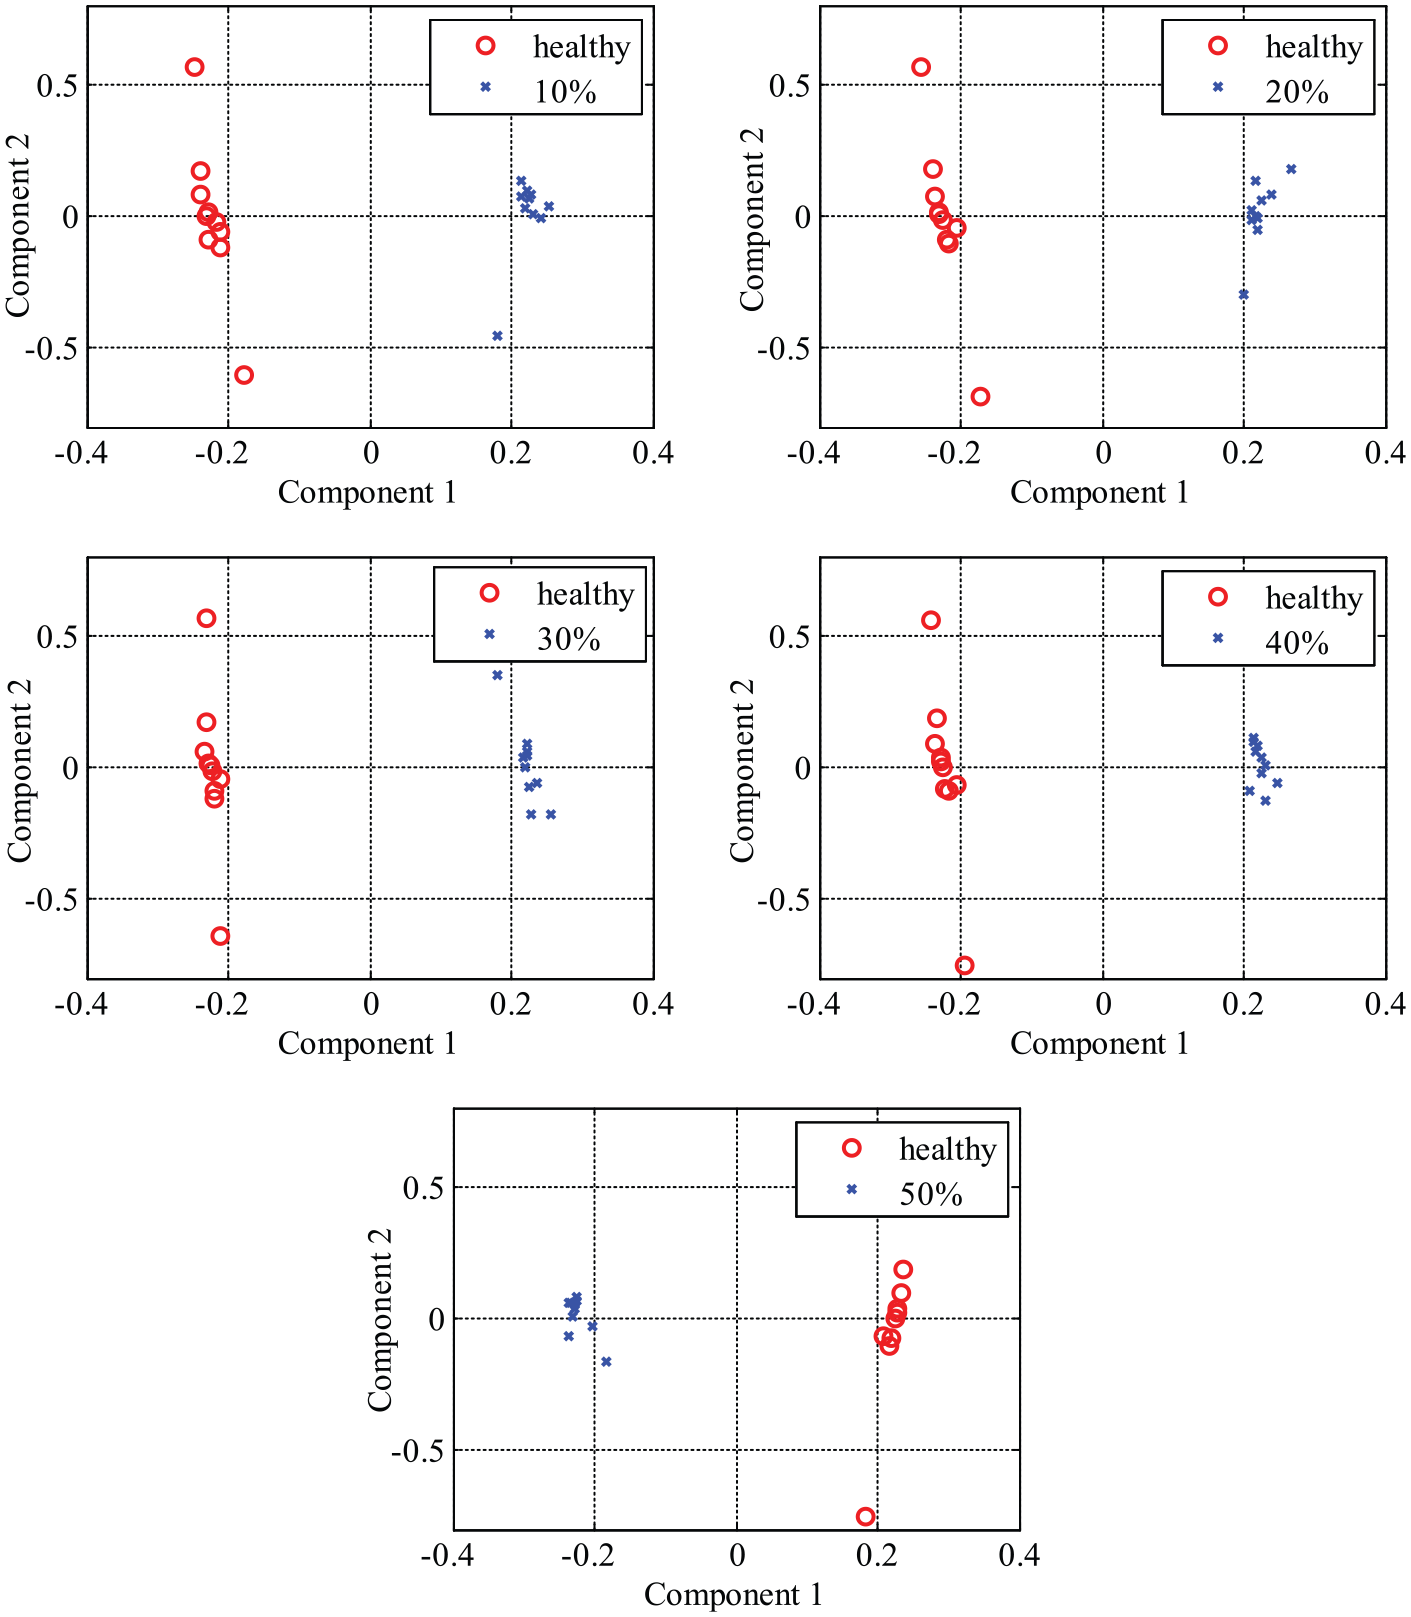
Assessment results for five sets of single-failure recognition using 2D component plot, p = 100.
Mean positions and the distances for single-failure assessment in 2D plot.
PC1: principal component 1; PC2: principal component 2.
Percentages and cumulative percentages of first three principal components for single-failure assessment.
PC1: principal component 1; PC2: principal component 2; PC3: principal component 3.
Failure location evaluation
To assess the failures at different locations, five candidate locations are defined by D0, D1, D2, D3, and DA, as shown in Figure 11. D0, D1, D2, and D3 represent the debonding locates at the mid-plane, the second, fourth, and sixth interfaces from the mid-plane, and DA represents the actuator interface. The debonding size is 50% of the actuator and considered same for all five cases. The objective of the location evaluation is to distinguish whether it is actuator debonding or interfacial delamination failure of the composite laminate and to evaluate the failure severity at each interface.

Lateral view of a 16-layer cross-ply laminate with five debonding locations for half thickness.
Figure 12 shows the assessment results for multi-failure location evaluation using the 3D component plot. It should be noted that the result is obtained using the direct system output data for system identification. This process is same with the previous intensity investigation. However, from Figure 12, it is found that only one group can be recognized clearly, that is, DA. The remaining four groups are mixed and cannot be grouped into each case. This is due to the fact that the actuator debonding failure is essentially different with the interfacial delamination failures. The actuator debonding has much more severe damage effect on the system response compared with the interfacial delamination failures and makes the system features much more prominent. To overcome such defects, the residual signal is used for the system identification instead of the direct system output data. Thus, the assessment result is shown in Figure 13 for multi-failure location evaluation. In this case, all five groups can be well recognized and distinguished from each other, although there are several isolated points. Therefore, using the residual signal, the proposed assessment approach is feasible in recognizing multi-failure categories of various locations.
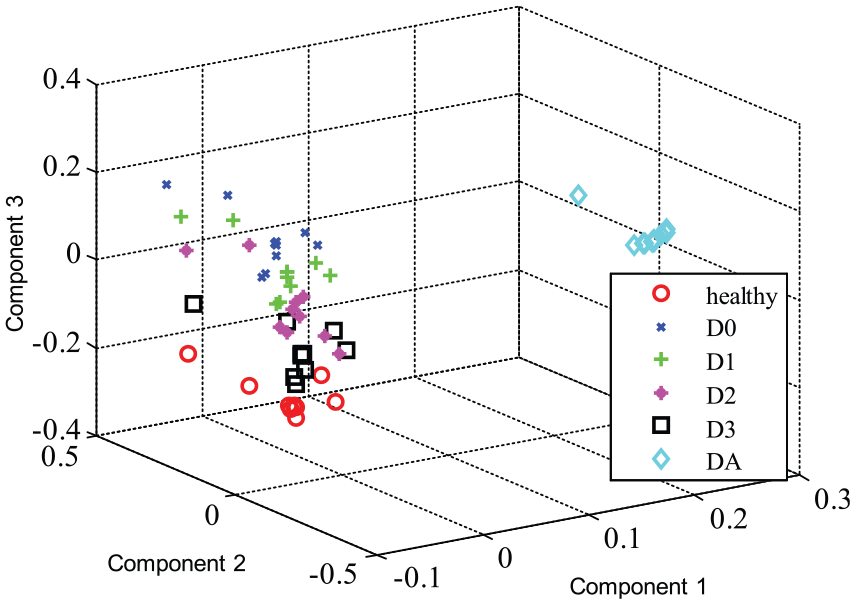
Assessment result for multi-failure location evaluation using the direct system output for system identification, p = 150.

Assessment result for multi-failure location evaluation using the residual signal for system identification, p = 150.
Figure 14 shows four assessment results for recognizing two failure cases: the actuator debonding and one interfacial delamination. In four graphs, DA case concentrates much better than other interfacial cases. Except for the separation of several points, the D0 and D1 groups show better concentration than the D2 and D3 groups which imply that D0 and D1 cases show larger damage effect on the system response. This is because when the damage effect is weak, the residual signal is very close to a random noise signal and consequently the failure features are less differentiable. As a result, the data concentration is much worse than the severely damaged cases. Therefore, based on these results, the application of residual signals for failure assessment is feasible in investigating the failure locations.

Assessment results for four sets of two-failure location evaluation using the residual signal for system identification, p = 100.
Concluding remarks
This work gave a numerical analysis of PCA-based failure assessment approach for evaluating the actuator debonding failure in smart composite structures and provided the feasibility of this approach in assessing the debonding failures in piezoelectric actuators. The smart composite laminate with partial actuator debonding was modeled by the improved layerwise theory and higher-order electric potential field for the electromechanical coupling. The proposed failure assessment approach requires the dynamic response data for the system identification to identify the system parameters. The system identification adopted a direct system identification method which efficiently predicted the system response with a small margin of error. The identified system parameters were used to construct the input matrix of PCA. The multi-failure and single-failure cases were taken into consideration for the failure intensity and location evaluation. The numerical results showed that the proposed approach successfully recognized the actuator debonding categories at the meantime of assessing the failure severity. Therefore, the proposed approach can be applied for the failure assessment of partial actuator debonding in smart composite structures.
Footnotes
Academic Editor: Seung-Bok Choi
Declaration of conflicting interests
The author(s) declared no potential conflicts of interest with respect to the research, authorship, and/or publication of this article.
Funding
The author(s) disclosed receipt of the following financial support for the research, authorship, and/or publication of this article: This work was supported by the National Natural Science Foundation of China (nos 11372145, 11372146, and 11272161), the State Key Laboratory of Mechanics and Control of Mechanical Structures (Nanjing University of Aeronautics and Astronautics) (grant no. MCMS-0516Y01), the research project of Zhejiang Provincial Education Department (grant no. Y201533401), and the K. C. Wong Magna Fund through Ningbo University.