
Abstract
In this study, a comparative analysis of two-phase flow in T-junction microchannels with different inlet orientations was carried out. Based on computational fluid dynamics and the volume-of-fluid model, bubble size, bubble velocities, and pressure distributions were analyzed. The numerical algorithm was validated with the experimental observations from former literatures; the results show that when the capillary number, Ca, is low, the length of gas and liquid slug in the symmetric T-junction is higher than that in the cross-flow T-junction. The effect of different forces acting on the slugs during the process of bubble formation was studied by investigating the velocity gradient and pressure distribution in the mixing zone. The result shows that the shear stress in cross-flow T-junction is over two times of that in T-junction with two symmetric inlets under the same operating conditions, which indicates that the size of bubble and liquid slug depends on the shear stress at low Ca number.
Introduction
Two-phase flow in T-junction has been studied experimentally and numerically by many researchers such as Santos and Kawaji, 1 Barreto et al., 2 and Fu et al. 3 The most desirable flow pattern is Taylor flow. A lot of studies were carried out in order to produce bubbles and droplets in a controlled and reproducible manner. In the past 2 decades, the bubble formation mechanism and bubble size laws in the microchannel have been studied extensively in order to amplify the heat and mass transfer efficiency in microchannels. Chen et al. 4 have analyzed the mechanism of droplet formation in a flow-focusing generator microchannel with water and oil where four parameters were used to describe the shape of the droplet. Using FLUENT software and volume-of-fluid (VOF) model, Pham et al. 5 have studied the flow patterns in the microchannel; the simulation result is in good agreement with former experiments. Garstecki et al. 6 investigated the droplets’ breakup process experimentally and theoretically, and they found that the viscosity of the continuous phase, interfacial tension, and the geometry of the devices all contributed to the droplet/bubble size.
T-junction is one of the most important microfluidic devices which have been widely used as biochemical reactors, heat exchangers, and mixers. Moreover, many other complicated microdevices applied in pharmacy and chemical engineering (for double emulsion, etc.) are improved based on T-junction microchannels. So, it is very important to improve the theory of two-phase flow in T-junctions in detail which will help us to optimize other structured microchannels. There are two types of T-junctions which people concerned with. The first type of T-junction has a construction of a short inlet inserted into the long horizontal channel perpendicularly. As shown in Figure 1(a), the dispersed or continuous phase enters the channel from the short inlet and the other phase enters from the horizontal inlet. This kind of T-junction microchannel is the most preferable geometry for researchers, and a lot of investigations were conducted on it. Simulations of microfluidic droplet formation in this cross-flow T-junction were carried out by Bashir et al. 7 using two-phase level-set method, and the effect of surface wettability on droplet length was taken into account. Numerical studies on pressure drop and droplet formation mechanisms were made by Yan et al. 8 and Li et al. 9 Yamamoto and Ogata’s10,11 experiments show that two-phase flow in small T-junction is quite unstable when flow rate ratios are extremely high or low. Chen et al. 12 analyzed the process of the bubble generation in T-junction with both Newton and non-Newton fluids experimentally and numerically and achieved the description of the bubble breakup mechanism. All these research studies show that the bubble will break up in a squeezing regime under low Ca and in a shearing regime under high Ca. The second type of T-junction is shown in Figure 1(b); this kind of T-junction has two vertical short inlets distributed between the main channels symmetrically. Gas and liquid enter the channel with a vertical velocity, but the vectors of the velocities are opposite. Qian and Lawal’s 13 work on this kind of microchannel was approved by many researchers, more than 500 simulations were carried out using VOF model, and correlations for dimensionless slug length were obtained. In a later study, Adeosun and Lawal 14 investigated the mixing behavior in this kind of microchannel experimentally and numerically, and the comparison between experimental data and simulation results indicates good agreement. Cherlo et al. 15 analyzed the flow behavior in symmetric T-junction with two kinds of immiscible liquids; the effects of various parameters on the flow behavior were obtained.

Schematic diagram of the microchannel T-junction in the simulation: (a) cross-flow T-junction and (b) symmetric T-junction.
In this article, computational fluid dynamics (CFD) modeling is used to study the behavior of two-phase flow in T-junctions with different inlet orientations. The simulation results are validated with former literatures. From these results, a distinction of bubble and liquid slug lengths was found between two types of microchannels under the same operating conditions. In order to analyze the mechanism of the discrepancy, flow rate ratio, capillary number, and pressure distribution and velocity gradient are investigated.
Mathematical model and numerical algorithm
Governing equations
The governing equations consist of the incompressible Navier–Stokes (N-S) equation and continuity equation, coupled with volume of fraction equation. A source term


where

The movement of the phase interface in the microchannels is largely affected by the contact angle at the channel wall. To model this effect, the interface normal
where


where αg and αl are the volume fraction of gas and liquid in each cell; the sum of the volume fraction of all phases adds up to 1.
Geometric model
In order to facilitate the comparison analysis, the geometry parameters such as effective length of the microchannel, the length of gas and liquid inlets, and the width of the channel for two types of microchannels are same. Water and air were chosen as gas and liquid phases; the physical parameters are shown in Table 1. Both three-dimensional (3D) and two-dimensional (2D) simulations were conducted, and the comparison shows that the length of the bubble and liquid slug from 3D and 2D simulations was very close to each other. The models of the T-junction used in the simulation are listed in Figure 1. For both simulation models, the width of the gas and liquid inlet channels, wc and wd, was 100 µm and the length of the gas and liquid inlet channels was 300 and 600 µm, respectively. The effective length of the main channel for both T-junctions was 3200 µm. In Figure 1(a), the air enters the microchannel from the vertical inlet and the water enters the microchannel from the horizontal inlet for which the angle between the inlets of the gas and liquid is 90°. In Figure 1(b), water enters the microchannel from upper side and air enters from bottom side for which the angle between the inlets is 180°. The superficial gas and liquid velocities vary from 0.04 to 0.3 m/s and 0.008 to 1.2 m/s, respectively.
Physical properties of liquids.

Numerical approach
As a powerful method for the research of two-phase flow in microchannels, the CFD software FLUENT has been widely used in past several decades. This work is conducted based on the CFD software FLUENT and VOF model. The flow in microchannel is treated as laminar flow; the segregated method was chosen for the simulations—pressure implicit with splitting-of-operator (PISO) schemes for the pressure–velocity coupling, second-order upwind differencing schemes for the momentum equation, the PREssure STaggering Option (PRESTO!) schemes for the pressure interpolation, and the geometric reconstruction schemes for the interface interpolation. In our work, the contact angle at the wall of the liquid phase was set to 36° and the boundary conditions at the inlet were set to velocity inlet and outflow for the outlet. The microchannel was assumed to be filled with water at the beginning of the simulation. Time step varies from 10−6 to 10−7 s to ensure the convergence.
Grid independence
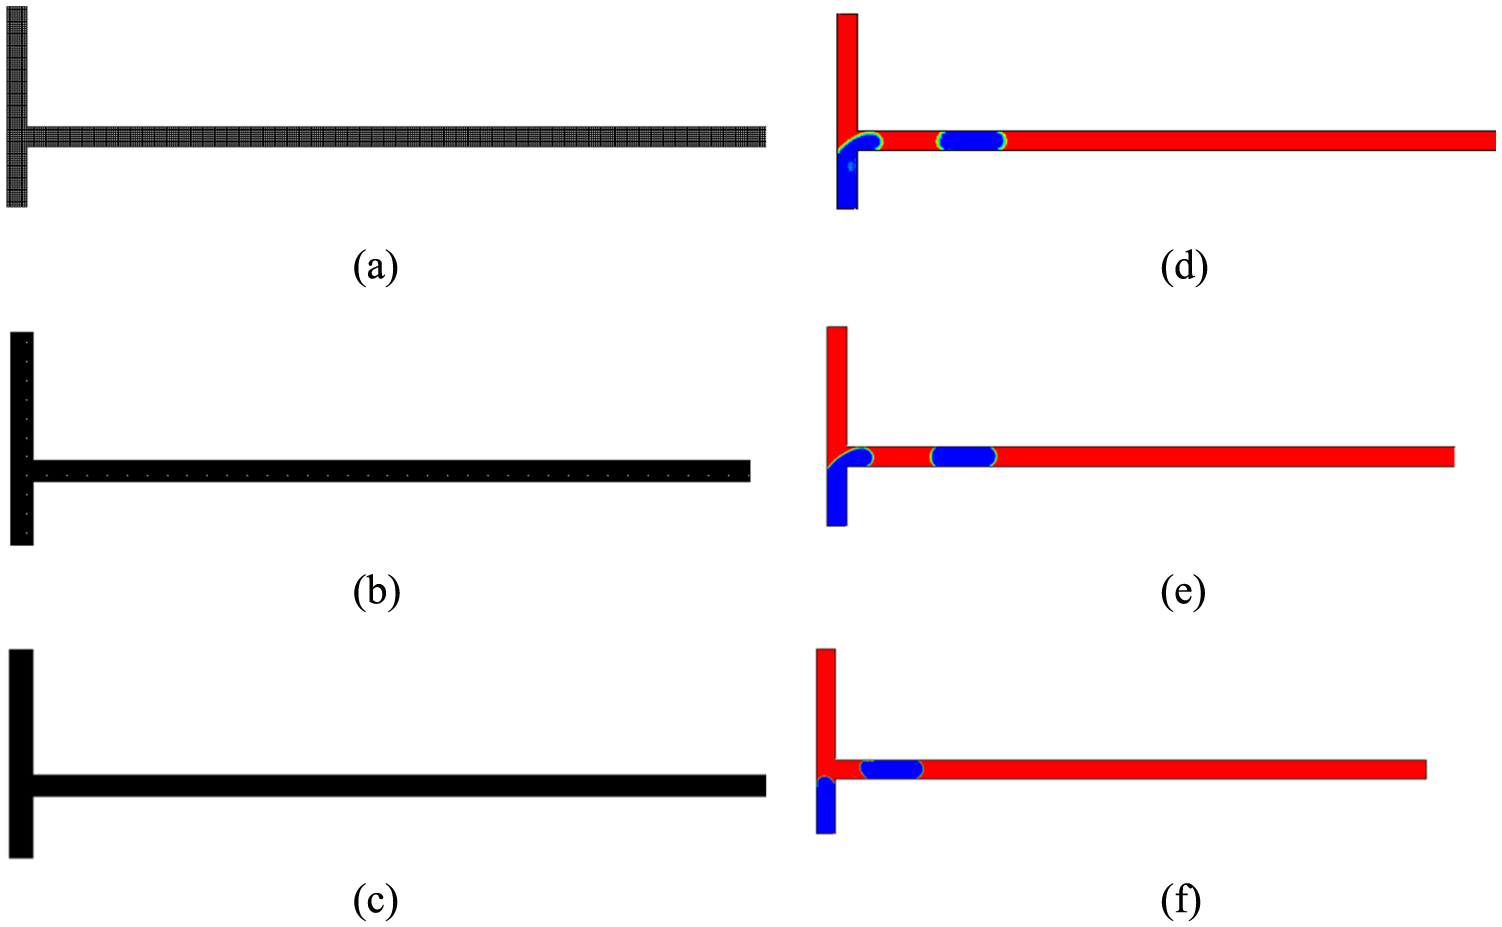
The computational domains were discretized with the GAMBIT mesh generator using quadrilateral mesh. In order to ensure that the meshes could capture the interface of the bubble and the liquid precisely, meshes of different sizes were selected for comparison. In Figures 2(a)–(c) and 3(a)–(c), meshes generated by GAMBIT for two types of T-junction models are listed. The mesh sizes of both T-junction models were 0.01, 0.005, and 0.0025 mm, respectively. Figures 2(d)–(f) and 3(d)–(f) are the results at three different mesh sizes when ug = ul = 0.3 m/s. According to the results in Figure 2(d)–(f), the interface of the gas and liquid becomes sharp due to the increase in mesh number, the bubble slug disappeared, and stratified flow was produced. In convection flow T-junction, as shown in Figure 3(d)–(f), the flow pattern did not change, whereas the interface between gas and liquid also becomes clear due to the increase of mesh number, which indicates that the grid independence has been achieved. For the sake of the efficiency of computations, the mesh with the size of 0.005 mm was chosen for further studies.

Computational domain and simulation results with different meshes: (a)–(c) computational domain discretized with 0.01, 0.005, and 0.0025 mm meshes; (d)–(f) contours of air volume fraction with different meshes (air is blue and water is red).
Computational domain and simulation results with different meshes: (a)–(c) computational domain discretized with 0.01, 0.005, and 0.0025 mm meshes; (d)–(f) contours of air volume fraction with different meshes (air is blue and water is red).
Model validation
The air volume fraction in cross-flow T-junction is shown in Figure 4(a) and (b), the gas and liquid velocities were set to ug = 0.31 m/s and ul = 0.33 m/s. Under these operating conditions, Taylor flow was achieved from simulation which is in accordance with the experimental results observed by Santos (shown in Figure 4(c)). In Santos’ work, the gas and liquid velocities were ug = 0.317 m/s and ul = 0.336 m/s. However, when the gas and liquid velocities set to ug = 0.237 m/s and ul = 0.252 m/s, stratified flow was exhibited in the experimental study shown in Figure 4(c). Simulation results which concur with the experimental ones are shown in Figure 4.
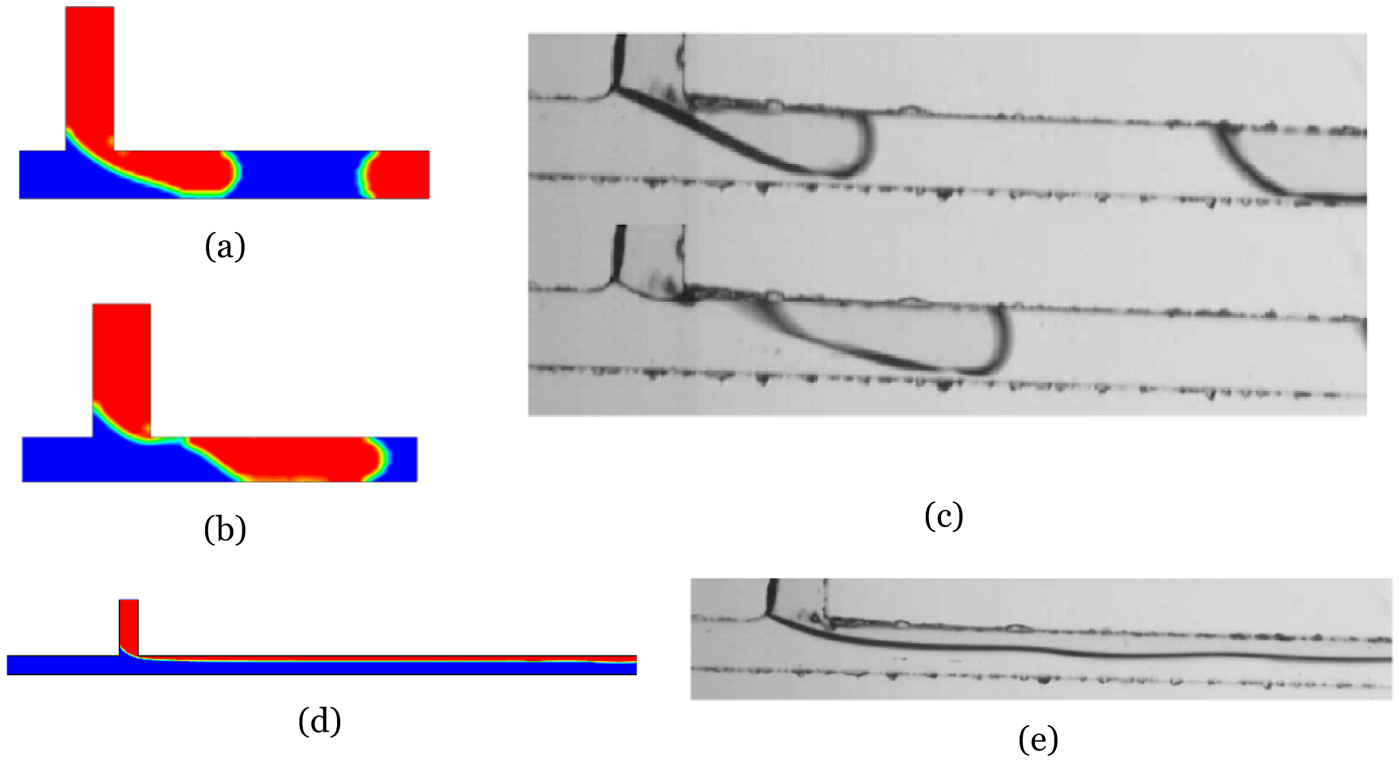
Comparison between simulation and experiment: (a, b, d) numerical simulation results; (c, e) experimental results from Santos and Kawaji. 1
In Figure 5(a)–(c), bubble formation process in symmetric T-junction when the gas and liquid velocities were set to 0.3 and 1.2 m/s is listed, a bubble with different radius of curvature at the cap could be observed. In Figure 5(f)–(h), pictures taken by charge-coupled device camera from Zhao et al.’s 16 experiment are shown. A little difference could be seen between our simulation and former experiments, it is possible that in Zhao’s experiment, oil and water were chosen as the working fluids, whereas in our simulation, the gas and liquid flows were water and air, the difference of viscosity has an effect on bubble generation and generation frequency, which was proved by Chen et al. and Cherlo. Figure 5(d) and (e) is the bubble flow and stratified flow obtained from simulation, which were in accordance with the experimental results observed by Zhao.

Comparison of bubble formation and flow patterns between simulation and experiment: (a)–(e) numerical simulation results; (f)–(j) experimental results from Zhao et al. 16
Results and discussion
Comparison of bubble length
The effects of surface tension and viscosity acting on the interface of gas and liquid were represented by capillary number, Ca, which was defined as

where uc is the carrier fluid velocity, µc is the viscosity of the carrier fluid, and σ is the surface tension.
Figure 6 presents the dimensionless bubble length, Lg/wc, from simulations with three groups of gas and liquid velocities. The gas velocity was fixed at 0.04, 0.1, and 0.2 m/s, the water velocities vary from 0.004 to 0.4 m/s, every group of velocities were performed on both T-junction models. The simulation results show that the bubble size decreases when Ca is increased. This is coincidence with the experimental data from Bashir and Li. Another conclusion which could be obtained from the simulation is that the dimensionless bubble length in symmetric T-junction microchannel is always higher than that in the cross-flow T-junction under the same operating conditions.

The influence of capillary number on dimensionless bubble length at different air velocities: (a) ug = 0.04 m/s, (b) ug = 0.1 m/s, and (c) ug = 0.2 m/s.
In former literatures, gas and liquid slug lengths have been studied a lot by researchers such as Qian and Lawal, Fries et al., 17 and Dang et al. 18 In Qian and Lawal’s work, simulations of two-phase flow in microchannels with different inlet geometries were carried out. From their work, the gas/liquid slug length is highly dependent on the configuration of the inlet and the slug length in two types of T-junctions can be depicted with one theory, but they did not pay much attention to the difference of slug length in two types of microchannels. Since their conclusion is obtained only by comparison of the slug length contours from simulation, and no specific value was given, so we think the result is not accurate enough.
In order to facilitate further studies, a new dimensionless number ΔLg/wc is defined as

where Lg,s is the bubble length in symmetric T-junction and Lg,c is the bubble length in cross-flow T-junction. Profiles of ΔLg/wc versus Ca are shown in Figure 7(a)–(c) when the gas velocities are ug = 0.04, 0.1, 0.2 m/s. The results indicate that dimensionless length ΔLg decreases as the capillary number Ca increases. This difference is remarkable when Ca is lower than 0.002 and could be over five times of wc, which means the bubble length in symmetric T-junction is much longer than that in cross-flow T-junction under the same operating conditions when Ca is low. Except capillary number, Ca, gas velocities also have contributed to this distinction between two types of T-junctions. With the increase in ug, dimensionless length ΔLg/wc is increased.

The influence of capillary number on dimensionless bubble length at different air velocities: (a) ug = 0.2 m/s, (b) ug = 0.1 m/s, and (c) ug = 0.04 m/s.
Comparison of liquid slug length
The dimensionless length of the liquid is defined as
where the subscripts l,s and l,c refer to liquid slug length in symmetric T-junction and cross-flow junction. Figure 8(a)–(c) shows the profiles of dimensionless liquid slug length versus velocity ratio ug/ul. The gas velocities were fixed at 0.04, 0.1, and 0.2 m/s and ug/ul varied from 0.25 to 10. The result indicates that liquid slug length decreases with the increase of ug/ul. In symmetric T-junction, liquid slug length is higher than that in cross-flow T-junction under the same operating conditions. Figure 8(d) is the profile of dimensionless difference of liquid slug length versus velocity ratio, the dimensionless length also increases as Ca decreases, but the trend is not as dramatic as mentioned in the last section.

Dimensionless length of liquid slug plotted against velocity ratio: (a) ug = 0.04 m/s, (b) ug = 0.1 m/s, (c) ug = 0.2 m/s, and (d) difference of dimensionless length of liquid slug versus velocity ratio.
Comparison of pressure distribution
In order to analyze the mechanism of the observations mentioned above, the pressure distributions of the two types of microchannels were studied. Figure 9(a) and (b) is the schematic diagram of the mixing zone and coordinate systems used in the study. Figure 10(a) and (b) is the comparison of pressure distributions along the centerline of the microchannel in the mixing zone, the results were obtained when ug and ul were set to 0.1 m/s. Figure 10(a) is the pressure distribution along x direction in the mixing zone at flow time t = 0.0062, 0.0064, and 0.0066 s. The profile indicates that the pressure in both types of microchannels stays constant in the first stage when the tip of bubble is still in gas inlet (as shown in Figure 11(a)), and the pressure in the cross-flow microchannel is higher than that in symmetric T-junction microchannel. In this stage, the main channel is filled with liquid and the gas tip just begins to shape, so the pressure along the centerline is stable. Difference of the pressure is mainly caused by the variation of liquid velocity direction when the liquid enters the main channel in symmetric T-junction. This variation caused an extra pressure and energy loss compared with cross-flow T-junction.

Mixing zone and coordinated system: (a) cross-flow T-junction and (b) symmetric T-junction.

Pressure distribution at the mixing zone along the x direction: (a) Pressure distributions along the centerline of the mixing zone in x direction from 0.0062 s to 0.0066 s in two different microchannels, (b) Pressure distributions along the centerline of the mixing zone in x direction from 0.0068 s to 0.0072 s in two different microchannels, (c) Pressure distributions along the centerline of the mixing zone of cross flow T-junction in x direction from 0.0074 s to 0.0082 s, and (d) Pressure distributions along the centerline of the mixing zone of symmetric T-junction in x direction from 0.0074 s to 0.0082 s.

Plots of air–water volume fraction in T-junction models. (a) t = 0.0064 s, (b) t = 0.0068, (c) t = 0.0070 s, (d) t = 0.0074 s, and (e) t = 0.0082 s.
Figure 10(b) shows the pressure distributions of two types of microchannels when flow time is t = 0.0068, 0.0070, and 0.0072 s. During this period of time, tip of bubble enters the main channel and begins to resist the flow of the liquid as shown in Figure 11(b) and (c), so the pressure is higher compared to the former stage in Figure 10(a). A pressure jump could be seen in this stage since the two immiscible fluids form an interface in this region. An interesting thing which should be noted is that the pressure of cross-flow microchannel decreases with the growth of bubble, whereas in symmetric T-junction, the pressure increases with the growth of bubble. In cross-flow T-junction, the Laplace pressure difference between the two phases is defined as ΔPLaplace = Pg−PlΔPLaplace drops from 1238 to 738 Pa during the process of the bubble formation. This is because along with the growth of the bubble, the interface of the two phases moved downstream under the pressure of the liquid, and the resistance of the gas decreases. In symmetric T-junction, ΔPLaplace drops from 1186 Pa so there is not much difference between ΔPLaplace in two types of T-junctions. However, the pressure of the liquid is mainly generated from y direction in symmetric T-junction in which stage the tip of the bubble did not move downstream, so the pressure continues to go up.
Another profile which should be noted is the pressure distribution at the flow time t = 0.0068 s. At this moment, a pressure jump could be seen in cross-flow T-junction, whereas in symmetric T-junction, the pressure keeps constant, which indicates that when the interface of the two phases moved into the flow junction of the cross-flow microchannel, the mixing zone of the symmetric T-junction was still filled with liquid, and the frequency of bubble generation in cross-flow microchannel is faster than that of symmetric T-junction microchannel.
Figure 10(c) and (d) lists the pressure distributions at the channel junctions versus x coordinate. In this stage, the tip of the bubble moves downstream under the pressure of the liquid, and the mixing zone is filled with liquid again, so at flow time t = 0.0080 and 0.0082 s, the pressure stays around −100 Pa in both microchannels as shown in Figure 11(e). When t = 0.0074 to 0.0078 s, the pressure distributions in two types of microchannels are quite different. In cross-flow junction, the interface of the two phases moves forward so the pressure at t = 0.0074, 0.0076, and 0.0078 s increases dramatically when the x coordinate increases, but in symmetric microchannel, the pressure is stable.
Figure 12(a)–(d) shows the pressure distributions at different flow time plotted against the y coordinate. Figure 12(a) and (c) is the pressure distributions in symmetric T-junction, and Figure 12(b) and (d) is the pressure distributions in cross-flow T-junction. In symmetric T-junction, pressure jump could be seen along y direction, the Laplace pressure drop between the interface of gas and liquid is almost stationary when t = 0.0064 to 0.0072 s, which was because the interface of the gas and liquid moves along y direction under the pressure of gas but the bubble tip did not enter the main channel yet. After flow time t = 0.0084 s, the mixing zone is filled with liquid and the pressure decreases rapidly, the pressure jump between interface of gas and liquid also disappears. In cross-flow T-junction, however, the pressure drop ΔPLaplace between interface of gas and liquid decreases eventually as flow time increases, and after t = 0.0080 s, the interface leaves the mixing zone and the pressure jump disappears.

Pressure distribution along the y direction at the mixing zone: (a) Pressure distributions along the centerline of the mixing zone in y direction from 0.0064 s to 0.0072 s in symmetric T-junction, (b) Pressure distributions along the centerline of the mixing zone in y direction from 0.0064 s to 0.0072 s in cross flow T-junction, (c) Pressure distributions along the centerline of mixing zone in y direction from 0.0080 s to 0.0090 s in symmetric T-junction, and (d) Pressure distributions along the centerline of the mixing zone in y direction from 0.0080 s to 0.0090 s in cross flow T-junction.
Comparison of velocity gradient
As we know, three forces acting on the bubble tip will affect the process of bubble generation: the surface tension force Fs, the shear stress force Fτ, and the force arising from the increasing resistance to flow of discontinuous fluid around tip Fp.
Since the shear stress could be depicted as

where τx is the shear stress along x direction, dux/dy is the velocity gradient, so the comparison of velocity gradient was carried out in order to analyze the contribution of shear stress to bubble generation mechanism in two different microchannels. Figure 13(a)–(d) depicts the profiles of velocity gradient near the channel wall versus x coordinate. Figure 13(a) and (c) depicts the profiles of velocity gradient in symmetric T-junction, and Figure 13(b) and (d) is the profiles of velocity gradient in cross-flow T-junction. The operating condition is ug = ul = 0.1 m/s. Since the velocity direction of gas at the inlets of cross-flow T-junction and symmetric T-junction is opposite, the velocity gradient in symmetric microchannel is negative, while in cross-flow microchannel it is positive. For both T-junctions, the absolute value of velocity gradient increases coinciding with the increase of flow time and attains their maximum value at t = 0.0068 and 0.0070 s, but in cross-flow microchannel, the maximum value could attain 13,687 s−1, and in symmetric T-junction, the maximum value only reaches 50,797 s−1. Although shear stress is much lower compared with surface tension and other forces acting around the tip, we think this difference of stress is the main reason for the discrepancy of bubble length in two types of microchannels under the same operating conditions. Because of the higher shear stress, an equilibrium of forces has been achieved earlier in cross-flow T-junction, resulting in the faster bubble formation frequency and hence the bubble length becomes smaller.

Velocity gradient near the wall: (a) Velocity gradient near the wall in symmetric T-junction from 0.0066 s to 0.0070 s, (b) Velocity gradient near the wall in cross flow T-junction from 0.0062 s to 0.0070 s, (c) Velocity gradient near the wall in symmetric T-junction from 0.0082 s to 0.0088 s, and (d) Velocity gradient near the wall in cross flow T-junction from 0.0072 s to 0.0088 s.
Conclusion
In this article, numerical simulations of two-phase flow in T-junctions with different inlet orientations were conducted under three groups of gas and liquid superficial velocities using VOF model. The comparison between dimensionless bubble length and liquid slug length in two types of microchannel T-junctions was carried out. Key findings are as follows:
The dimensionless bubble length and slug length in symmetric T-junction are higher than that in cross-flow T-junction under the same operating conditions. ΔL increases as capillary number, Ca, decreases.
The pressure in cross-flow T-junction is much higher than that in the symmetric T-junction under the same operating conditions, but the Laplace pressure drop of two microchannels during the process of bubble generation is quite close to each other.
The comparison of the velocity gradient near the wall indicates that the shear stress in cross-flow T-junction is much higher than that in symmetric T-junction, so the differences in bubble size and slug size are caused by the difference of shear stress. The effect of shear stress on bubble size is much bigger than other forces when Ca is low.
Footnotes
Academic Editor: Xiaotun Qiu
Declaration of conflicting interests
The author(s) declared no potential conflicts of interest with respect to the research, authorship, and/or publication of this article.
Funding
The author(s) disclosed receipt of the following financial support for the research, authorship, and/or publication of this article: The authors acknowledge the financial support provided by National Natural Science Foundation of China (Grant No. 51576095) and Natural Science Foundation of Jiangsu Province (Grant No. BK20151539).