
Abstract
Tool change is one among the most frequently performed machining processes, and if there is improper percussion as the tool’s position is changed, the spindle bearing can be damaged. A spindle malfunction can cause problems, such as a knife being dropped or bias in a machined hole. The measures currently taken to avoid such issues, which arose from the available machine tools, only involve determining whether the clapping knife’s state is correct using a spindle and the air adhesion method, which is also used to satisfy the high precision required from mechanical components. Therefore, it cannot be used with any type of machine tool; in addition, improper tapping of the spindle during an automatic tool change cannot be detected. Therefore, this study proposes a new type of diagnostic framework that combines cloud computing and vibration sensors, among of which, tool change is automatically diagnosed using an architecture to identify abnormalities and thereby enhances the reliability and productivity of the machine and equipment.
Introduction
With advance in modern science and technology, machine tools for industrial production are moving toward the desired traits of multi-functionality and high precision, efficiency, and power. However, the increasing number of sophisticated mechanical structure has led to closer interactions between system devices and correlations and couplings among components. In addition, vibration is a warning sign that constitutes the primary part of a machine being deteriorated critically. Fault diagnosis technology uses abnormalities during the operation of the key parts of machine tools to diagnose faults, thereby avoiding major accidents; it can also be used to seek fundamental solutions to current problems with equipment that are due to lack of regular maintenance or an excessive number of repair.
As changing machine tools is one of the most commonly performed procedures, this study discusses an automatic tool change (ATC) process that uses a tool’s vibration signal as a diagnostic to protect the spindle from economic losses caused by damage or downtime. To diagnose a fault quickly and accurately, this study suggests a new ATC diagnosis framework that combines cloud computing with the detection of tool wear to quickly and accurately diagnose the current ATC process and the tool’s state to determine whether there is any need for maintenance and downtime and to reduce the amount of loss due to tool failure.
Literature review
In recent years, technology has advanced and intelligence technology has received more attention; the vigorous promotion of intelligent maintenance systems (IMSs) has resulted in the systematic integration of research on a well-defined topic. Lee et al. 1 suggested applying intelligence technology to all types of manufacturing equipment.
Lee et al. 2 proposed a major framework for IMSs. In the study of intelligence technology, captured characteristics, analyses, and processes play very important roles in the important steps of converting signals, capturing characteristics and estimating quality. Each step may require selection of different methods due to its individual characteristics and needs. Over the past two decades, due to rapid development of computers’ capacity for computation, methods characterized by various types of signal conversion and processing have been suggested for state detection. These include wavelet transformation, time-frequency analysis, neural networks, fuzzy theory, and hidden Markov models (HMMs). The literature on detecting tool wear has frequently mentioned that a tool’s status is detected using vibration signals. El-Wardany et al. 3 analyzed the wear of drills and cracks by analyzing vibration signals in the time and frequency domains; Issam detected wear and categorized drills based on their vibration signals using a supervised neural network. 4 Chen et al. 5 used vibration signals and back propagation in a neural network to diagnose the key parts of a machine, such as its principal axis. And Chen et al. 6 also used vibration signals to monitoring for ATC system. This article according to Chen et al. proposed architecture to be improved and applied.
As for cloud computing, Google proposed its Google101 Plan 7 when cloud computing began to flourish. Cloud computing sends computation to a cloud server, thus allowing users to access in the cloud services from terminals at different locations without high administrative costs. By managing a local end server, one can obtain all types of services provided by the cloud flexibly; in addition, a cloud server is more reliable and scalable than a local end server. 8 The service-oriented model and architecture (SOMA)-based method proposed by Arsanjani 9 involves service analysis and design. The SOMA-based method divides service-oriented analysis and design into three stages: identification, specification, and realization.
Research methods
Cloud computing
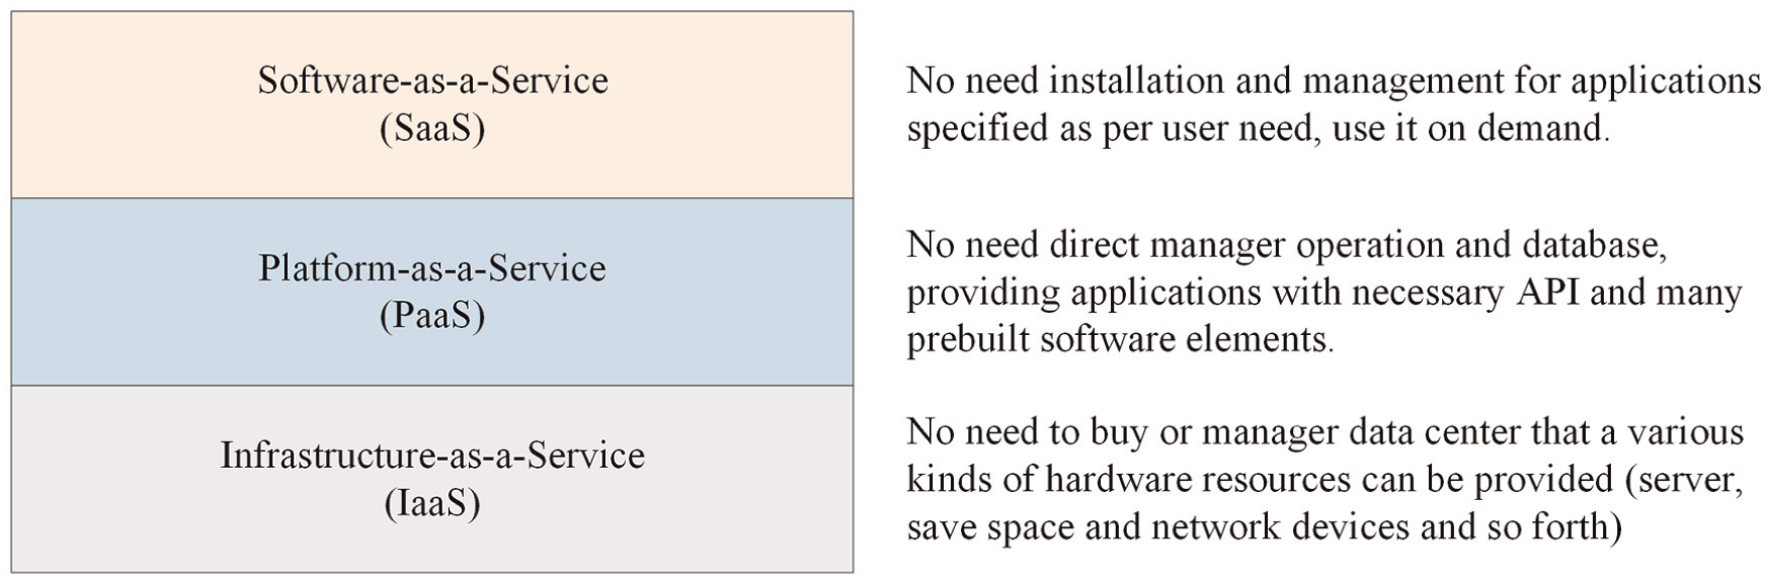
Cloud computing infrastructure originated in the extensive use of parallel computing; its main feature is the integrated application of a variety of different platforms, architectures, and levels in a distributed manner to provide different types of service and virtualization resources. Cloud computing has been able to attract service providers and users because it has the following advantages.
A high degree of scalability
When insufficient Internet service is provided to ensure the operation of a user’s terminal, service providers can improve the operational volume of a servo terminal using a real-time lease mode. When demand reduction is timely enough to reduce operation volume, it saves costs. In addition, scheduling algorithms can be used to extend user’s peak hours of Internet.
Reduction in the cost of human resources
In comparison with a traditional system, lease-based cloud computation may allow service providers to save human resources while building a server; they can focus on human resources solely in the development of service programs, which significantly reduces the cost of the labor required to maintain a server.
Reduction in the operational burden borne by the local device
The concept of cloud computing is similar to that of public resources, such as water, and enterprises and resource providers provide service-oriented cloud applications such as Google Maps and online versions of document editing software; such services allow clients with less powerful computers to submit tasks to the cloud for execution; the results are delivered to the user when the task is completed. This process reduces the demands on local hardware significantly.
Cloud computing is a new type of distributed system as shown in Figure 1; it is an architecture of computation that is created from numerous physical resources using virtualization technologies to provide a system that is highly scalable and decreases the cost of human resources and the computational burden on local devices. Because of these advantages, cloud computing may attract a great deal of attention from users in a short period of time. Virtualization management technology is the key to cloud computing; the design of a virtualization management system that uses resources efficiently and improves quality of cloud service is an important research topic.
Cloud computing architecture.
Because cloud computing uses virtualization management to control numerous physical resources in a unified manner and the number of tasks increases with the number of users, the use of a virtualization management system to assign tasks efficiently solves the problems of congestion and loss that result from an uneven distribution.
Vibration feature extraction
The vibration signal used for fault diagnosis in rotating machines with tools in operation has been widely studied; lack of balance, misalignment, loose parts, and bearing failures result in 80% of the common failures. The common diagnostic methods involve the analysis of time-domain waveforms, spectra, modes, and other sources of data. The differences between normal signals and faulty signals are used to identify the source of a fault. Because vibration detection is currently subject to ISO 2372:1974, 10 Table 1 lists the standards for equipment vibrations given in ISO 2372.
ISO 2372 standards for vibration severity.

PK: peak; RMS: root mean square; A: good; B: allowable; C: tolerable; D: not permissible.
Suggested classifications:
Class I: small (up to 15 kW) machines and subassemblies of larger machines.
Class II: medium size (15–75 kW) machines without special foundations or machines up to 300 kW rigidly mounted on special foundations.
Class III: large rotating machines rigidly mounted on foundations that are stiff in the direction of vibration measurement.
Class IV: large rotating machines mounted on foundations that are flexible in the direction of vibration measurement.
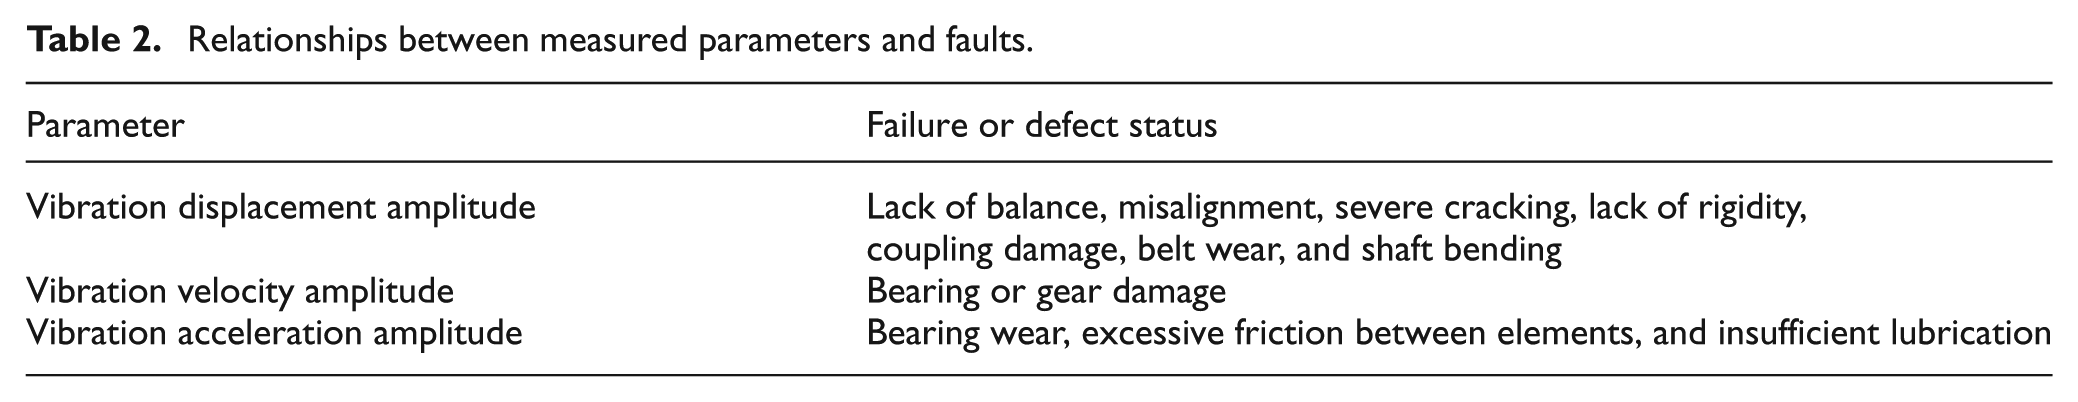
Because a device can exhibit one or more faults and generate multiple signals simultaneously, clear signs using parameters with physical meanings must be chosen. When investigating these signs, one can identify the category to which the cause of the fault belongs and further identify and exclude some or most of the possible direct causes of the fault, and the cause of failure is reduced to a certain extent. As shown in Table 2, the vibration amplitude is commonly used to determine the degree of a change and to isolate parameters with change made less, thereby identifying the fault or defect.
Relationships between measured parameters and faults.
Back-propagation neural networks
Back-propagation neural networks learned with high precision, recall information faster, recognize complex samples, and synthesize of highly nonlinear problems; therefore, in this study, we use a back-propagation neural network to construct a network infrastructure. In a single perceived layer, there are input and output layers. The input layer contains inputs, and the outputs are represented by nonlinear excitation functions that can be determined using formula (1)11,12

where
According to formula (1), the neurons in
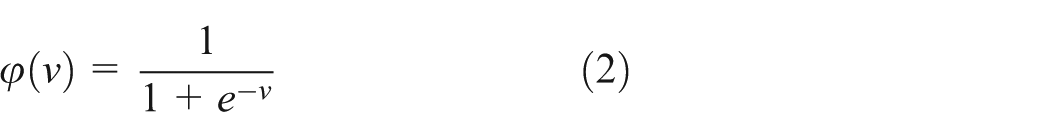
When the range of the excitation function is the interval (0, 1) and the S-shaped nonlinear interaction function is as shown in Figure 2, we use α to adjust the convergence trends of the curve, to accelerate the learning process and to reduce the volatility. Then, the derivative of the excitation function is


Sigmoid function (differential α = 0.5, 1 and 2).
If a network’s output value is not the expected correct result, the network enters the back pass correction stage, and then, the minimum root mean square (RMS) error is adopted using the steepest descent method so that the output value and the error in the target value are minimized, which adjusts the weights. The error function is defined in equations (4) and (5) 13

and

wherein E is the error function,
The minimum RMS error between the target output value and the network output value is the error function of the network; we transmit the error signal back to the network using this function and use the gradient descent method to calculate the weighted correction necessary to make the error function decrease in the direction of the maximum gradient. The method of calculation is shown in equation (6)
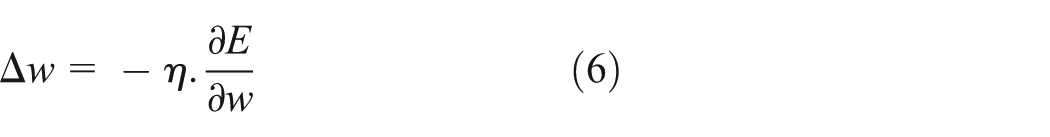
where w is the quickly weighted value of each layer of neurons,
Once the back-propagation neural calculation has begun, the chain rule is used to calculate the derivative at each layer, as shown in equations (7) and (8)


where
Then, during the training process, the weights and bias correction weights of the layers are calculated as follow:
The weights and bias weights between the updated input layer and the hidden layer are updated as follows


The weights and bias weights between the hidden layer and the output layer are updated as follows


where
Forward and reverse transfers are performed until the value of E is less than the error tolerance; then, the network’s training is complete. The process is shown in Figure 3. The error function created using the mathematical features modeled using the neural network understands the difference between the machine tool’s current signal and a normal signal; we use the magnitude of the error to forecast the damage to the machine. When the error, E, is less than the error function’s set value, the network’s training is complete. If the output value is higher, for example, the failure probability is also higher.

Back-propagation neural network flowchart.
The structure of system
The cloud computing platform’s architecture
To accelerate the diagnosis of machine tools and ATC and for the convenience of aircraft manufacturers using the system as a handy tool, this study proposes the use of the cloud computing–based service-oriented architecture (SOA) platform shown in Figure 4. The architecture is based on Arsanjani’s 9 architecture and improve his architecture in this research. The use of the powerful features and convenience of a cloud computing service means that machine tool manufacturers do not need to buy expensive systems and pay extra maintenance costs. In addition, service providers only need to provide services through the cloud platform, and it is more convenient to perform modification or upgrade in the future.
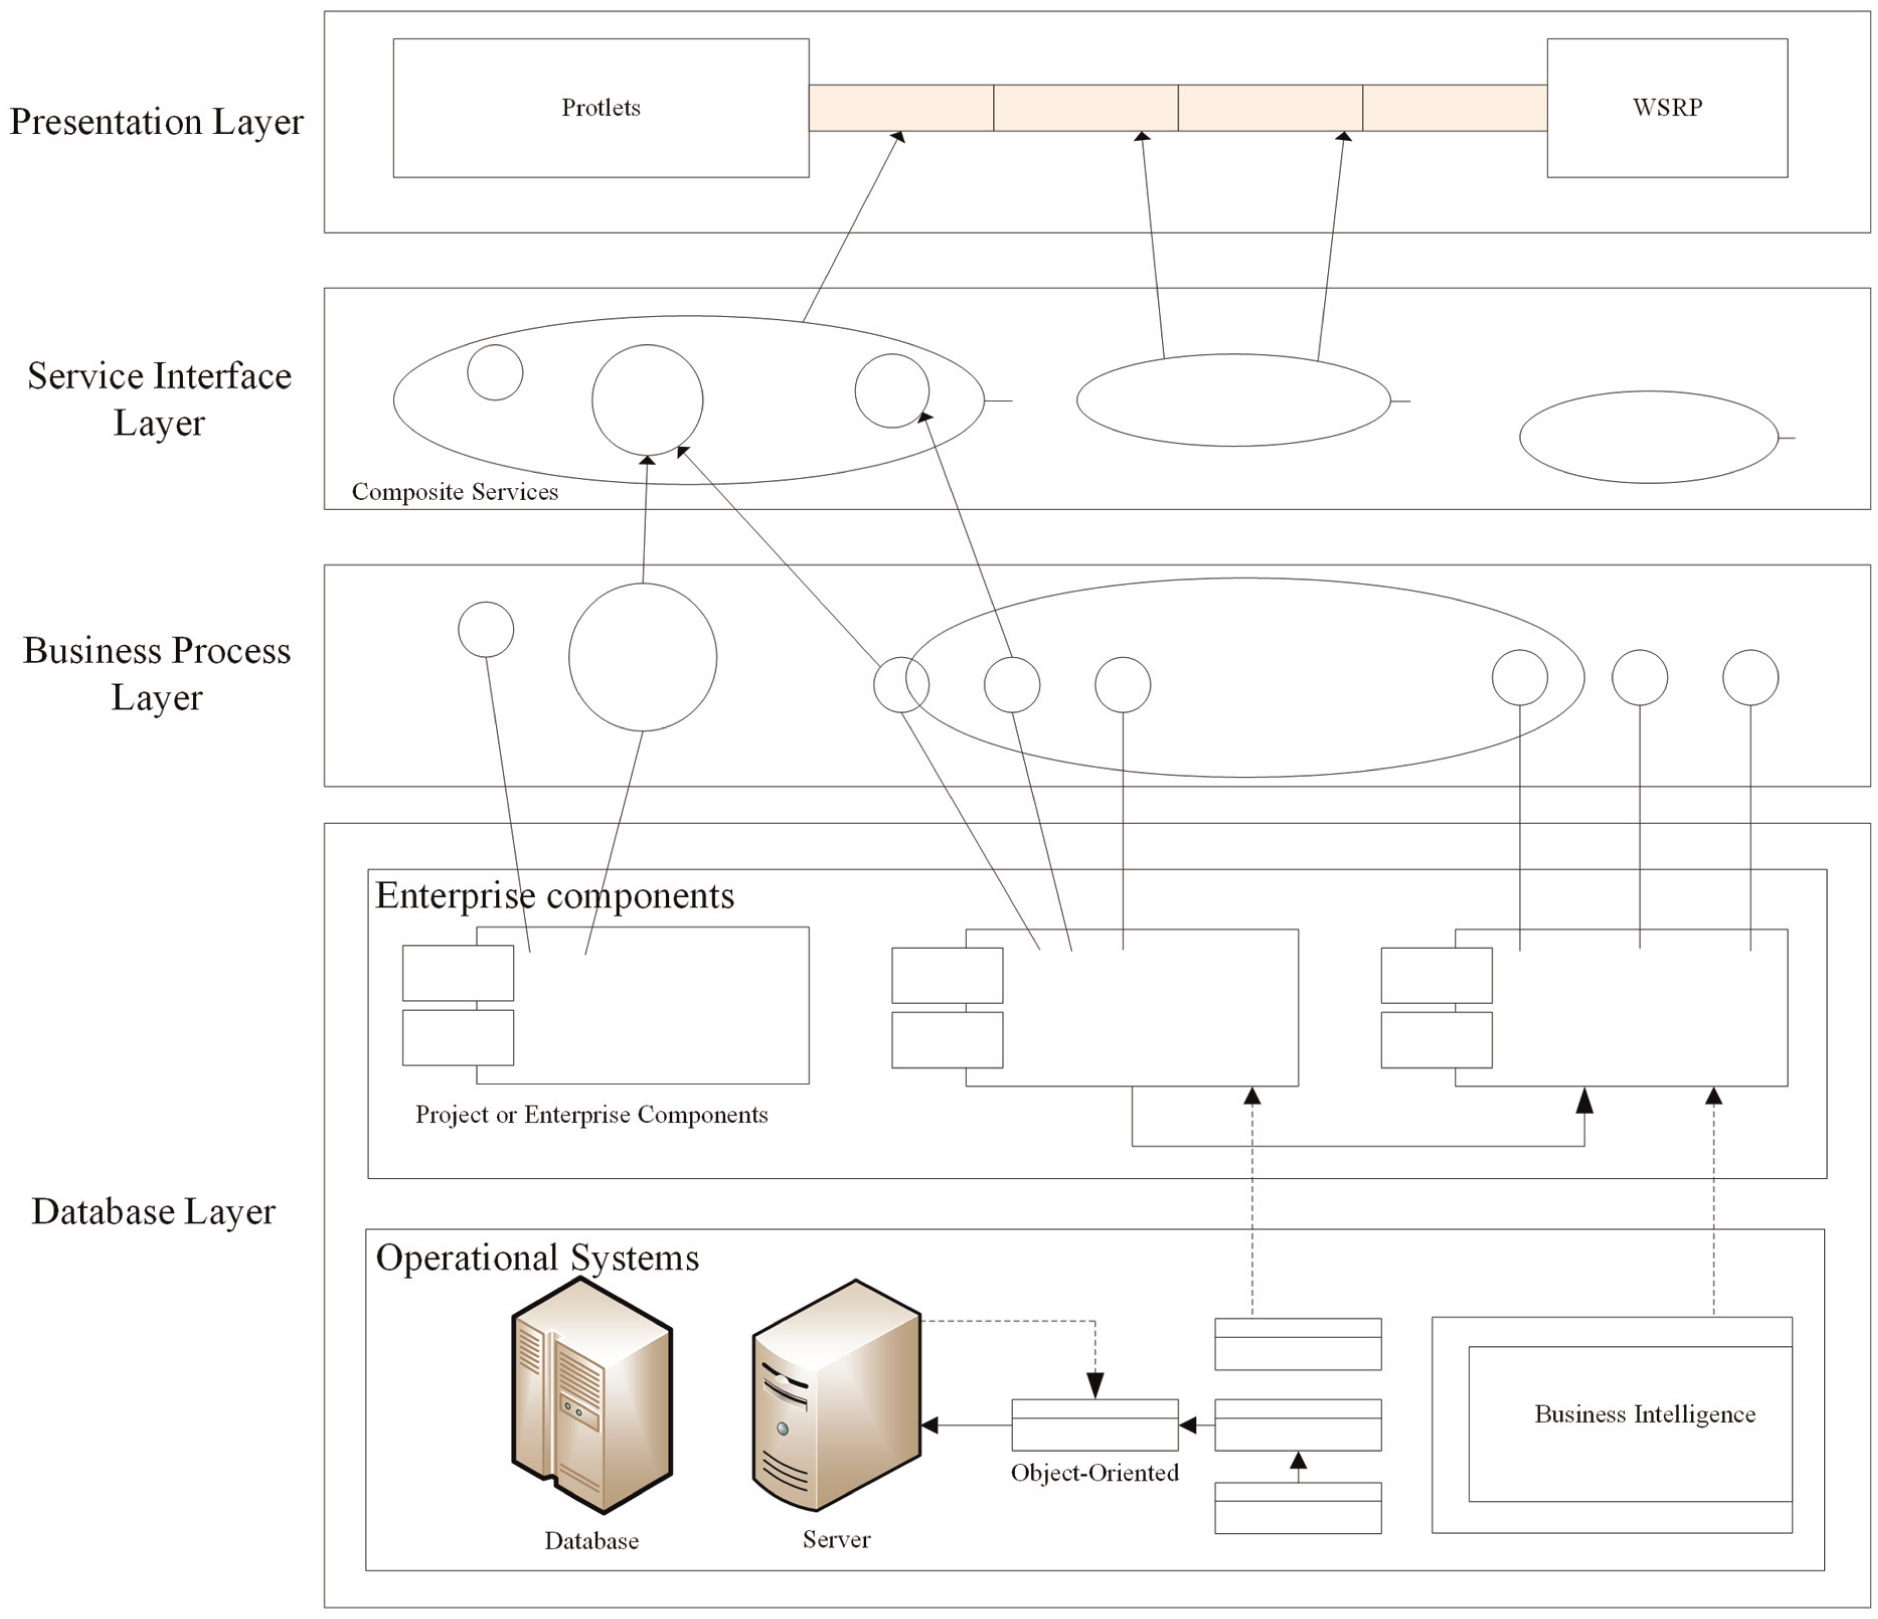
SOA architecture of cloud computing services platform.
Database layer
This layer has operational systems and enterprise components. The operational systems consist of the existing custom applications, called legacy systems, including existing customer relationship management (CRM) and enterprise resource planning (ERP) packages, older object-oriented system implementations, and business intelligence applications. The composite layered architecture of a SOA leverages existing systems and integrates them using service-oriented integration techniques. For example, the system described in this study can make applications, databases, and other software that were developed or purchased for diagnosing service-oriented technology integration available in such a framework. Specific applications include a spindle temperature monitoring system and raw material warning system.
Enterprise components are responsible for the functionality and for maintaining the quality of service (QoS) of the exposed services. These special components form a managed, governed set of enterprise assets that are funded at the enterprise or business unit level. As enterprise-scale assets, they are responsible for ensuring compliance with service level agreements (SLAs) by following architectural best practices. This layer typically uses container-based technologies such as application servers to implement the components, manage the workload, keep availability high, and balance the load. The basic components of a functional service unit include service component architecture (SCA) members that are encapsulated by the existing application functionality; the main purpose of an SCA is to define a standard eXtensible Markup Language (XML) scheme for the SOA’s service providers to base the cloud service on; developers use the definition of XML with the SCA’s uniform standard to define private services of individual companies for vendors to combine and reuse.14,15
Business process layer
The composition and choreography of the services exposed in the database layer are defined in this layer. Services are bundled into a flow-through orchestration or choreography that allows them to act together as a single application. We define a service portfolio and layout based on the business processes of the vendors, exchange information and messages using the interfaces to other cloud services, and use a business process execution language (BPEL) to describe service arrangements to create an application; we use visual-aided design tools to design their cloud services user process.
Service interface layer
The services the business chooses to fund and exposes reside in this layer. They can be discovered, statically bound and invoked, or possibly, choreographed into a composite service. The service layer also provides the mechanism for externalizing a subset of the interfaces of enterprise-scale components, business unit–specific components, and, in some cases, project-specific components as service descriptions. Thus, enterprise components allow services to be provided at runtime through their interfaces. The interfaces are exported as service descriptions and exposed for use in this layer. They occur in isolation or as composite services. We combine one or more cloud services into a portfolio of services that can be provided in public or static tying, executed, or orchestrated, while the service layer provides public and private services and specific project services in certain circumstances, and we specify a service interface using a descriptive form of the cloud services.
Presentation layer
This layer is a SOA decoupling the user interface from the components and that one must ultimately provide an end-to-end solution from an access channel to a service or set of services. User interfaces include services such as system websites and mobile devices. In addition, this architecture includes an integrated enterprise service bus (ESB) that specifies a web service description language (WSDL) that knows the location of each provided service clearly; an ESB integrates our services using an intelligent router, protocols, and other conversion mechanisms, and we maintain service quality, security, management, and surveillance by means of standard web service management and related protocols to maintain the SOA in a robust state.
The automatic tool changer diagnostic framework
The ATC monitoring and diagnostic features developed in this study are based on a diagnosis function that was developed using a cloud computing platform. This function transfers any vibrations sensed in the machine tool to the cloud computing platform and then quickly determines the current state of the machine tool using the cloud computing platform; Figure 5 shows the framework of the cloud computing platform that diagnoses machine tools. As examples of automatically diagnosing tools, this study discusses machine tool percussion and spindle tool holding.

Cloud computing services platform framework with machine tool diagnostic services.
Diagnosing machine tool percussion
There are ATC arm rotates and snaps, and the spindle clasps the tool in the ATC system for process; it occurs at a high frequency. The ATC arm clasps each burden differently, which could cause the arm to deform over time and eventually lead to snapping or clasping at an unusual angle. Therefore, this study proposes the process for changing tools and diagnosing percussion that is shown in Figure 6. According to the process of change and percussion flowchart, certain vibration thresholds must be set to diagnose the current state of a tool and its percussion.
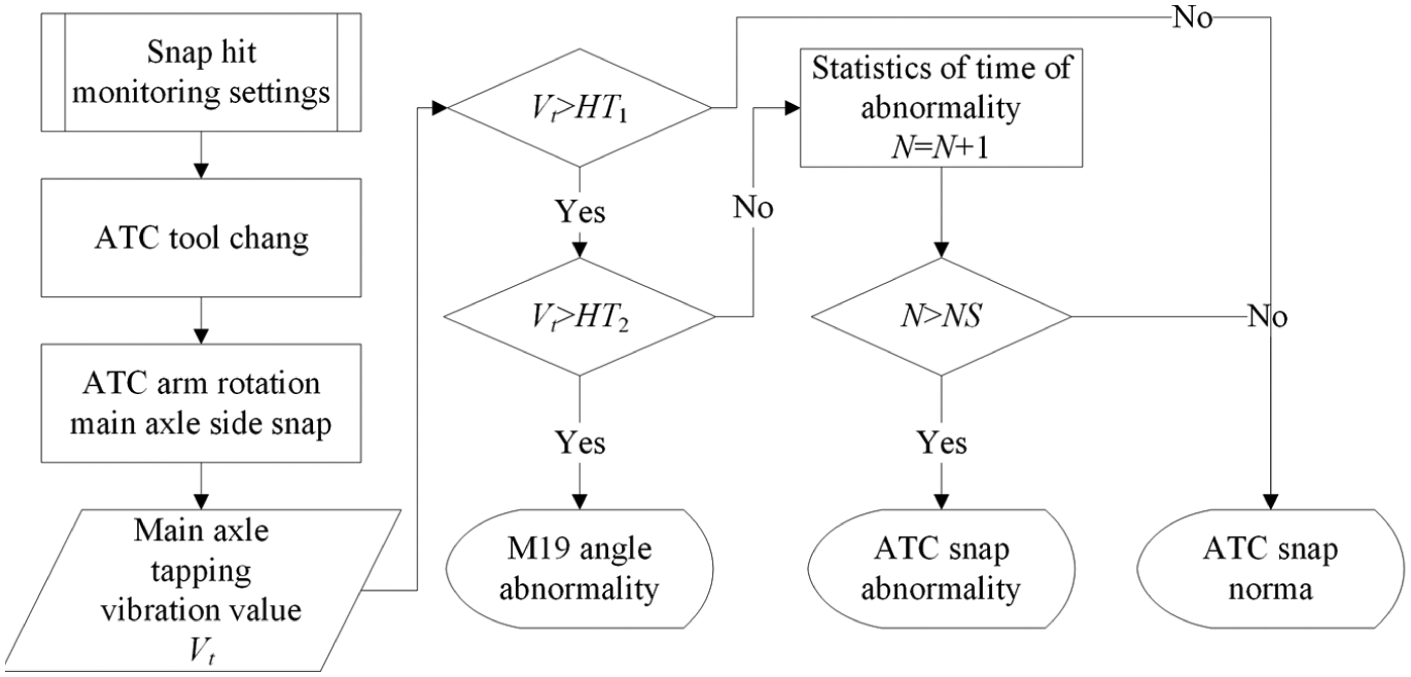
Diagnosis of tool percussion and change.
Diagnosing the spindle tool clasp
During the machining process, iron is cut and dirty oil is generated, which contaminates the part that clasps the tool; therefore, the tool held in the spindle clasp is put into an idle mode of operation at peak speed, and then, any vibrations of the tool during its rotation are detected, and abnormalities are diagnosed as part of the replacement and troubleshooting processes. However, if abnormal vibrations continue after the tool is replaced, the machine must be shut down for inspection and repair; see Figure 7 for the diagnosis process.

Flowchart of diagnostic spindle tool clasp.
The structure of tool life diagnostics
The tool life is diagnosed using a structure based on a back-propagation neural network, which performs multilayer perception (MLP) plus a general learning algorithm based on an error back-propagation (EBP) algorithm to create a back-propagation network. The input and output layers show the inputs and outputs, and the number of neurons in each layer depends on the type of problem; the number of neurons in a hidden layer is determined using trial and error, and hidden layers are added individually to reflect the complexity of the problem. Figure 8 shows a back-propagation neural network and the Bayesian network structure of the tool life diagnostic process. We may be able to identify the difference between the tool’s vibration signal and the normal vibration signal that is currently using the error function and determine whether the tool is damaged using the amount of error to predict the life of the tool.

Back-propagation neural network structure for diagnostic tool life.
Results and discussion
Cloud platform performance of experiment
In this study, the size of the enterprise is guided by the loading test performed on the cloud platform, and the simulations vary the number of online users and the size of the database and test a hybrid model, various scenarios, browser use, duration and sampling frequency, and other parameters. This study designs three experiments with the experimental scale of 25, 60, and 250 people, and other conditions are the same. The scenarios simulated are shown in Table 3.
Parameters used in the simulated experiments.

The results of the loading test performed on the cloud platform in each of the scenarios simulated in this study are shown in Figure 9, while the vendors’ response time and the amount of data transmitted are shown in Figure 10. This study presents a cloud computing–based service-oriented platform that works well for both large and small enterprises; users receive rapid responses that contain data from the system.

Cloud services platform loading test experiment.
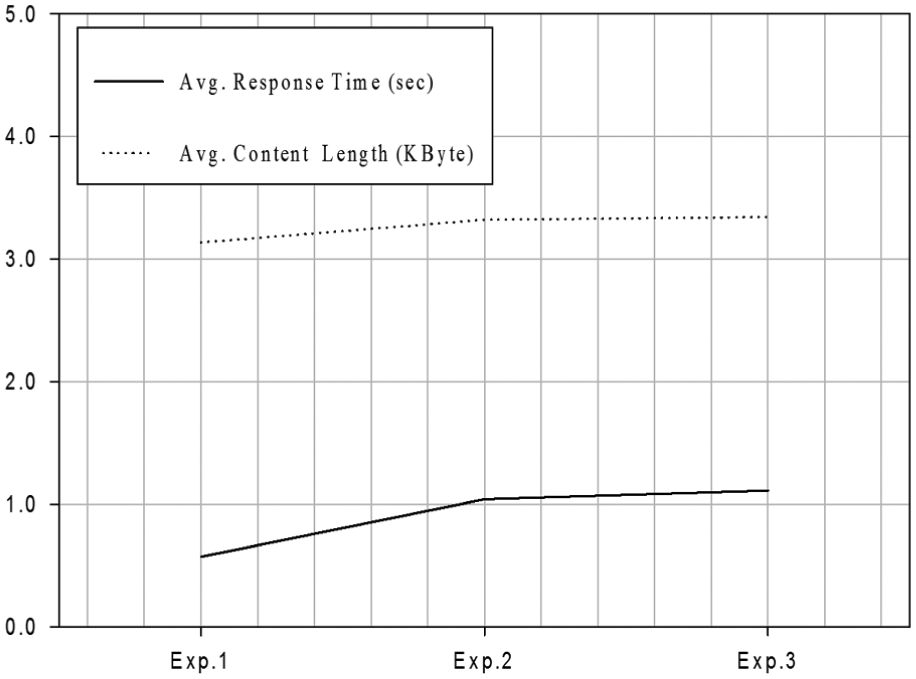
Vendors’ response time and the amount of data transmitted
ATC abnormality assessment of experiment
The triaxle-accelerometer was disposed on the spindle of experiment. A total of three groups were used for test in experiment. First, the model training used 1200 signals in total of four states, followed by 1200 signals, a total of 12 sets, for abnormality assessment. The results would determine whether ATC is under normal operating condition, and which state of fault it is when it occurs. Table 4 shows category setting of ATC abnormality status.
Category setting of ATC abnormality.

ATC: automatic tool change.
Each test file has 100 test signals, while each channel has four test files. A total of three channels were used for abnormality assessment and fault analysis of ATC. The results of the abnormality assessment are shown in Table 5.
ATC for abnormality assessment result.

Accuracy = (times correctly tested)/(times tested).
ATC: automatic tool change.
Tool life performance of experiment
In this study, a back-propagation neural network was used as a diagnostic tool for machine tools. First, we divided the wear process of a machine tool into 12 isochronous time intervals, and we randomly selected the amounts of wear from 20 groups of tools as samples; 15 of these groups were used as training samples, and the others were test samples. The experiment parameters are shown in Table 6.
Parameters used in the neural network’s prediction of the tool life.
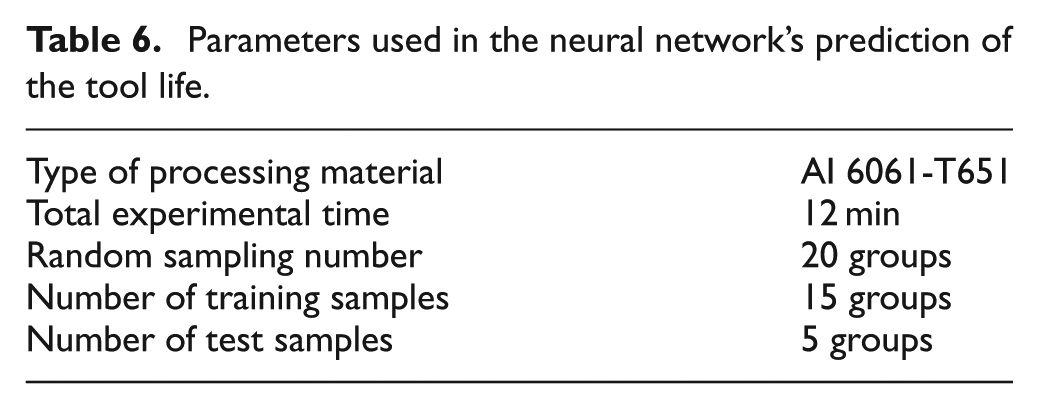
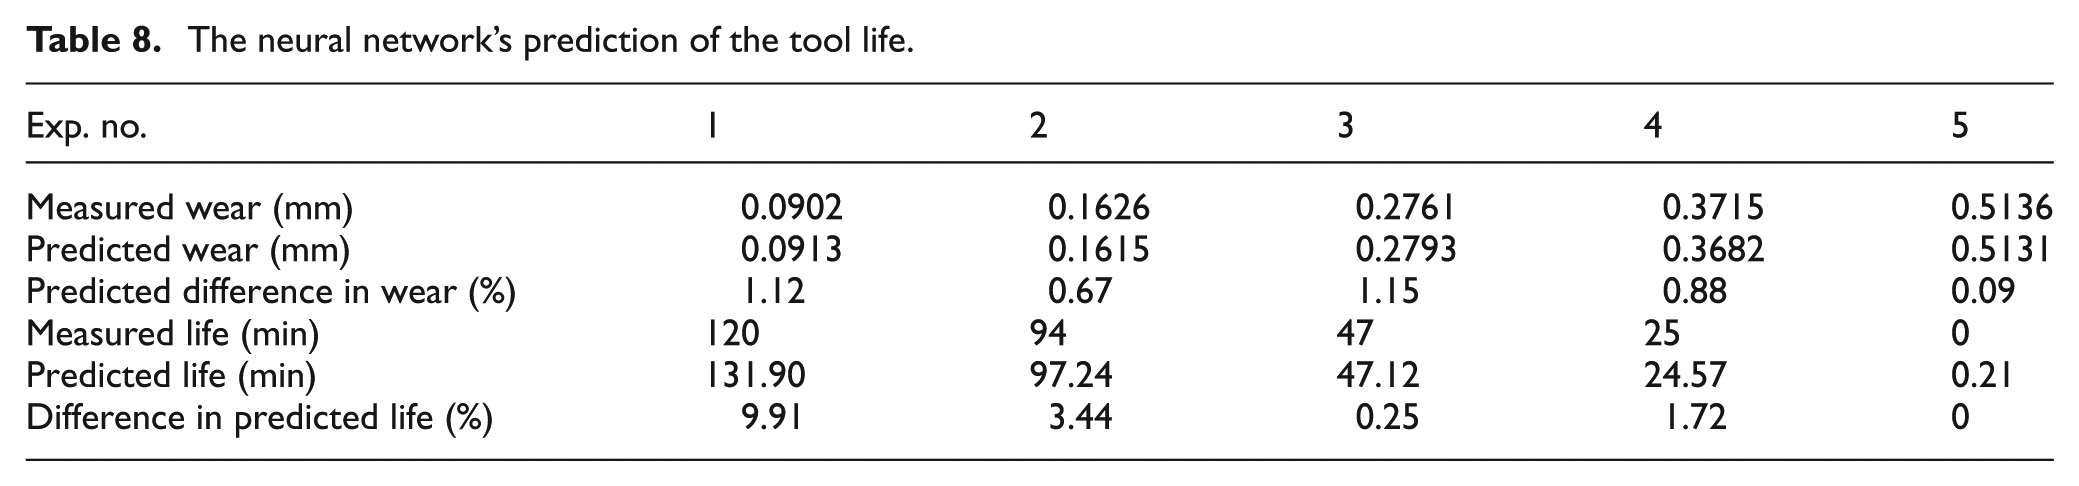
Figure 11 shows the characteristic difference between the functions (minimum squared error (MSE)) and the training time for a given tool. The neural network initial value setting is shown in Table 7. We used the remaining five groups of test samples as inputs for the trained neural network, and then, we calculated a pre-defined target output layer using the characteristic function based on the experimental results. We are able to determine the amount of wear on a tool and predict its remaining life from the results of the calculations shown in Table 8.

Characteristic function difference.
Parameters used in the neural network initial value setting.

The neural network’s prediction of the tool life.
Conclusion
This study proposed a new diagnostic scheme that combines cloud computing, ATC diagnosis, and tool life diagnostics; it can also quickly identify an unexpected situation while changing a tool to reduce the defect rate of that process and increase the production efficiency, improving industrial competitiveness. The structure and experimental results presented in this study are summarized as follows:
A full range of diagnostics for use during ATCs. Vibration sensors are used for assessment and diagnosis, providing a diagnosis of the performance state that is in line with tool changes and lifespan.
Rapid and accurate diagnosis of ATCs. The cloud platform can quickly make diagnoses in its service-oriented mode, saving vendors and users the cost of building a diagnostic platform.
Flexible expansion of diagnostic services. Vendors can develop services that meet their needs, and service providers can provide cloud-based service with better performance. They may also be free to maintain cloud service indefinitely, developing and maintaining such services at any time and place.
Footnotes
Acknowledgements
The authors are grateful to Tongtai Machine & Tool Co., Ltd, for providing the machine tool support that enabled this study to be conducted smoothly.
Academic Editor: Stephen D Prior
Declaration of conflicting interests
The author(s) declared no potential conflicts of interest with respect to the research, authorship, and/or publication of this article.
Funding
The author(s) disclosed receipt of the following financial support for the research, authorship, and/or publication of this article: This work is supported by the Ministry of Science and Technology through grant no. 103-2221-E-006-085.