
Abstract
The combined revealed preference/stated preference data–based discrete choice model has provided the actual choice-making restraints as well as reduced the prediction errors. But the random error variance of alternatives belonging to different data would impact its universality. In this article, we studied the traffic corridor between Chengdu and Longquan with the revealed preference/stated preference joint model, and the single stated preference data model separately predicted the choice probability of each mode. We found the revealed preference/stated preference joint model is universal only when there is a significant difference between the random error terms in different data. The single stated preference data would amplify the travelers’ preference and cause prediction error. We proposed a universal way that uses revealed preference data to modify the single stated preference data parameter estimation results to achieve the composite utility and reduce the prediction error. And the result suggests that prediction results are more reasonable based on the composite utility than the results based on the single stated preference data, especially forecasting the mode share of bus. The future metro line will be the main travel mode in this corridor, and 45% of passenger flow will transfer to the metro.
Introduction
In transportation field, the discrete models are frequently being used for traffic demand prediction, policy evaluation, and level of service (LOS) evaluation1–9 with satisfied results.
Compared with other models, the discrete choice model is better at analyzing traveler’s travel choice behavior with small sample-sized personal data. Stated preference (SP) data and revealed preference (RP) data are two data types used for discrete choice model. 10 The RP data represent actual traveler’s travel choice,10–12 but cannot reflect the traveler’s preference to new travel mode or new travel services. The RP data may cause model errors according to correlation issue,13–16 while the SP data have no correlation issue and represent the traveler’s preference under presumed scenarios. Unfortunately, the SP data lack actual restraints.17–22 Thus, the combined RP/SP data model is proposed to add both data types’ advantages and reduce their prediction errors.10,23,24 Bradley and Daly theoretically proved the feasibility of applying combined RP/SP data in discrete choice model. 23 Ben-Akiva used discrete choice model to predict traffic demand based on combined RP/SP data. Their results suggested that the single SP data result had biased conclusions, while the combined data analysis results were more precise. 24 Elisabetta and Cherchi analyzed the impact of a new train service in Caglirali with the RP/SP joint model. 25 However, little empirical research about its universality has been done in realistic environment. In this article, we demonstrate the applicable conditions of the RP/SP joint model and propose to use RP data to modify the single SP data parameter estimation values and achieve the composite utility, in order to overcome the disadvantages of RP/SP joint model and improve the precision of model results.
A new subway Route 2 is planned along Chengdu–Longquan Corridor in Sichuan, China. Assuming subway Route 2 has been operated, based on the single SP data and RP/SP joint data, we can study the predicted mode shares of this corridor, verify the universality of the combined RP/SP data, and demonstrate the effectiveness of the composite utility. The study results will help policies to encourage people take public transits and help to solve the congestion problem of Chengdu–Longquan corridor.
The article is structured as follows. Section “RP/SP joint model” introduces the RP/SP joint model. Then, section “Data analysis” describes the questionnaire survey and data analysis. Section “Model results” demonstrates the applicable condition of the RP/SP joint model. Section “The composite utility” illustrates the specific process of realizing the composite utility. Section “Elastic analysis” compares prediction results between composite utility and the single SP data. Finally, section “Conclusion” summarizes the main contributions and suggests possible extensions for this research.
RP/SP joint model
The RP/SP joint model, discrete choice model, combining the SP data with RP data was developed by Bradley and Daly. According to the random utility theory, the utility is a random variable and composed of a deterministic component Vni and an unobserved stochastic component ε. Vni can be calculated by characteristics observed, and both Vni and ε are assumed to be linear. So for travel mode i, its utility for traveler n can be described as follows 10,11,26


where Xnik is the attribute of traveler n’s choice alternative I and
The probability P of traveler n choosing travel mode i is

where
When ε is independent and follows Gumble distribution, its distribution and density function are as follows

where λ > 0 is the scale parameter, and its relationship with the variance D(ε) is as follows

Substituting equation (4) into equation (3), iteration equation (4) can get the multinomial logit (MNL) model equation (6)

where Cn is the alternative set, Xnik is the attribute of traveler n choice alternative i, and θk is the unknown character of alternative attributes.
θk is the unknown character of equation (6), and the choice probability of travel mode can be calculated through maximum likelihood estimation as follows.
If traveler n’s travel mode choice result is δni, then the probability of achieving all δn1, δn2, …, δni is

where
And if the sample size is increased to N, the probability of achieving all travelers’ travel choice–making results is

where equation (8) is the likelihood function of MNL, and its logarithm likelihood function L is

where L in equation (9) can be proved as the convex function of θ. And the maximum likelihood estimation

With equation (6) and

where

For these samples, we can get the attribute’s utility function, characters, and utility of every alternative using the maximum likelihood estimation (equation (11)) and the probability of each alternative using equation (6). Using the probability prediction method, we also get the choice probability of every alternative in all samples. The probability prediction method is that we first calculated the choice probability of each alternative for each sample by the utility function, and then, we weighted average of the choice probability for each alterative as its probability. The calculation function is shown below 10

where Pi is the share of alternative i and Pni is the probability of traveler n choosing alternative i.
The unobserved factors of the utility function are represented by the random error term ε and γ. The RP/SP joint model hypothesis is that there are outstanding differences between the random error terms of different data. As shown in equation (13), µ2 equals to the variance ratio of utility function of random error terms between RP and SP data 1

where ε and γ are random error terms of RP data and SP data utility function and λ is scale parameter.
Therefore, the utility function of alternative i of combined data is represented by


where
Since the utility random term of SP data, µγi, equals to the RP data–based variance of utility random error term, it can be resolved by building a virtual nested logit (NL) tree. In this NL tree, the alternatives of RP data are placed below the root level, while the alternatives of SP data are placed in a single SPL (each level of decision tree) level. Figure 1 is the demonstration of virtual NL tree of RP and SP data.

Virtual Nested Logit (NL) tree.
The utility functions of SPL level are shown below

where equations (15) and (14) have the similar formation; thus, building the virtual NL tree can resolve the RP/SP joint model.
Data analysis
In this article, the Chengdu–Longquan Corridor is selected as study project. In order to demonstrate the effectiveness of the composite utility method, we use the combined RP/SP data to predict mode share and compare the result with the single SP data prediction result as well. We first collected the RP data including the results of traveler’s choice on the corridor, and then, we took a survey about the travelers’ preference suggesting the subway in service on the corridor.
RP data
RP data contain traveler’s realistic travel choice between Chengdu and Longquan, and their demographic and socioeconomic attributes. Our survey targets are residents who live in Chengdu and Longquan. The random sampling method is used to investigate the targets and obtain 550 replies (545 valid respondents). The RP data reflect travelers’ actual choice behavior among the four travel modes which are coach, bus, private car, and taxi. The average monthly income of these respondents is ¥4112, the male–female ratio is 1.02, and the average age is 33 years. It is shown that the travelers choose bus and private car as their primary travel mode, according to the RP questionnaires.
SP data
SP questionnaires record the travelers’ preference for new subway service between Chengdu and Longquan. The questionnaire is designed based on orthogonal design which can maintain the orthogonality among these alternative attributes and avoid multicollinearity problem causing the model estimation error. There are five alternatives, including coach, bus, private car, taxi and subway, and their attributes and attributes level values are shown in Table 1. (Arrival time means the travel time from home to station.) The definition of attributes level is set based on real value to avoid the dominant alternative in combinations. The SP survey requires interview respondents, with 410 samples in total and 1600 valid observed data, with a monthly average income ¥4135, male–female ratio 1.03, and average age of 34 years.
Alternative and its attribute level definition table.
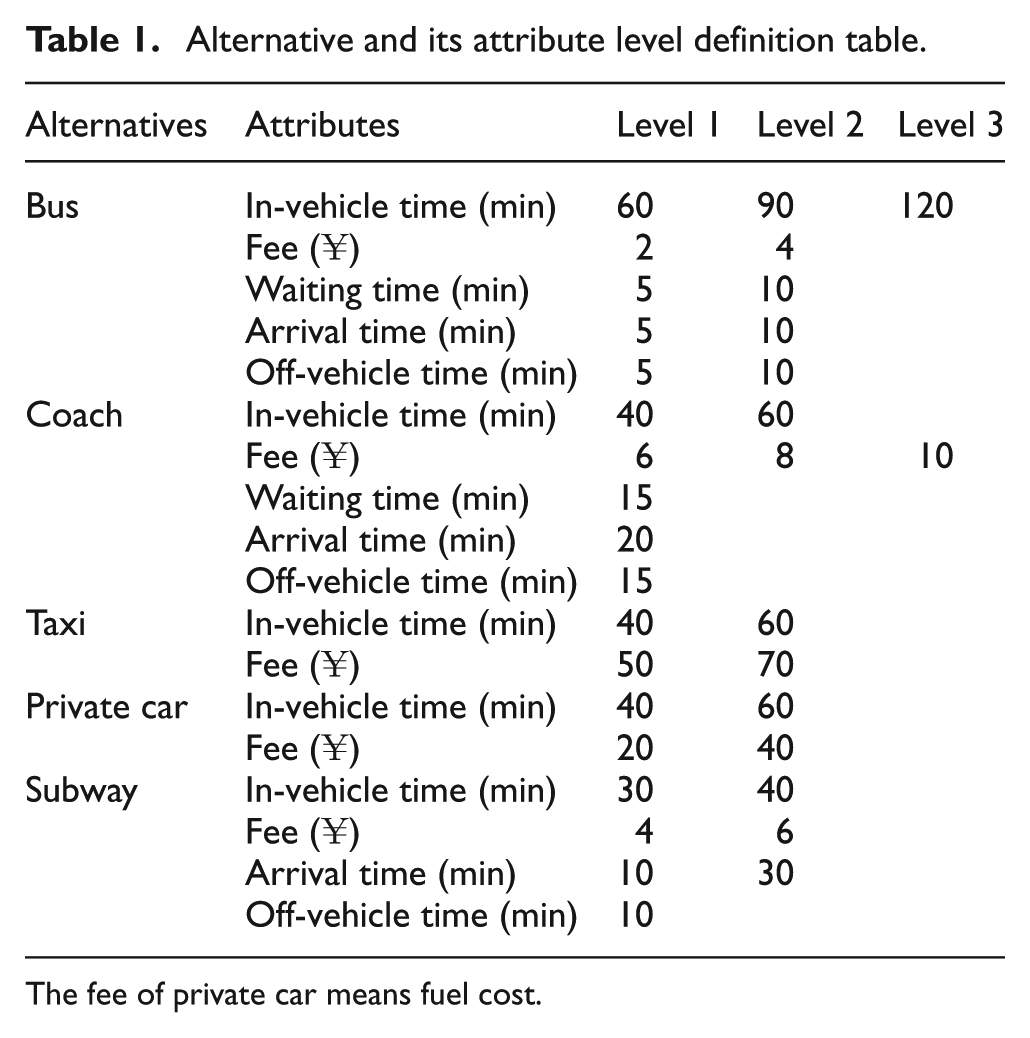
The fee of private car means fuel cost.
Model results
When building the models, we assume the socioeconomic attributes have the same impact on all travelers’ choice-making behaviors. We used NLOGIT to estimate the model parameter, and results are shown in Table 2.
Model parameter estimation by software NLOGIT.

RP: revealed preference; SP: stated preference. Model 3 (RP/SP), Model 4 (RP/SP with different structure tree).
Values in parentheses mean test value of parameter T.
According to Table 2, Model 1 reflects the realistic behavior of the travelers based on the RP data. Taking the Private car as alternative reference, the attributes of the alternative have the logic symbol. Except the off-vehicle time, other attributes are significant variables with |T| ≥ 1.96. It means that under 5% confident interval, the off-vehicle time has less impact on traveler’s choice behavior, and Chengdu–Longquan Corridor has good accessibility now. According to equation (12), the shares in the Chengdu–Longquan corridor are 8.9% by coach, 43.8% by bus, 5% by taxi, and 42.3% by private car. Model 2 is the result of parameter estimation based on SP data. Take the metro as alternative reference. The results show that all the parameters have the right symbols and the variables are significant except for the off-vehicle time and the waiting time. The most significant variables arrival time and in-vehicle time suggest that the convenience and fast-access should be improved in Chengdu–Longquan corridor. The comparisons between Models 1 and 2 suggest that SP data may introduce some prediction errors such as the waiting time and in-vehicle time. In fact, in Model 1, the waiting time has a significant impact on travelers, while the waiting time does not impact the traveler choice behavior. So, the SP data may cause some prediction errors and probably produce unreasonable results.
Model 3 is the RP/SP joint model parameter estimation results. The constants of alternatives are different in two kinds of data. The degree of significance for the in-vehicle time and the waiting time is only good in the single data. the off-vehicle time is not significant based on the single data. In order to test whether the combined data would help improve the degree of significant on parameter estimation results, the in-vehicle time and the arrival time were defined as generalized variables. According to the estimation results based on the single data, the arrival-vehicle time and the fee are significant in Models 1 and 2. Therefore, the arrival-vehicle time and the fee are defined to be different parameters in the combined data.
The result shows that generalized variables are more significant, while the off-vehicle time is still not significant. It means the off-vehicle time has small impact on travelers choice behavior. And there is better accessibility in the Chengdu–Longquan corridor. The relative variance µ is equal to 1 and is not significant in RP/SP joint model. It shows that there is no difference between the random errors variance of the RP and SP data, and the variance of error term is not relevant with the data source.
Model 4 is RP/SP joint model with another structure tree, as shown in Figure 2. The first level includes PT (public transit) and Car (taxi and private car). The IV parameter is 0.808 and it is significant, which means the alternatives in PT level are relevant. It is suggested that the variance of random error term in RP/SP joint model is relevant with the structure tree (the alternatives have been allocated), but not relevant with data source.
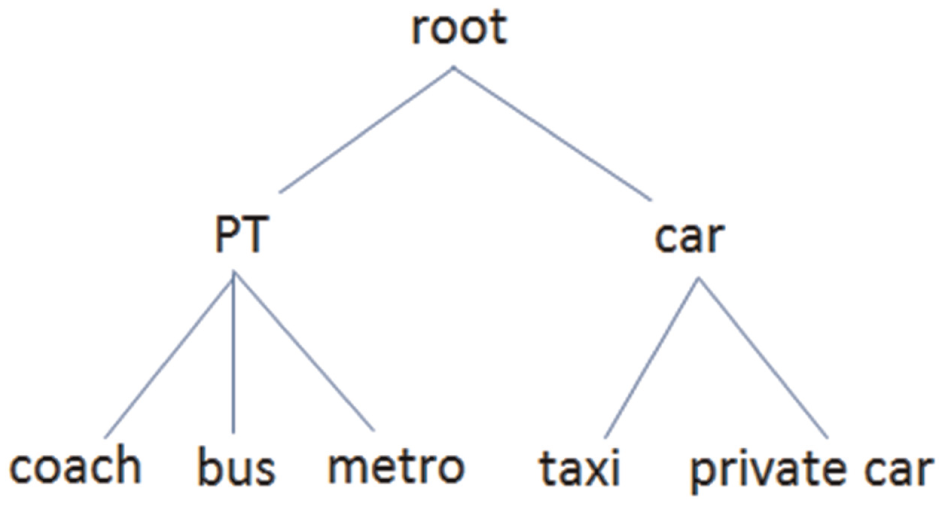
Nested Logit (NL) tree.
According to Model 3 result, RP/SP joint model can improve the degree of significance for the alternatives attributes and modify the inadequate side of SP data. However, there is contradiction of primary assumption in the RP/SP joint model: among different data, the variance of alternative random error term has non-relevance to data source, while the variance is relevant with the structure tree (the alternatives have been allocated). Therefore, the combined RP/SP is not universal.
The composite utility
The results of the model demonstrate that the RP/SP joint model does not have universal applicability. When there is a significant difference between the random error terms of alternative in different data, the RP/SP joint model can be used. We propose a universal method using RP data to modify the single SP data parameter estimation values to achieve the composite utility, overcome the disadvantages of single SP data.
The alternative constants in the RP data model reflect some unobserved factors which impact travel choice behavior and the market share of each alternative in the real market. The alterative constants based on the SP data cannot reflect these unobserved factors since SP data lack real restraints in the assumed scenarios.
So, we consider the alternative constants as unknown parameters to be re-estimated by RP data; at the same time, we assume other parameter estimations (able to estimate by the single SP data) are fixed. According to single SP data parameter estimation result, the utility function of alternatives is shown as follows

When utility function is linear structure, the constant of its utility function can be calculated from the following equation

Fixing the single SP data parameter estimation values of the alternative attributes and using the market share of each alternative based on RP data as weight, the alternative constants can be re-estimated. The composite utility is shown as follows

According to the composite utility function in equation (18), the choice probability of each alternative can be calculated. Thus, the market share of each travel mode in this corridor can be calculated through probability prediction method, as shown in Table 3.
Probability of travel mode choice.
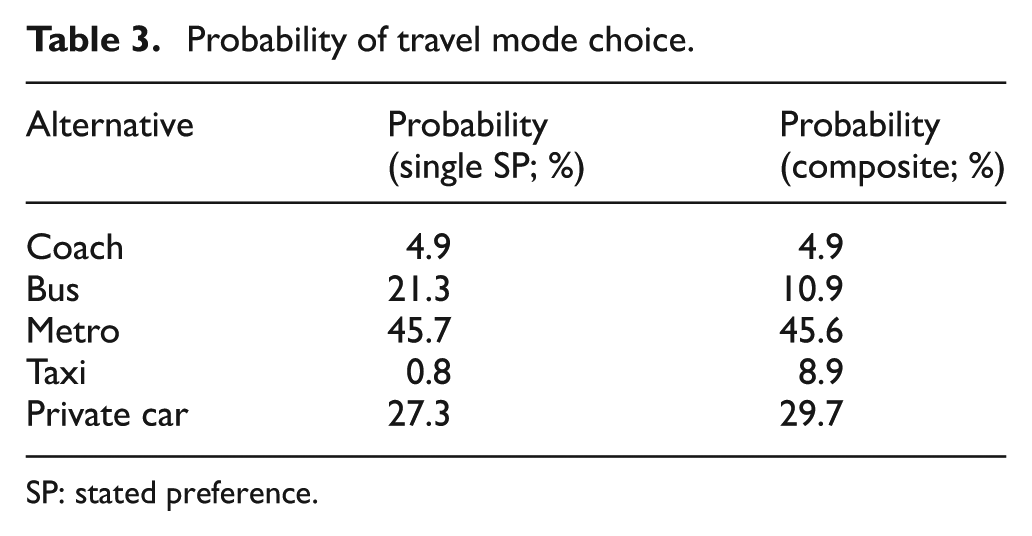
SP: stated preference.
Elastic analysis
The elastic analysis is used to compare the precision degree of forecasting between the composite utility function and the utility function of singe SP data. The elasticity is the change values of the choice probability of alternative if the key factors change the given values. The elasticity is calculated by the following equation 4

where equation (19) suggests the elasticity when attribute K of alternative i has marginal change; the alternative i is chosen by choice maker n with probability Pni. If all the parameters meet linear function, equation (19) can be simplified as equation (20), where βik is parameter of the variables Xnik

The in-vehicle time and arrival time are the two most significant factors in the model, and their elasticity is shown in Table 4.
Value of elasticity.
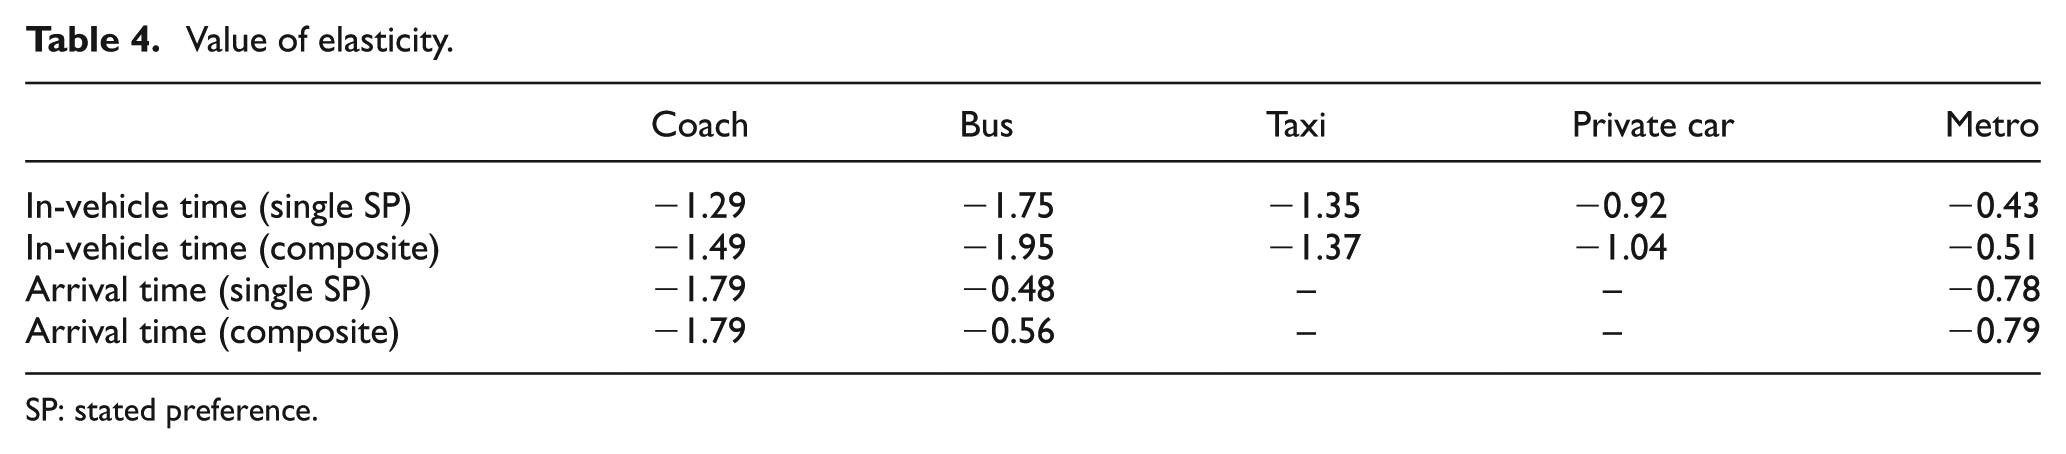
SP: stated preference.
The elasticity which represents the 1% change of key factor will cause many changes on the choice probability of the alternative. In Table 4, we can see that the in-vehicle time has the biggest influence on the choice probability of bus. When 20% and 50% of bus in-vehicle time and coach arrival time are decreased, the choice probability changing result is shown in Table 5.
Probability prediction.

SP: stated preference.
According to Table 5, we can see that the probability based on the RP/SP composite utility has smaller change than the single SP data. And when decreasing 50% of the bus in-vehicle time, the bus choice probability increased by 25.8%, and thus the bus choosing probability reached almost 50% in total, which is not reasonable. Therefore, we find the single SP data sometimes amplify the impacts of key factors, and cause prediction error while the composite utility considers real restraints that can limit this kind of errors.
In summary, the composite utility takes real restraint and traveler’s preference into account which can obtain more reasonable prediction result. The predicted travel mode shares after introducing subway into Chengdu–Longquan corridor are coach 4.9%, bus 10.9%, taxi 8.9%, private car 29.7%, and Metro 45.6%.
Conclusion
In this article, we studied the single SP data and combined RP/SP data to predict the Chengdu–Longquan corridor travel mode share. Single SP data–based prediction sometimes has unreasonable results like the impact of in-vehicle time. The elastic analysis also suggests that the single SP data may amplify the impact of key factors and cause prediction error. The combined RP/SP data–based prediction can improve the significance of models. However, there is no difference among the random error terms variance of alternatives in either RP or SP data. The variance of random error term is not relevant to data source, but relevant to the location where alternatives are allocated in the structure tree. The RP/SP joint model is not universal; only when there is a significant difference among the random error terms of alternative in different data, the RP/SP joint model can be used. And then, we proposed the composite function to combine the RP with SP data.
After modifying estimation results based on the SP data with the RP data, we use the composite function to predict the travel mode share on the corridor. We find the single SP data would cause prediction error, while the composite utility can obtain more reasonable prediction results by taking real restraints and traveler’s preference into account. The predicted result is 4.9% made up by coach, 10.9% by bus, 8.9% by taxi, 29.6% by private car, and 45.6% by Metro. The results show that the Metro will be the primary travel mode on Chengdu–Longquan corridor. The government is suggested to provide fast-access of public transit by making policy. And then travelers can be guided to choose public transit as a result of the improvement of convenience, thereby solving the traffic congestion problems on this corridor.
Footnotes
Academic Editor: Geert Wets
Declaration of Conflicting Interests
The author(s) declared no potential conflicts of interest with respect to the research, authorship, and/or publication of this article.
Funding
The author(s) disclosed receipt of the following financial support for the research, authorship, and/or publication of this article: This work was supported by the National Science Foundation of China under Grant Nos 50908195 and 51178403, the Fundamental Research Funds for the Central Universities (No. SWJTU11CX080 and No. 2682014CX130), Program for New Century Excellent Talents in University (NCET-13-0977), Key Laboratory of Road and Traffic Engineering of the Ministry of Education, Tongji University (No. K201207), Specialized Research Fund for the Doctoral Program of Higher Education (No. 20130184110020), Chengdu Science and Technology Bureau (No. 2014-RK00-00034-ZF), and Science & Technology Department of Sichuan Province (No. 2014RZ0037)