
Abstract
The aim of this study is to design a 4-degree-of-freedom linear-quadratic-Gaussian optimal controller for an active suspension to improve cargo integrity, under the condition of no loss of other properties. The analytic hierarchy process was used to reasonably determine the index weight, and simulation models of active and passive suspension systems were developed in the MATLAB and Simulink environment. By analyzing the time- and frequency-domain characteristics that are affected by suspension control, we observed that cargo integrity was effectively improved by the active suspension, and the road friendliness, ride comfort, and handling stability were also improved to some extent.
Keywords
Introduction
Truck transport plays an important role in logistics and transport. But during the cargo transport, due to poor road conditions, the cargo damage problem is increasingly prominent. And it is difficult to ensure the goods’ quality. The cargo integrity refers to the performance that the goods are not destroyed in transport process. So, one common goal of transport owners is to reduce the cargo damage by improving operational quality. 1 Research shows that ride comfort, 2 road friendliness, 3 and handling stability 4 can be improved by reasonably controlling vehicle suspension. Based on the need to improve truck transport, researchers have designed a variety of control strategies, such as modified skyhook damping (MSD) control, optimal control, sliding mode control, preview control, and fuzzy control.5–7 The linear-quadratic-Gaussian (LQG) optimal control algorithm, which has a quadratic performance index, is relatively mature, and its theoretical foundation is better than that of other control methods. However, the LQG control for the suspension is mostly designed for ride comfort and road friendliness, and cargo integrity is rarely taken into consideration. 8 When the general control of the vehicle suspension is designed, the centroid vertical acceleration and pitch angular acceleration are considered, and the cargo integrity is also partially maintained. Conversely, controller design, in which the centroid of vehicle is considered instead of the center of gravity of the cargo, error must exist because these positions differ from each other.
The actual requirements of ensuring cargo integrity are taken into account in this study, along with occupant comfort, road friendliness, and a number of other factors. The vertical acceleration of the center of gravity of the cargo is used as a control variable to characterize the cargo integrity, and a 4-degree-of-freedom (4-DOF) active–passive suspension system dynamic model for heavy-duty vehicles is established. Additionally, an LQG controller for the active suspension based on the cargo integrity is designed. Time–frequency domain simulation analysis and verification are performed on the active suspension system to determine the control effects and provide new ideas for the design of the vehicle’s active suspension controller.
Active suspension model
The vehicle suspension system is a multi-input/output system. To conveniently model the system and more accurately describe the actual vehicle driving conditions, a 1/2-scale vehicle model for a heavy-duty truck with 4-DOF is established, 9 as shown in Figure 1.

Vehicle active suspension model.
In Figure 1, mb is the body mass; muf and mur are the masses of the front and rear wheels, respectively; Ib is the body roll inertia; θb is the body pitch angle; Uf and Ur are the front and rear suspension active control forces, respectively; ksf and ksr are the front and rear suspension spring stiffness coefficients, respectively; ktf and ktr are the front and rear tire stiffness coefficients, respectively; x1 and x3 are the vertical displacements of the front and rear wheels, respectively; x2 and x4 are the front and rear vertical displacements of the body, respectively; x01 and x02 are the front and rear road excitations, respectively; a, b, and c are the distances from the front axle, rear axle, and centroid of the cargo to the center of gravity of the vehicle, respectively; and xb is the vertical displacement of the vehicle centroid.
According to Newton’s second law, the dynamic differential equation for the active suspension is

where
For small changes in θb
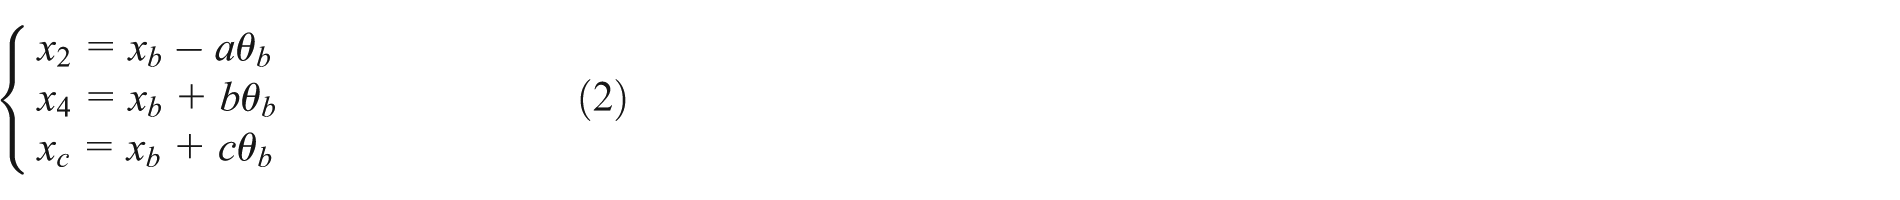
When xb and θb are eliminated from equation (2),
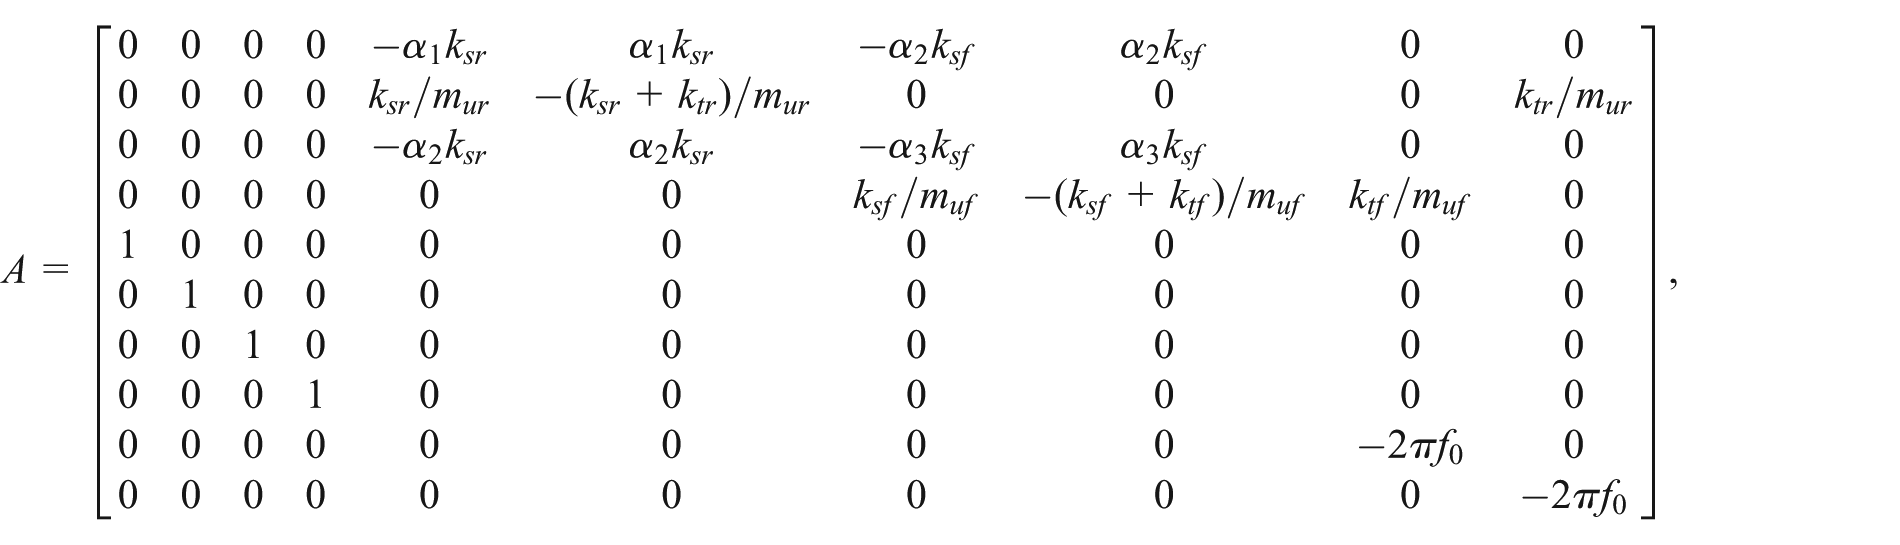
According to modern control theory, the state-space equation of an active suspension system

The same method is used for the passive suspension system model. Uf and Ur are replaced with
There are many methods of modeling the road roughness in the time domain, such as the harmonic superposition, integral white noise, filtered white noise, and autoregressive (AR) methods. Of these methods, the filtered white noise method has clear definitions and is widely used, and thus, it is used in this article. 5 The differential equation defining this model is

where x01 and x02 are the front and rear road roughness displacements, respectively; G0 is the road roughness coefficient; ν0 is the vehicle speed; w1 and w2 are the front and rear zero-mean Gaussian white noise signals, respectively; and f0 is the lower cutoff frequency.
Optimal controller design
Vehicle suspension design is generally focused on ride comfort and road friendliness, but cargo integrity in truck transport should not be ignored. The goal of the suspension design in this article is to obtain improved cargo integrity in addition to road friendliness and ride comfort. Therefore, the primary performance indicator is the vertical acceleration of the cargo, which should be as small as possible.
In addition, the dynamic load between the wheels and pavement is related to road friendliness, so it should also theoretically be as small as possible. However, this load also affects the adhesion between the wheels and the pavement, which is related to handling stability, so it cannot be too small. Therefore, considering both road friendliness and handling stability, the dynamic load should be kept within a reasonable range. Suspension deflections are related to the place of limited block that mismatching will hit the block and lessen the ride comfort. Moreover, the amount of control should be minimized from the perspective of control.
For designing the controller more conveniently and scientifically, the vertical acceleration of cargo gravity center
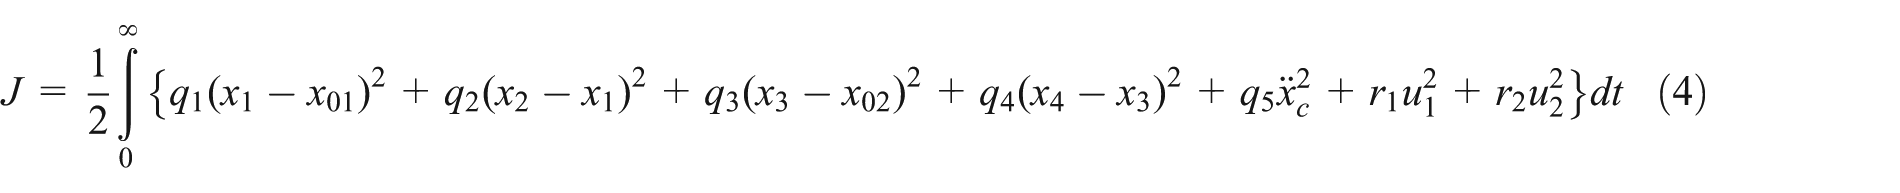
where, q1, q2, q3, q4, and q5 are weighted factors of performance control index, and r1 and r2 are weighted factors of control variable, which can be selected according to the actual needs. When the control vector
where
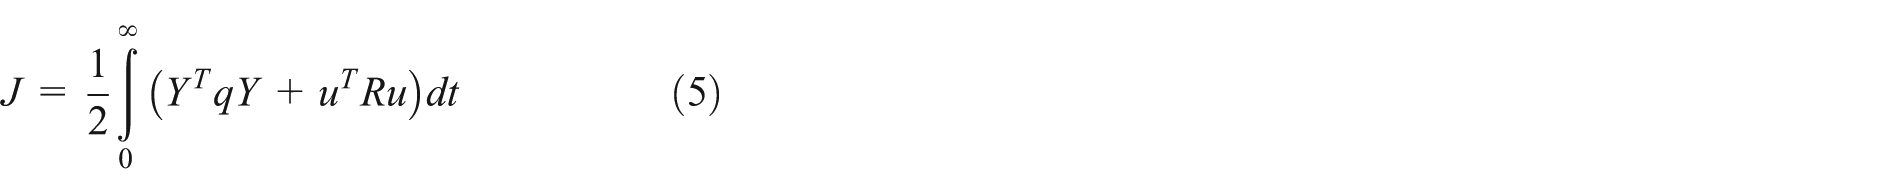
According to the state equation for the active suspension system, when these indicators are given as outputs, the output equation

And
The index functional theory can be further transformed into

where Qc is the weighted state variable matrix, defined as
Determining weighted coefficients
Controller performance is greatly affected by weighted performance factors. And the index weights are usually determined by trial-and-error method. Therefore, the vehicle comprehensive performance is very poor. In order to overcome the problems of low efficiency and poor accuracy of traditional methods, the analytic hierarchy process (AHP) method is presented.
In this article, to determine the weighted coefficients of the performance indices, first, the dimensionless differences between each index are eliminated, and the proportion factor to scale them equivalently (same-scale proportion coefficient) is determined. Then, the AHP is used to assign a subjective weight to each index. Finally, the same-scale proportion coefficient is combined with the subjective weighted index values, and the final weight coefficients for each index are obtained. 11
Determine the same-scale proportion coefficient of each evaluation index
Because there are large differences in the units and magnitudes of the acceleration of the center of gravity of the cargo, tire deformation, and suspension deflection, the values must be appropriately quantitatively scaled. The root-mean-square (RMS) values for each performance indices

Determine the subjective weighted proportion coefficient of each index
The tendencies of different designers are subjective and can be determined by weighted proportion coefficients. In this article, AHP is used to assign a subjective weight to each performance index. The basic procedure is given as follows.
First, a subjective evaluation is performed to determine the relative importance of the index, and a judgment matrix H is established. Then, the square vector M of each row of elements in matrix H is calculated, and the nth root vector W of the calculated square vector M is obtained. Finally, the regular vector
Determine the final weighted suspension LQG control coefficient
The weighted proportion coefficients of the indices are assumed to be γ1, γ2, γ3, and γ4. Combining the same-scale proportion coefficient and subjective weighted proportion coefficient, the final weighted coefficients are determined according to the formula
Suspension system simulation
Simulation model
The parameters of the JN150 truck are used for the prototype in this study, 13 and active and passive suspension system dynamic simulation models are established using MATLAB and Simulink software, as shown in Figure 2. The simulation parameters are given in Table 1. Assuming the vehicle is traveling on a B-class road at G0 = 64 × 10−6 m3/cycle and a frequency off0 = 0.1 Hz, the speed is v0 = 70 km/h (20 m/s). The method based on AHP is used to obtain the final weighted index coefficients: q1 = 27,957, q2 = 2112, q3 = l8,043, q4 = 2596, and q5 = 1.

Active and passive suspension system dynamic simulation model.
Suspension system simulation parameters.

Analysis of simulation results
Impact of suspension control on cargo integrity
As shown in Figure 3(a), the vertical acceleration of the center of gravity of the truck can be effectively reduced by the active suspension from 10 to 5 m/s2. As shown in Figure 3(b), the vibration modes for the vertical acceleration of the center of gravity of the cargo at low frequencies, such as 1–5 Hz, are effectively inhibited by the active suspension. The largest decline occurs near a solid body vibration frequency of 1.4 Hz. The acceleration for the active suspension is slightly larger near 11.1 Hz, and in other frequency bands, the acceleration spectrum value of the active suspension was essentially equivalent to that of the passive suspension. Because of the important principle of random vibration isolation, which minimizes the amplitude characteristics of a vibration isolation system in the low-frequency range, we can say that the truck cargo integrity is improved and the control objectives are achieved by the active suspension.

Vertical acceleration of the center of gravity: (a) time-domain simulation curve and (b) frequency-domain simulation curve.
As shown in Figure 4, the driver’s comfort was also improved to a certain extent. Comparing Figures 3 and 4, it can be seen that the change in the vertical acceleration of the driver’s seat is similar to that of the center of gravity of the cargo. The similarity in these changes is particularly clear from the power spectrum curves, which are essentially the same in shape and differ only in value, because, by and large, there is a linear relationship between the acceleration of the driver’s seat and that of the center of gravity of the cargo. When a substantial body vibration occurs, the linear assumption will not hold. Thus, when the cargo integrity is roughly considered, the linear acceleration of any point on the body can be used. Conversely, the acceleration of the center of gravity of the cargo should be considered separately under detailed analysis.

Vertical acceleration of the driver’s seat: (a) time-domain simulation curve and (b) frequency-domain simulation curve.
Effect of suspension control on road friendliness
Pavement damage is closely related to tire dynamic load because dynamic tire forces accelerate pavement damage. As shown in Figure 5, the tire dynamic load can be effectively reduced by the active suspension system. As shown in Figure 6, the tire dynamic load decays more abruptly in the low-frequency (solid body vibration frequency near 1.4 Hz) and high-frequency (solid body vibration frequency near 11.1 Hz) regions.

Time-domain simulation curve of tire dynamic load: (a) front tire dynamic load and (b) rear tire dynamic load.

Power spectrum of tire dynamic load: (a) front tire dynamic load and (b) rear tire dynamic load.
There are three kinds of common evaluation index for vehicle road friendliness, such as dynamic load coefficient (DLC), road stress factor (RSF), and Jm (road damage coefficient, which is also called as 95th percentage fourth power aggregate force). 14 Jm is more scientific and reasonable than DLC and RSF because it considers the correlation between front and rear tires and the spatial repeatability of dynamic tire force distribution along the track. So it is used as the road-friendliness criterion for analyzing the road friendliness of these two suspension models. The formula of Jm is given by

where
This result reveals that when using active suspension, road friendliness for the front and rear tires increases by 33.6% and 39.1%, respectively, in comparison with passive suspension; thus, road friendliness is improved by the active suspension, which is in line with the controller design goals.
Effect of suspension control on handling stability
In the running process, suspension deflections available are certain for the influence of the place of limited block. As shown in Figure 7, the front and rear dynamic deflections of active suspension are within ±0.05 and ±0.04 m, respectively, and those for the passive suspension are within ±0.1 m. The passive suspension deflections are almost twice those of the active suspension. Thus, using the active suspension, the dynamic deformation of the suspension is effectively controlled, the possibility of hitting the stock is reduced, and good driving stability is maintained.

Time-domain simulation curve of suspension dynamic deflection: (a) front suspension and (b) rear suspension.
The adhesion between the wheels and the pavement is affected by the dynamic displacement, so the dynamic displacement must be kept within a reasonable range. As can be seen from Figure 8, the tire vertical run-out for passive suspension is within ±0.025 m, which is too large, whereas the tire vertical run-out for the active suspension is within ±0.01 m, which is reasonable. Thus, using the active suspension, severe beating of tires is reduced, and vehicle handling and stability are improved.

Time-domain simulation curve of tire adhesion: (a) front tire adhesion and (b) rear tire adhesion.
Comparison of statistical values of vehicle performance parameters
The RMS value of vehicle performance parameters was used to analyze and compare the passive and active suspension, as shown in Table 2. It can be seen from the table that, under the above simulation conditions, when the controller has the optimal weight coefficients, the RMS values of vehicle performance parameters, such as vertical acceleration, dynamic load, and suspension dynamic deflection, are all improved by more than 30%. And with other optimal weight coefficients, the active suspension performance can increase in different degrees which have been verified by us.
Comparison of performance parameters of vehicle.

Conclusion
A 4-DOF active suspension model of heavy-duty truck was established. An LQG optimal controller for the active suspension was designed to improve the cargo integrity, and the AHP was used to determine the weighted index for each performance metric so that the designed controller is more scientific, rational, and universal.
Time–frequency simulation analysis was performed to evaluate the performance of the active and passive suspension systems. The results showed that the vertical acceleration of the center of gravity of the truck can be effectively reduced by the active suspension and cargo integrity can be improved. In addition, the driver comfort, handling, stability, and road friendliness were improved to some extent.
The weighted indices can be adjusted to meet the requirements of different control objectives by the LQG controller according to actual needs. Thus, the controllable suspension may improve not only the road friendliness and comfort of heavy-duty trucks but also the cargo integrity, which is an important goal of future development of heavy-duty trucks.
Footnotes
Academic Editor: Teen-Hang Meen
Declaration of Conflicting Interests
The author(s) declared no potential conflicts of interest with respect to the research, authorship, and/or publication of this article.
Funding
The author(s) disclosed receipt of the following financial support for the research, authorship, and/or publication of this article: The authors would like to thank Education Department of Jiangsu Province (sponsored by Qing Lan Project), the Doctoral Fund of Ministry of Education Subject (20120092110044), and Science and Technology Department of Henan Province (sponsored by 2015 key scientific and technical problems, 152102310255).