
Abstract
This work proposed a non-contact video-based measurement for transverse displacements of hoisting catenaries in mine hoist using mean shift tracking. Hoisting catenaries are typically moving cables making it impossible to use traditional methods. To obtain the transverse displacements of an arbitrary point in the hoisting catenary, a guide line that was perpendicular to the hoisting catenaries was inserted in the sequential images. Through tracking the dynamic intersection area by mean shift algorithm and then recording the location of the tracker, the transverse vibration displacements of the selected point in the hoisting catenary can be easily obtained. A theoretical model of transverse vibration of a catenary was established, and model validation was then conducted confirming the reasonability and applicability of the proposed method. Eventually, a laboratory experiment was also conducted and then confirmed the accuracy of the proposed method. This work is perfectly suitable for the measurement of moving cable vibration.
Introduction
In a floor-type multi-rope friction mine hoist as shown in Figure 1(a), hoisting catenaries are typically moving cables whose two ends are attached to the friction pulley and head sheaves, respectively. Due to inevitable circular degree or coaxial errors, axial fluctuations of head sheaves or friction pulley are thereby induced. And they in turn excite transverse vibrations of hoisting catenaries during the hoisting process as shown in Figure 1(b). Large amplitude transverse vibrations will even make two adjacent catenaries collide with each other and thus accelerate the rupture of ropes. 1 Therefore, to provide accurate vibration data for the analysis of large amplitude transverse vibrations of hoisting catenaries, on-site measurement is urgent to be performed.
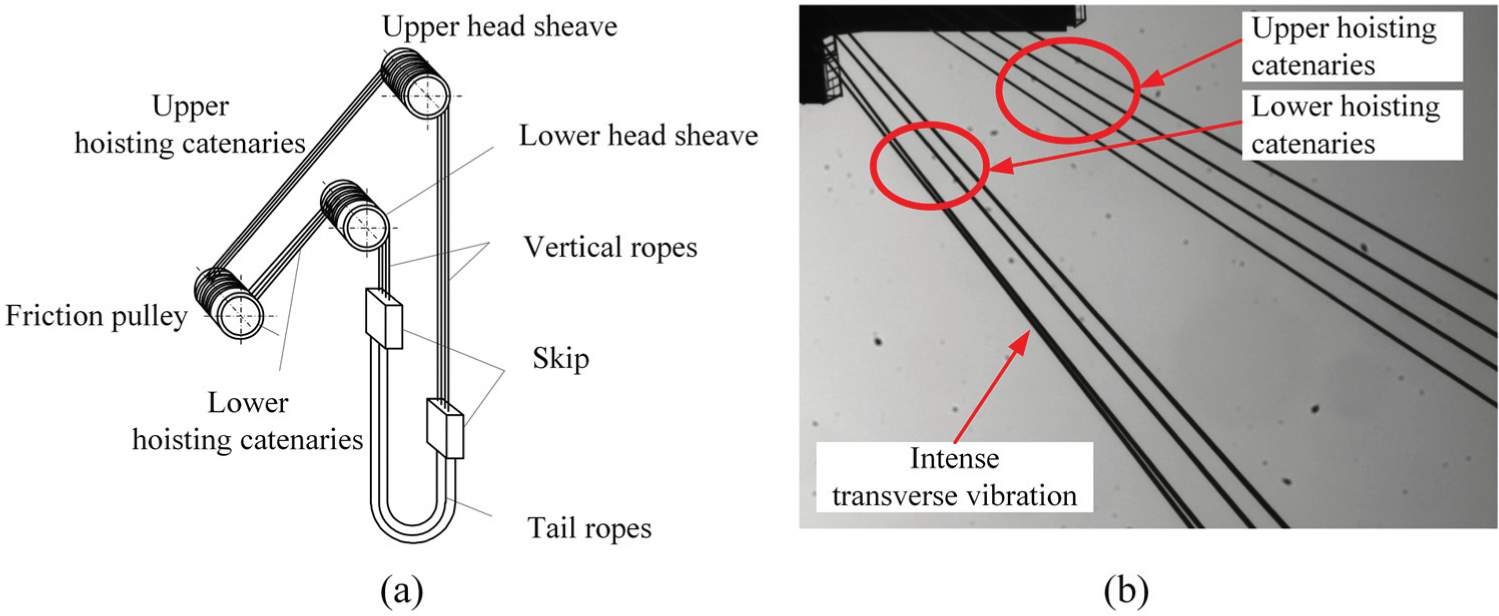
(a) Schematic diagram of a floor-type multi-rope friction hoist in coal mine and (b) an original captured image indicating intense transverse vibrations in the lower hoisting catenaries.
The hoisting catenaries are typically one-dimensional moving structures. And the corresponding theoretical researches concerning moving structures have been done extensively in recent years. Karimi and Ziaei-Rad 2 have analysed non-linear coupled vibration of a beam with moving supports under the action of a moving mass. Ghayesh and colleagues3,4 have investigated the non-linear coupled longitudinal–transverse vibrations and stability of an axially moving beam. Kiani5,6 has studied the longitudinal, transverse and torsional vibrations and stabilities of axially moving carbon nanotubes. And the vibrational properties of axially moving single-walled carbon nanotubes with simply supported ends have been studied using non-local Rayleigh beam theory. Saksa et al. 7 have investigated the stability and dynamic behaviour of axially moving viscoelastic panels with the help of the classical modal analysis. Zhang et al. 8 have investigated the steady-state periodic response of an axially moving viscoelastic beam in the supercritical speed range. It can be obtained from the literatures mentioned above that the theoretical researches concerning the dynamic properties of moving structures have been deeply conducted by many scholars. However, the corresponding experimental investigation such as the measurement of transverse vibrations of moving structures has not been involved. Hence, it is of great significance to conduct the measurement of transverse vibrations of moving structures.
As far as the measurement of cable vibration is concerned, digital image processing technique has been developed as an excellent method to measure cable vibration. Kim and Kim 9 have measured the transverse displacements of suspension bridge hanger cables using a portable digital video camera, and they estimated the tension in hanger cables. To extract a set of modal parameters of a cable whose two ends were fixed rigidly, Kim 10 captured the motion picture using a digital camera and then proposed a multi-template matching algorithm to identify the centre of the targets attached to the cable surface. To measure small cable vibration, Ji and Chang 11 proposed an optical flow method which can be used to calculate variation of optical intensity of an arbitrary selected region of interest (ROI) on the cable image sequence and estimated the displacement of the ROI on the image plane.
Additionally, accelerometers have also been used to measure cable vibration. However, conventional accelerometers require a considerable amount of cabling work to facilitate a direct connection between the sensor and the data acquisition logger. 12 What is more, the laser Doppler effect method 13 and the GPS method 14 are relatively accurate methods to measure the transverse vibration of a cable whose two ends are fixed rigidly, but they are very uneconomical.
In the measurement of transverse vibrations of hoisting catenaries which are typically moving cables, it is impossible to attach predefined targets to the surface of a hoisting catenary. Then, it is difficult to identify the monitoring point whose transverse vibration displacements are to be measured. Compared with the already methods for the measurement of cable vibration mentioned in the above literature studies, the engineered novelty of this article is to measure the transverse vibration displacements of an arbitrary point in a moving cable. A video-based measurement using mean shift tracking without attaching any real target is presented.
Measurement principles
A greyscale original image captured by a high-speed camera is shown in Figure 1(b). It can be seen from Figure 1(b) that the colour of the pixel of the background, which is single and constant, predominantly distinguishes from that of the hoisting catenaries. In this study, the goal is to obtain the transverse vibration displacements of an arbitrary point in a hoisting catenary. Hence, the mean shift algorithm, which is perfectly suitable for target tracking in a single and constant background, was adopted in this work to measure the transverse vibrations of the hoisting catenaries in coal mine.
Theory of mean shift tracking
The mean shift tracking algorithm is a semi-automatic target tracking algorithm. First, to obtain the descriptions of the target model and the candidate, the probabilities of characteristic value of the pixels in the target region and the candidate should be calculated; then, the similarity measure between the target model and the current candidate should be conducted using a similarity function; eventually, a mean shift vector, which is a vector indicating the motion of the target from the original location in the previous frame to the new location in the current frame, should be obtained by selecting the candidate model with a maximum similarity value. Due to the fast convergence of mean shift algorithm, the object tracking can be easily achieved by iteratively calculating the mean shift vector. 15
Figure 2 shows the principle of mean shift tracking. In Figure 2, the dotted circle denotes the tracking window that is used to conduct density estimation. The red empty circles x 0, x 1,…, x n are the centre points of the tracking regions, and point x 0 is the original point. The superscript denotes the number of iterations, and the surrounding black points represent the sample points in the moving tracking window. The red arrow represents the mean shift vector which always points towards the direction of the maximum increase in the density. 16 Due to the convergence of the mean shift algorithm, a path leading to a local density maximum can be defined by iteratively searching the region where the sample points are the densest in the current frame. Consequently, the target location in the current frame (x n) can be identified.
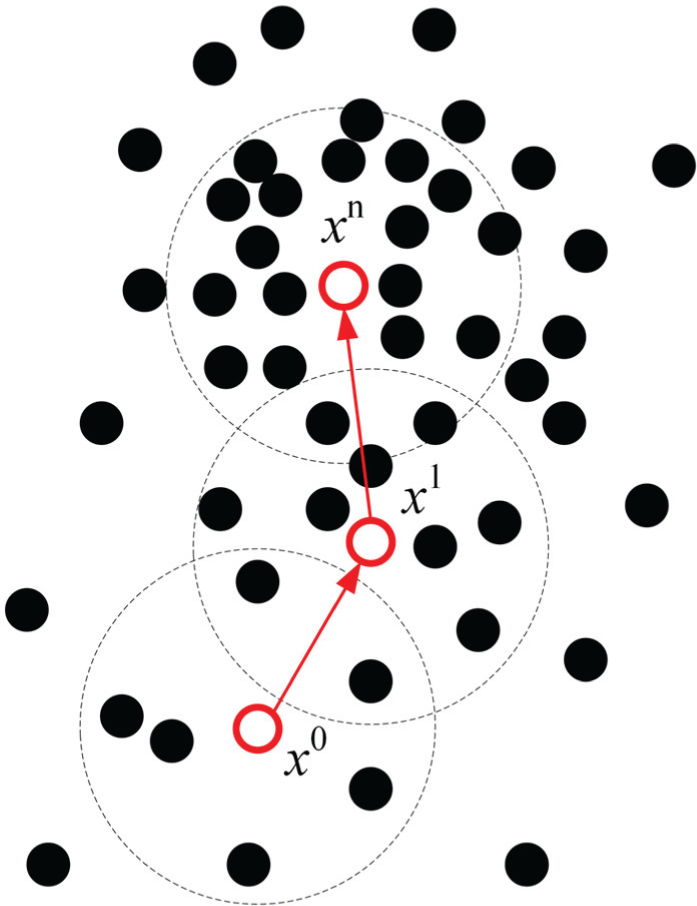
Principle diagram of mean shift tracking.
Description of the target region
An initial region including the tracking target should first be selected by the mouse in the start frame of the image sequence. Grey histograms are used as target models for they can achieve robustness against non-rigidity and partial occlusion. 17 The histogram is not the best non-parametric density estimate, but it suffices for our purposes. Hence, the grey distributions are discretized into m = 256 bins. The probability density of the target model (q (u) (u = 1,…, m)) can be expressed as18,19
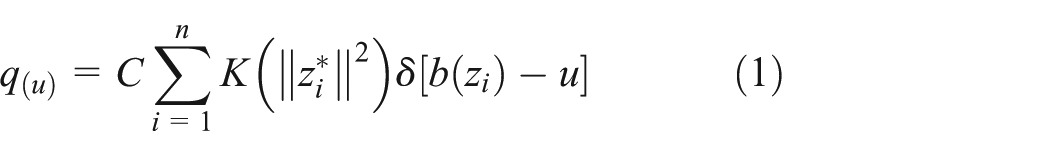


where C is the normalization factor; K is the Epanechnikov kernel assigning smaller weights to pixels farther from the centre;
20
n is the number of pixels in the region, (xi, yi
) and (x
0, y
0) are the coordinates of the arbitrary and centre points in the target region, respectively;
Description of the candidate region
The region including the possible target in the tth (t > 1) frame is called the candidate region. Dealing with the tth frame, the location of the centre of the target in the (t − 1)th frame (

Similarity measure
The level of similarity between the target model and the candidate can be described by a similarity function. The Bhattacharyya coefficient, which is a popular measure between the two distributions p (u) and q (u), can be defined as 21

The larger the ρ, the more similar the two grey histograms. ρ = 1 indicates a perfect match of the two identical regions. And a distance between the target model and the candidates is defined as 22

Target localization
Searching a new target location in the current frame starts at the location


To find the location corresponding to the target in the current frame, the distance (equation (7)) should be minimized as a function of

where g(x) = −K′(x), the superscript denotes the derivative.
Applications
Image acquisition
In this study, a high-speed and easy-to-install camera, which does not need any additional cable installation, was rigidly placed beneath the moving hoisting catenaries on the ground as shown in Figure 3. The test was carried out on the multi-rope friction hoist in Yaoqiao coal Mine of Shanghai Datun Joint Co. Ltd. During the hoisting process, the high-speed camera equipped with a telephoto lens and a sampling rate of 1000 frames/s was used to capture sequential images that were digitalized at 768 × 1024 8-bit pixel resolution. Due to axial fluctuations of head sheaves or friction pulley in multi-rope friction mine hoists, the transverse vibrations of hoisting catenaries are predominantly along the y-axis in plane as shown in Figure 3.

Measurement of transverse vibrations of hoisting catenaries in mine hoist.
Initialization
The first frame of the captured sequential images, where the hoisting catenaries were on the static equilibrium position before the mine hoist began to operate, is shown in Figure 4. The captured images are greyscale images. In this case, the aim is to measure the transverse vibration displacements of an arbitrary point in the hoisting catenary. However, the hoisting catenaries are axially moving continua making it difficult to capture a distinguishing feature. Hence, a guide line which is perpendicular to the four hoisting catenaries was inserted in the image sequence as shown in Figure 4(a). In this article, lower hoisting catenary 3 was adopted as the study object, and a rectangular region was placed on the intersection area of lower catenary 3 and the guide line. The rectangular region in the first frame of the captured sequential images is the target tracking region whose four vertexes are located at point c(514,672), point d(514,692), point e(540,672) and point f(540,692). Subsequently, the location of the centre point of the target tracking region can be determined at point g(527, 682). And the kernel-bandwidth h, which means the distance from the vertex to the centre point of the rectangular tracking region, can be determined as 16.4 pixel distance. The corresponding grey histogram of the target tracking region is demonstrated in Figure 5.

Initialization in the start frame: (a) the global image and (b) the local image.
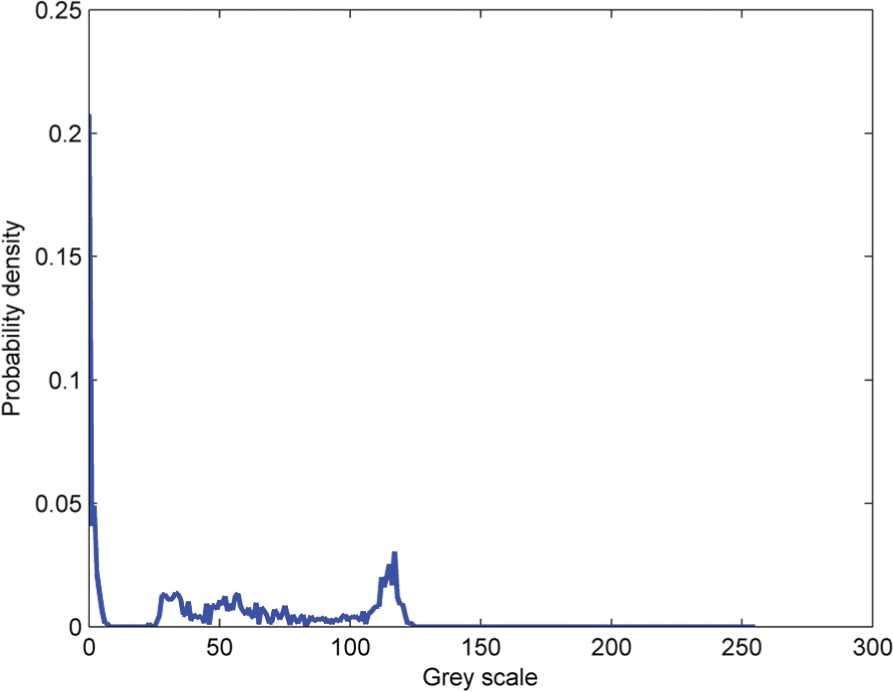
Grey histogram of the target tracking region.
To calculate the actual vibration displacement of the catenary, it is imperative to obtain the scaling factor λ. The length of line ab is relative to the rope spacing which is a constant value of 350 mm. The coordinates of points a and b are (544,747) and (650, 718), respectively. Therefore, their pixel distance can be calculated as 109.9, and the scaling factor λ in this study can be calculated as 3.18 mm/pixel.
To obtain the actual location of tracking target in each frame of the image sequence, the tracking steps of mean shift algorithm are summarized as follows:
Step 1: calculate q(u) (u = 1,…, m), the probability density of the target region in the previous frame, and estimate the location
Step 2: initialize the location of the target in the current frame with
Step 3: according to equation (9), calculate wi , the weights of each pixels in the current candidate region.
Step 4: according to equation (10), calculate
Step 5: if
The threshold ε used in step 5 is derived by constraining the vectors
According to the tracking steps mentioned above, employing MATLAB, the movement of the intersection area of lower catenary 3 and the guide line was tracked as shown in Figure 6. It is apparent from Figure 6 that mean shift tracker can well capture the dynamic intersection area during the vibration process. And the location of the tracked intersection area in each frame is specified by (xi, yi ), where i denotes the ith frame. The sampling rate of the high-speed camera in this case is fs = 1000 frames/s. Hence, the actual transverse vibration displacements of the measured point in lower catenary 3 can be formulated as

where m is the mth frame. Applying equation (11), the transverse vibration displacements of the selected point in lower catenary 3 can be easily obtained. Eventually, the obtained data can be used for the analysis of the transverse vibrations of the hoisting catenaries in mine hoist.

Tracking process of the intersection area: (a) 1st frame, (b) 12,000th frame, (c) 16,000th frame, (d) 17,000th frame, (e) 24,000th frame and (f) 26,000th frame.
Model validation
Theoretical model
To describe the transverse vibrations of hoisting catenaries, a fixed coordinate system oxy is established as shown in Figure 3. The friction pulley is modelled as a fixed-centre pulley, and the singular head sheave is modelled as a point subjected to axial fluctuating displacement specified by e(t), where t is the hoisting time. The transverse displacement of the catenary in the position x at time t has been derived in our previous work, 1 and it can be expressed as

where


in which Lc is the length of the catenary; T is the axial tension of the catenary; a(t) and v(t) are the hoisting acceleration and velocity, respectively; and ρ and EA are the linear density and tensile stiffness of the hoisting rope, respectively.
Validation
Under the condition of no load, employing the video-based method proposed in this article, the transverse displacements at the centre of the lower catenary 3 in Figure 4 were obtained as shown in Figure 9(a). During the measurement of transverse displacements of the lower catenary 3, the axial fluctuating displacements of lower head sheave 3, which act as the external excitations of the transverse vibrations of lower catenary 3, were recorded by inductive displacement transducer as shown in Figure 7. The inductive displacement transducers fixed in the retainer were adjusted to face the outer rim of the sheaves. And the axial fluctuating displacements of the lower head sheave 3 were recorded as shown in Figure 8.

Measurement of the axial fluctuating displacements of head sheaves.

Axial fluctuating displacement t of the lower head sheave 3.
To verify the accuracy of the transverse displacements by the proposed video-based method, the dynamic responses of the theoretical model were calculated. The corresponding parameters used were Lc = 43.74 m, ρ = 7.86 m/s, EA = 1.5246 × 10⁸ N/m, T = 105,000 N, a(t) = 0 and v(t) = 9.36 m/s. The truly measured external excitation displacements shown in Figure 8 are adopted as the inputs of equation (12) to calculate the transverse vibration displacements of the lower catenary 3, and the transverse vibration displacements at the centre of the lower catenary 3 from the model output are demonstrated in Figure 9(b). It can be seen from Figure 9 that the maximum peak value of the vibration displacement from the model output (162 mm) is much close to that from video-based method (161.2 mm). Most important of all, the shape of the vibrating waveform from video-based method in Figure 9(a) is well consistent to that from the model output in Figure 9(b). The difference may result from model errors, which are acceptable in this case. Therefore, it can be concluded that the video-based method proposed in this article can be reasonably and accurately applied to the measurement of transverse vibrations of moving cables.

Displacement–time histories at the centre of the lower catenary 3: (a) video-based method and (b) model output.
Experimental validation
To validate the accuracy of mean shift tracking in the measurement of transverse vibrations of moving cables, a laboratory simulation experiment was also carried out. As shown in Figure 10(a), a high-speed camera and a laser displacement sensor were simultaneously applied to measure the vibration displacements of the piezoelectric acceleration transducer. The piezoelectric acceleration transducer was rigidly installed on a vibration generator and commanded to move along the direction of gravity. The laser displacement sensor was rigidly fixed on a steel rule which can be employed to conduct data calibration, and its laser probe was made perpendicular to the upper horizontal surface of the piezoelectric acceleration transducer. The displacement signal of the laser displacement sensor was sampled by an analogue data acquisition card. Meanwhile, the high-speed camera with 768 × 1024 pixel resolution of images and sampling rate of 1000 frames/s was made plumb in the face of the acceleration transducer.

Laboratory set-up: (a) the overall arrangement and (b) the local captured image to be analyzed.
Considering the difficulty of conducting a contrast experiment that measures the moving cable vibration using a laser displacement sensor and a high-speed camera simultaneously, a white label with a black block was wrapped around the piezoelectric acceleration transducer as shown in Figure 10(b). The black block can be viewed as the intersection area of the catenary and the guide line shown in Figures 4 and 6. Through capturing the dynamic image sequence of the black block and using the mean shift tracking algorithm, the dynamic displacement of the black block can be easily calculated.
During the process of the experiment, the piezoelectric acceleration transducer was subjected to an external sinusoidal acceleration excitation from the vibration generator. The excitation acceleration amplitude and the excitation frequency were set to 4 m/s2 and 10 Hz, respectively. The displacement–time histories of the black block obtained from the laser displacement sensor and the camera are shown in Figure 11(a). It can be seen that the two obtained displacement–time curves are well consistent. Figure 11(b) shows the amplitude spectra of the two displacement–time histories. It can be seen from Figure 11(b) that the main vibration frequency component from mean shift tracking with a frequency of 10 Hz and an amplitude of 0.97 mm is almost equivalent to that from the laser displacement sensor with a frequency of 10 Hz and an amplitude of 0.96 mm. The discrepancies between the reported results based on the video-based method and those obtained by the laser method may result from the scaling factor that is the ratio of actual distance to pixel distance. A smaller scaling factor in the video-based method will contribute to a higher accuracy results. In addition, inevitable errors such as algorithm error and calculation error will also induce the discrepancies between the two reported results. However, in this case, a reasonably good agreement of the two obtained results by the video-based method and the laser-based measurement has been achieved, and the tiny discrepancies can be acceptable. Therefore, considering the high accuracy of laser displacement sensor, 11 the comparative results directly validated the accuracy of mean shift tracking in measuring the dynamic displacement of the black block. Because the black block on the accelerometer was used to simulate the dynamic intersection area in Figures 4 and 6, the experimental results indirectly confirmed the validity of mean shift tracking in the dynamic measurement of transverse vibrations of hoisting catenaries in mine hoist.

(a) Displacement–time histories of the black block on the accelerometer and (b) amplitude spectra of the two obtained vibration signals.
Conclusion
Hoisting catenaries in a multi-rope friction mine hoist are typically moving cables making it impossible to attach predefined targets to the surface of the hoisting catenary and difficult to obtain the transverse vibrations of an arbitrary point in the hoisting catenary according to a distinguishing feature. To solve this problem, a video-based measurement using mean shift tracking was proposed. The captured sequential images were greyscale images. The colour of the pixel of the background, which was single and constant, predominantly distinguished from that of the line-shape hoisting catenaries in the sequential images, making it suitable to use mean shift tracking. To obtain the transverse displacements of an arbitrary point in the hoisting catenary, a guide line which was perpendicular to the hoisting catenary was inserted in the sequential images. Through tracking the dynamic intersection area and recording the location of the tracker, the transverse vibration displacements of the selected point can be easily obtained. A theoretical model of transverse vibration of a catenary was established, and model validation was then conducted confirming the reasonability and applicability of the proposed method. Eventually, a laboratory simulation experiment was also carried out and then confirmed the accuracy of the mean shift tracking in the dynamic measurement of transverse vibrations of hoisting catenaries in mine hoist.
This work provides a novel video-based measurement of transverse vibrations of line-shape targets, especially the moving cables such as hoisting catenaries in mine hoist or elevator system. Additionally, the proposed method will also be applicable to other deformation measurement of two-dimensional or even three-dimensional structures, such as the deformation measurement of panel. With the accurate vibration data provided by the proposed method, further research can be conducted to realize dynamic analysis and even engineering optimization.
Footnotes
Acknowledgements
The authors would like to thank anonymous reviewers for their constructive comments and thoughtful suggestions.
Academic Editor: Jia-Jang Wu
Declaration of conflicting interests
The author(s) declared no potential conflicts of interest with respect to the research, authorship and/or publication of this article.
Funding
The authors gratefully acknowledge the support of A Project Funded by the Priority Academic Program Development of Jiangsu Higher Education Institutions (PAPD).