
Abstract
Sediment transport and bed morphology at channel confluences with different confluence angles and discharge ratios are analyzed through a series of flume experiments. Bed topography and sediment transport rate are measured and results are compared among different conditions. Sediment transport is intermittent and pulsating as the tributary flow mixes with the mainstream, and the sediment transport rate goes up with the increase in discharge ratio and confluence angle. With no sediment supplied from upstream of the flume, a central scour hole will form along the shear plane and develop toward the right bank, and the depth of the central scour hole increases as the confluence angle and discharge ratio increase. With heavy upstream sediment supplement, deposition will happen in the separation zone and upstream of the confluence area because of the tributary. And the deposition height is related to the discharge ratio and confluence angle. Results indicate the significant impact of confluence geometry, sediment, and flow factors on fluvial processes.
Introduction
River channel confluences form important morphological elements of every river system, being points at which rapid changes in flow, sediment discharge, and hydraulic geometry must be accommodated. The sediment transport and morphological variation are arguably the most dynamic parts of the fluvial system. The morphology of the river bed is constantly changing in response to unsteady sediment supply and sediment transport capacity. Experimental study was pioneered by Taylor, 1 in which different water depths and confluence angles of 45° and 135° were tested. Based on Taylor’s results, Weber et al. 2 proposed a theoretical model to estimate relative energy losses at cross sections. Lin and Soong 3 divided energy losses into two parts, that is, sidewall friction losses and turbulent mixing losses, and discussed the energy losses at 90° confluences as well as the impact of a tributary on the water surface profile of the mainstream. Best and Reid 4 examined the hydraulic characteristics associated with different confluence angles, especially the natural characters of the separation zone downstream of confluences. Since the 1980s, the hydraulic effects of tributaries in unequal sizes have been considered in plenty. Flume experiments of river bed microrelief revealed that the bed elevation differences of unequal depth channels have little impact on the location and extent of central scour holes.5,6 Liu et al. 7 presented the velocity profile at 90° channel confluence. More recently, many studies have investigated confluence flow in open channel based on energy equations, momentum equations, and potential theory with dynamic mesh techniques.8–10
Beyond the morphological hydraulic research of river confluences, the consideration of sediment–flow interactions spawns a significant new phase of study. Mosley 11 introduced a flume experiment in which a mixture of sand and silt was used to study how sediment load influences the development of central scour hole at Y-shaped junctions. Ashmore and Parker 12 took an erosion test with fine particles intersecting and put forward a formula to predict the dimensions of central scour hole. Best 13 described the basic hydraulic characteristics of river confluences (Figure 1) as six hydraulic zones as follows: a flow-separation zone below the downstream junction corner, a zone of flow stagnation at the corner of the upstream junction, a flow deflection zone, an area of maximum velocity, shear layers due to mixing between confluent flows, and a gradual flow recovery area downstream from the flow-separation zone. Best and colleagues14,15 defined three key elements of bed morphology at river confluences: (1) a scour hollow, the orientation of which approximately bisects the confluence angle; (2) bar formation within the flow-separation zone; and (3) two distinct avalanche faces at the mouth of each channel which dip into the scour hollow (see Figure 2). Liu et al. 16 presented the evolutionary processes of mainstream bedload at open-channel confluence with flume experiment. Gamboa et al. 17 proposed a new classification for submarine confluences based on a combined analysis of channel geometry and high-quality 3D seismic data. Lyubimova et al. 18 studied the peculiarities of the formation of density currents in the zone of confluence of two rivers with strongly different hydrochemical regimes. Li et al. 19 studied sediment deposition characteristics at river confluence in reservoir area.

Model of flow dynamics at river confluences (after Best 13 ).

Typical bed morphology at ordinary sediment-laden flow confluences. 14
According to existing research works, previous flume-based and field-based studies mainly concerned hydraulic factors, while the sediment–flow interaction was mostly ignored. A widely applicable set of findings should particularly elucidate sediment transport and deposition bed evolution at channel confluences, which is our main concern. In this article, based on the water–sediment boundary significantly impacting on region of confluence reaches, taking experiments as the foundation, systemic analyzed the impact of upstream sediment supplies on characteristics of sediment aggradation and erosion at confluence reaches under different water–sediment conditions.
Experimental setup
The experimental system includes four parts: a flume containing a mainstream channel and a tributary channel, a flow circulation system, a flow regulation device, and a measurement system, as shown in Figure 3. The closed circulatory system is composed of pump, water conveyance pipeline, weir, unequal depth channels, sink, and reservoir. The cross section of the flume channel is rectangular. And the sidewalls were made of glass. The mainstream channel is 30 m long, 0.6 m wide, and 0.8 m deep. The tributary joined the mainstream from the right bank of the main channel at 10 m downstream of the main channel inlet. The tributary channel is 5.5 m long, 0.4 m wide, and 0.5 m deep. The confluence angle is adjustable.
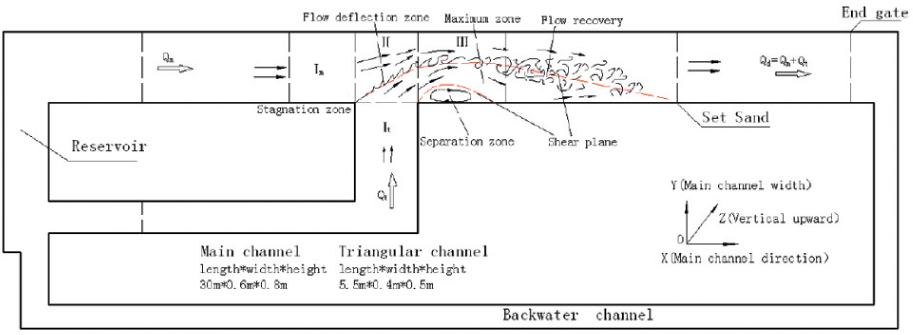
Schematic of the experimental setup and locations of flow pattern measurements.
An acoustic Doppler velocimetry (ADV) was used to measure instantaneous velocity, and testing needle was used to measure water depth. Water was circulated by pump and controlled by valves for providing a steady discharge. Meanwhile, a tailgate equipped at the end of main channel was used to control the tail water depth. The coordinate system is defined by X for longitudinal (downstream increase along the main channel), Y for transverse (increases from right to left bank of the main channel), and Z for vertical directions. And U, V, and W represent longitudinal, transverse, and vertical velocities, respectively.
Flow discharge at main channel inlet, tributary channel inlet, and main channel outlet are denoted as Qm, Qt, and Qd, respectively, so that Qd = Qm + Qt. The discharge relation between the main channel flow and tributary flow is a significant factor which influences the hydrodynamics near the confluence, and we defined a parameter Rq = Qt/Qd (i.e. the ratio of the tributary discharge to the total discharge) to represent this factor, and
Figure 3 and Table 1 list the specific parameters of the experiments. The experimental sediment was nature sand, of which the density is
Morphology and hydraulic and sediment condition of the experiments.

Results
This study focuses on two key features of the experimental cases: sediment transport and bed morphology at the confluence. To describe the results in a good way, the erosion and deposition processes would be discussed separately.
Experiment 1: scour test
Sediment transport rate
Under steady flow conditions, major changes in bedload flux are associated with the various bed compositions and topography (Figure 4). The initial state of the bed surface at the confluence is relatively flat, with coarse particles unexposed and fine grains distributed in the interstices.
1. Mobility of sediment fractions
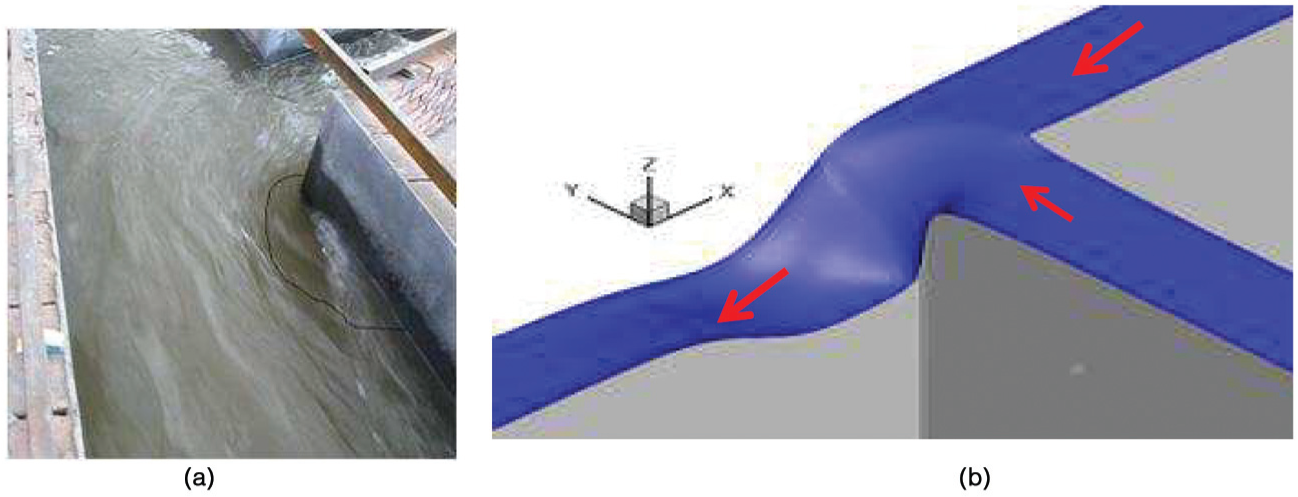
Discordant water surface in the confluence area: (a) Case 30-B (Rq = 0.42) and (b) Case 30-B (Rq = 0.42).
At the initial stage of Experiment 1 (which lasted approximately 1.0–3.0 h), the effect of tributary diving and blending on mainstream is obvious (see Figure 4), making sediment at channel confluence move easily and quickly transport downstream. The mobility of bed sediment which is smaller than or equal to the medium size is greater than the other portion, nearly the same as localized coarse and finer particles. As the exposure effect and bottom flow disturbance become greater, the median particle size of sediment becomes the largest proportion of the moving sediment. Figure 2 shows the sediment transport rate in the main channel of different cases.
2. Decline of bedload flux with time
According to the curves in Figure 5, sediment transport rate is intermittent and pulsating and decreases with time, which is similar to non-equilibrium sediment transport adjustment in a single channel flow. The average sediment transport rates of Case 30-B, Case 30-D, Case 90-B, and Case 90-D are 37.8, 42.6, 41.3, 48.6 g/s in the first 1-h erosion process; 20.8, 23.1, 22.7, 25.8 g/s in the first 3-h erosion process; and 13.4, 14.3, 14.5, 15.8 g/s in the entire experiment duration (about 9 h). From these data, we can find that the average sediment transport rate of Case 30-D in the first 1-h erosion process is approximately 3.0 times of that in the entire experiment duration, and the average sediment transport rate in the first 3-h erosion process is approximately 1.6 times of that in the entire experiment duration.
3. Effects of confluence angle

Duration curves of bedload transport rate in Experiment 1: (a) Case 30-B (Rq = 0.25), (b) Case 30-D (Rq = 0.42), (c) Case 90-B (Rq = 0.25), and (d) Case 90-D (Rq = 0.42).
If the discharge ratio Rq remained unchanged, when the confluence angle increased from 30° to 90°, the tributary flow would cause a larger momentum input to the mainstream along the Y-axis direction. This effect strengthens the blending between mainstream and tributary at the confluence and makes the sediment in II and III areas transport quicker toward downstream. As a result, the bedload transporting rate increases. Figure 6 shows the duration curves of cumulative volume of sediment transport in Experiment 1.

Duration curves of sediment volume transported with time in Experiment 1.
For Case 30-B (Figure 5(a)), the volumes of transported sediment in first hour, second hour, and full duration are 136, 115, and 420 kg, respectively. While for Case 90-B (Figure 5(c)), they are 154, 138, and 445 kg, respectively.
For Case 30-D (Figure 5(b)), the volumes of transported sediment in first hour, second hour, and full duration are 149, 120, and 434 kg, respectively. While for Case 90-D (Figure 5(d)), they are 175, 133, and 480 kg, respectively.
Bed morphology
When two channel flows meet at the confluence, due to the difference in velocity field in main and tributary channels, there is usually a shear plane existing between them, which is recognized as the major source of turbulence generation. 10 With the stagnation zone as the beginning of the shear plane, a separation zone is usually generated downstream of the branch channel and marked as the source of turbulence. In the separation zone, velocity magnitude is often small, while the velocity gradient near the edge of the separation zone is large. So, the edge of the separation zone performs as another shear plane in the confluence region. Bed morphology comprises three distinct elements: 15 an avalanche face in each confluent channel, a deep central scour hole, and a separation zone bar (see Figure 2).
The depth of central scour hole and the direction of the separation zone bar depend on the confluence angle and discharge ratio, Rq. At lower confluence angle (30°), the tributary dives into the mainstream slightly and the central scour hole is not obvious due to the lower momentum input. At higher confluence angle (90°), the top flushing effect of tributary leads to the increase in sediment transport in the confluence area and the formation of a central scour hole (see Figure 2). Owing to the lack of sediment supplement, the central scour hole gradually develops toward the right bank. The depth of central scour hole reduces with the deepest part located near the right bank in the downstream of the confluence area.
For both confluence angles, when the discharge ratio Rq is smaller, the depth of central scour hole is correspondingly smaller. A separation zone bar appears downstream of the confluence area in each case. The increase in the discharge ratio Rq would lead to increasing amount of sediment transport in the confluence area and accumulation downstream, which bring about the increase in scour depth (Figure 7). The location of maximum scour depth tends to be near the side of tributary channel.

Channel confluence landform contours with different bed cases: (a) initial bed of Case 30-B, (b) initial bed of Case 90-D, (c) Case 30-B (Rq = 0.25), (d) Case 90-D (Rq = 0.25), (e) Case 30-B (Rq = 0.25), (f) Case 90-D (Rq = 0.25), (g) Case 30-B (Rq = 0.42), (h) Case 90-D (Rq = 0.42), (i) Case 30-D (Rq = 0.42), and (j) Case 90-D (Rq = 0.42).
Experiment 2: deposit test
Sediment transport rate
Figure 8 shows the sediment transport of the main channel flow under different confluence patterns. Curves in Figure 9 show that sediment transport rate is intermittent and pulsating and decreases with time, which is similar to the scour cases. However, due to the supplement of sediment, part of the sediment in mainstream and tributary exchanges with bed materials and prevents further scouring at channel confluence. The erosion process is limited to confluence area and downstream of the confluence area. Tributary flow and sediment transport capacity are enhanced by the increasing discharge ratio Rq and confluence angle.
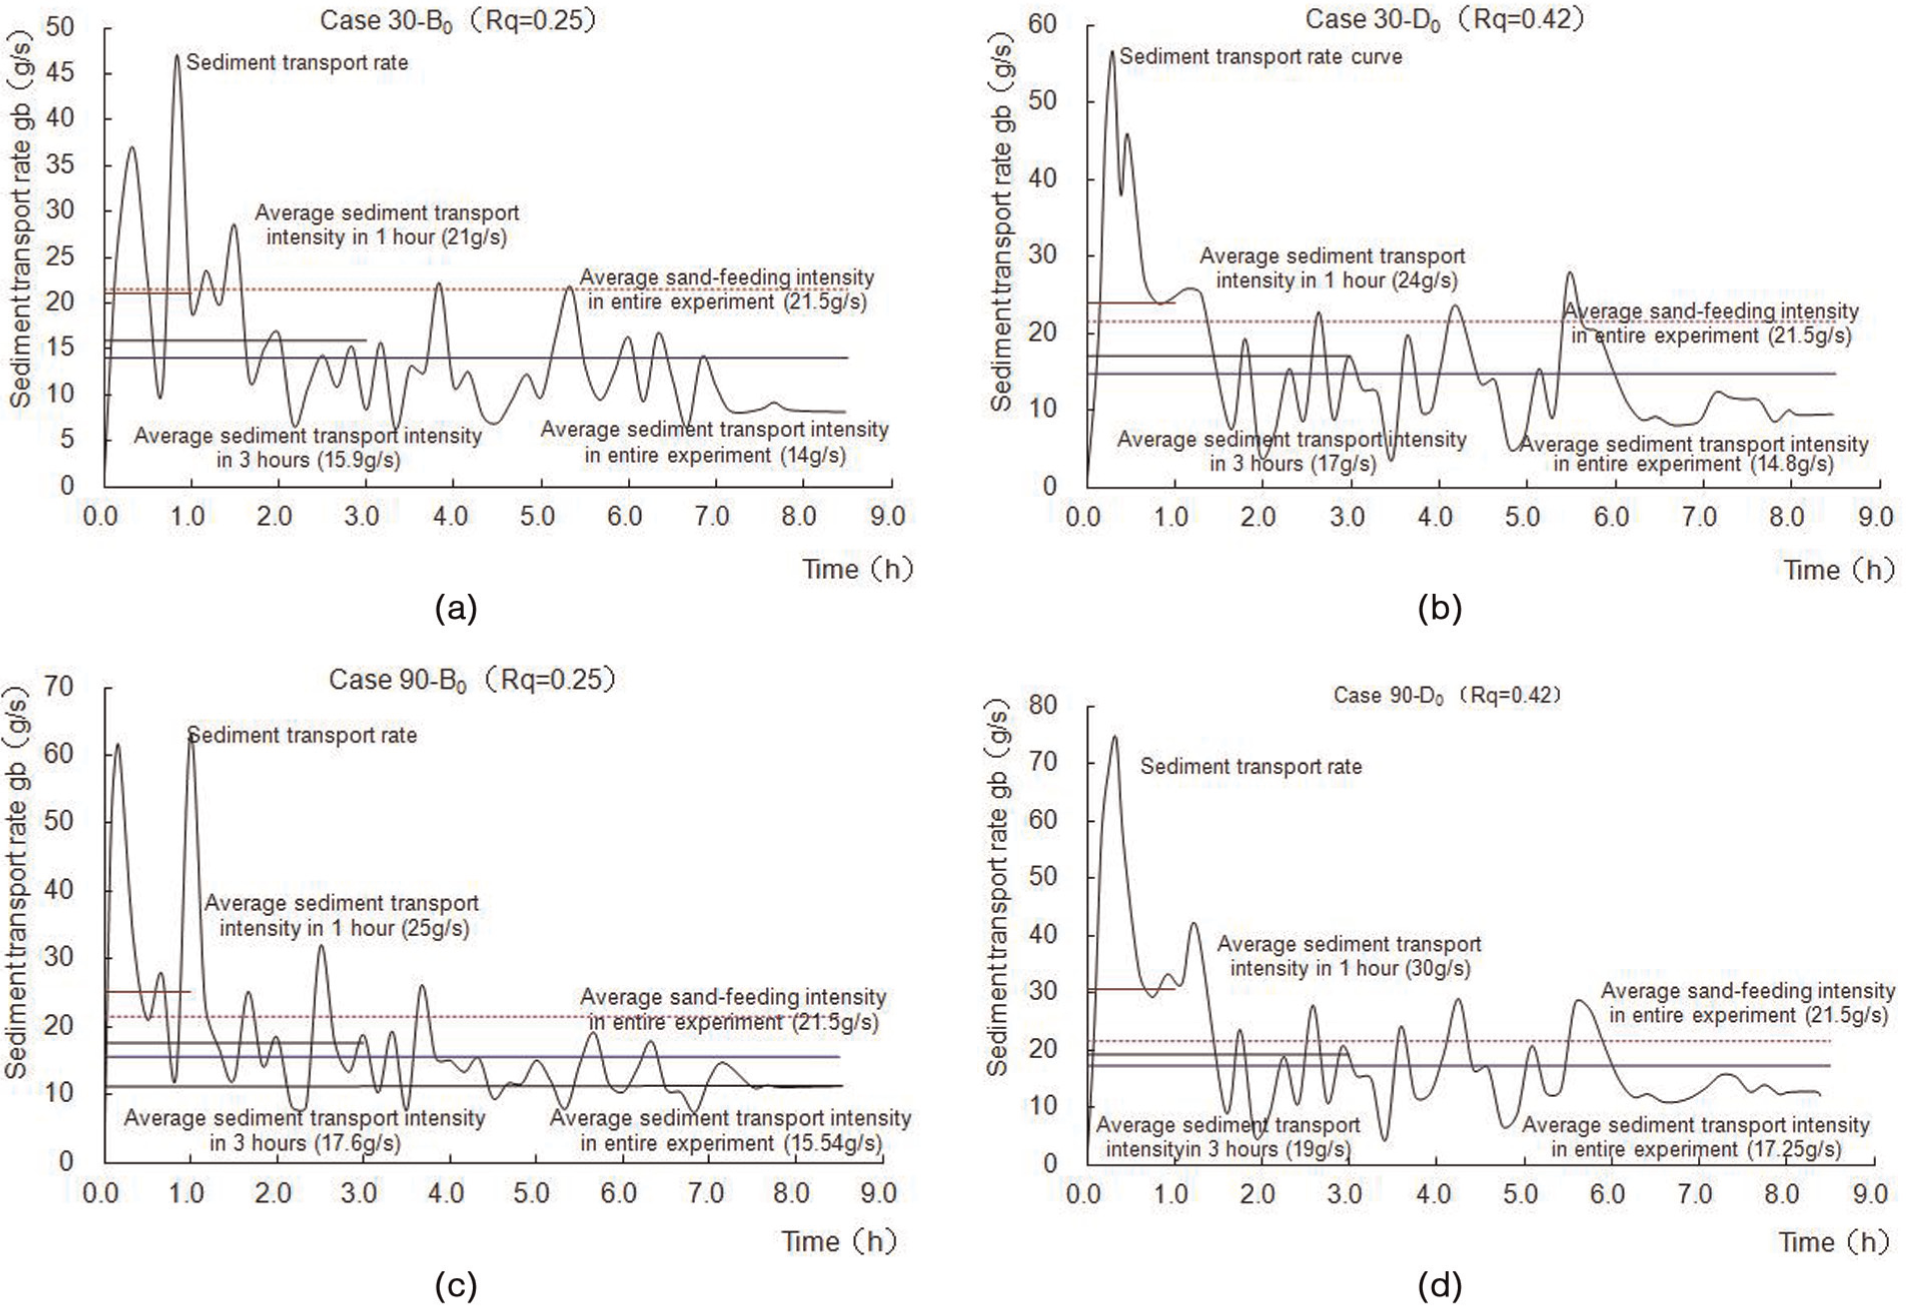
Duration curves of bedload transport rate in Experiment 2: (a) Case 30-B0 (Rq = 0.25), (b) Case 30-D0 (Rq = 0.42), (c) Case 90-B0 (Rq = 0.25), and (d) Case 90-D0 (Rq = 0.42).

Sediment volume transported with time in Experiment 2.
When the discharge ratio Rq increases from 0.25 to 0.42 with constant confluence angle of 30°, the average sediment transport rate increases from 21 to 24 g/s in the first 1 h, 15.9 to 17 g/s in the first 3 h, and 14 to 14.8 g/s for the entire experimental duration.
Bed morphology
When the sediment-carrying capacity of flow is less than the inflow sediment discharge, sediment deposition would occur. Due to the tributary diving into the mainstream, the water surface gradient becomes gentle and the flow velocity reduces in the mainstream upstream of the confluence area (Im area). Thereby, the sediment-carrying capacity of flow subsides at channel confluence, and a huge mass of sediment deposits in the upstream main channel (Im area). According to the experimental data, the rate and amount of sediment deposition increase with the increase in the discharge ratio Rq. The flow surface near the confluence region (II and III areas) is discordant because flow in the mainstream and tributary channel mixes strongly, and flow from the tributary effectively compresses the main channel. The flow velocity reaches a maximum value and then drops down because of the reduction in flow turbulence. Therefore, the coming sediment exchanges more frequently with the bed material along a shear plane developed between the two combining flows at channel confluence. Meanwhile, more and more coming sediment enters a mixing-caused separation zone which locates immediately downstream of the confluence area.
The bed morphology of channel confluence is shown in Figure 10, and the following results are obtained:
When the confluence angle is the same, the maximum deposition height at channel confluence increases with the increase in discharge ratio Rq, while the maximum sediment deposition point moves downstream. If the discharge ratio Rq is larger, the tributary dives sharply into the main channel, the central scour depth is also larger in the confluence area and downstream of the confluence area, and the sediment deposition is higher in the downstream of the confluence area, especially at the side of tributary channel.
When the confluence angle is small (

Channel confluence landform contours with different bed cases: (a) initial bed of Case 30-B0, (b) initial bed of Case 90-D0, (c) Case 30-B0 (Rq = 0.25), (d) Case 90-D0 (Rq = 0.25), (e) Case 30-B0 (Rq = 0.42), and (f) Case 90-D0 (Rq = 0.42).
Conclusion
We carried out a series of experiments to study the sediment transport, erosion, and deposition processes at confluences under different patterns and discharge ratios. Based on the experimental results, we get the following conclusions:
Both the discharge ratio and confluence angle have a significant impact on sediment transport and bed morphology, which show up as sediment transport rate increases with the increase in discharge ratio and confluence angle. Moreover, large discharge ratio and confluence angle will make the tributary flow compress main flow strongly and cause complex hydro-morphological interaction near the confluence.
A central scour hole gradually forms along the shear plane and develops toward the side of tributary channel when there is no sediment supplied from inlets, and the depth of the central scour hole increases with the confluence angle and discharge ratio becoming larger. But when the sediment-carrying capacity of flow is less than the inflow sediment discharge, deposition of sediment will happen upstream of confluence and in the separation zone.
The maximum deposition height at channel confluence mainly depends on the discharge ratio and confluence angle.
Despite the promising results, more comprehensive experiments are needed for a better understanding of the sediment transport and bed morphology at river channel confluences.
Footnotes
Academic Editor: Sandra Velarde Suarez
Declaration of conflicting interests
The authors declare that there is no conflict of interest.
Funding
Partial financial support for this study was provided by the National Natural Science Foundation of China (51209016, 51339001) and the Central Level Scientific Research Institutes Fund (CKSF2013006/HL).