
Abstract
As the key component of a hydroelectric power generation system, hydraulic turbine plays a decisive role in the overall performance of the system. There are many sandy rivers in the world, and turbines working in these rivers are seriously damaged. Therefore, the research of flow in sandy water has great theoretical significance and practical value. Based on the specific hydrological conditions of a hydropower station, the solid–liquid two-phase flow in the whole flow passage of a Francis turbine with splitter blades in sandy water was numerically studied. A geometric model of the whole flow passage of the Francis turbine was established on the basis of given design parameters. The solid–liquid two-phase turbulent flows in Francis turbine runner under three different loads were numerically analyzed by using this model. The three different loads are as follows: Condition 1: single unit with 1/4 load, Condition 2: single unit with 1/2 load, and Condition 3: single unit with full load. The distributions of pressure and sand concentration on the leading side and the suction side of the runner blades, as well as the velocity vector distribution of water and sand on the horizontal section of the runner, were obtained under different load conditions. Therefore, the damages to various flow passage components by sand can be qualitatively predicated under various conditions. To guarantee the safety and stability of the unit, the adverse conditions shall be avoided, which can provide certain reference for plant operation.
Introduction
Due to the reducing of coverage of forests and vegetation, as well as the serious soil erosion problem, the concentration of sand in inland rivers is multiplied. Due to erosion and wear by sandy water, the performance of turbine deteriorates. The damage to the flow surface is aggravated, the overhaul period is shortened, and the service life is reduced. All of these increase the operation cost of the power plant and greatly reduce the economic benefits. A study of several existing hydroelectric power stations located in these regions has confirmed the severity of silt erosion on the critical underwater parts of turbines and other components of the power station. 1 The process of erosion damage is influenced by a number of factors, namely, the average velocity of particles, mass of particles, concentration of abrasive particles in fluid, size distribution of particles, their average grain size, angle of impingement, time interval of the attack, and the erosion resistance of structural material. 2 The flow in a turbine working in sandy river is multi-phase flow. Due to the complexity of internal flow, relevant problems have always been studied by experts and scholars.
With the development of computer numerical methods and experimental technology in recent years, it is possible to numerically simulate and experimentally study the flow in turbines, especially the Francis turbine with complex geometry. Many experts and scholars have studied the solid–liquid two-phase flow in turbines and have obtained some results. Based on the single-particle dynamic model, Beacher et al. 3 and Hamed 4 studied the trajectory of rigid small spherical particles in rotary blades of hydraulic machinery and predicated the wearing rules of impeller. Takgi et al. 5 reported the hydraulic performance tests on a Francis turbine model with sediment laden flow, conducted in Japan, and showed that the turbine’s best efficiency decreased in direct proportion to the increase in solids concentration. Mann and Arya 6 studied the silt erosion characteristics of plasma nitriding and high-velocity oxygen fuel (HVOF) coatings along with commonly used steel in hydroturbines. Li and Carpenter 7 realized that the flow surface of hydraulic machinery in sandy water will suffer the joint action of cavitation erosion and wear which will lead to a totally different failure mode from cavitation erosion or wear, and the damage degree is usually more serious than that of single effect. Engelhardt and Oechsle 8 examined different materials and coatings to evaluate their resistance to the hydraulic turbine surface. Thapa and Brekke 9 carried out laboratory erosion experiments on curved specimens by particles of different size to simulate the flow in Pelton bucket in a high-velocity test rig. Keck et al. 10 presented a study on the utilization of computational fluid dynamics (CFD) method to predict the erosion pattern in a hydraulic turbine and compared it with field measurements of the erosion. Susan Resiga 11 studied how the flow from runner outlet influenced the flow in draft tube with both numerical simulation and field test. Neopane et al. 12 suggested unsteady and turbulent flow in Francis runner particularly at the outlet region could reduce the certainty in flow prediction for estimating erosion losses. Bajracharya et al. 13 conducted data statistics and sediment calculation to the wear pattern of an impulse turbine and analyzed the relationship between sand erosion and efficiency reduction. Weili et al. 14 studied the cavitation characteristics of an axial flow turbine in sandy water and obtained the conclusion that cavitation is more likely to happen in sandy water than in clear water. Padhy and Saini 15 used the high-velocity jet type of test rig to investigate the effect of silt erosion on the performance of Pelton turbine. Thapa et al.16,17 used the rotating disk apparatus (RDA) to study the synergistic effect of sand erosion and cavitation in hydraulic turbine components and turbine materials. Eltvik et al. 18 investigated the relationships between the sand erosion and operating conditions of the turbine. It has been found that the erosion process is strongly dependent on the operating conditions of the turbines. Tang et al. 19 conducted secondary development to CFD and studied the solid–liquid two-phase flow in a Francis turbine by using the modified algebraic model, and the simulation results are consistent with the actual project. Thapa et al.20,21 optimized the turbine in sandy water through numerical simulation and experimental study, effectively reduced the sand erosion, and improved the turbine efficiency. Padhy and Saini 22 experimentally studied the sand erosion mechanism of a turbine in real operation condition, and the test results show that the size of sand particles has great influence to the wear degree of blades. Rajkarnikar et al. 23 designed and developed a runner blade sand-carrying test apparatus, and the test results of this apparatus show that the runner blades designed by traditional method is more likely to be eroded by sand. Guangjie et al. 24 discussed the wear rate of runner blade and guide vane, analyzed the distribution of sand concentration on the surface, and obtained the wear rate of turbine under normal operation conditions. Shi and Wei 25 studied the 3D solid–liquid turbulent flow in low specific speed centrifugal pumps and found the main region of the abrasion of the impeller and volute casing. Quan et al. 26 analyzed the energy conversion capabilities of screw centrifugal pump in sand–water two-phase flow and obtained the form of energy conversion between liquid phase and solid phase. We also did a lot of work in this aspect.27–30 We numerically simulated the trajectory of sand particles in the three-dimensional flow field of a turbine, discussed the flow and hydraulic loss in a turbine working in sandy water, and analyzed the sand erosion of a turbine. As a newly designed and manufactured turbine in recent years, the internal flow of Francis turbine with splitter blades is more complicated. There are a few studies on solid–liquid two-phase turbulent flow in sandy water. This article will numerically simulate the two-phase flow in a Francis turbine with splitter blades and analyze the flow pattern in a turbine runner in sandy water.
Basic equations
The following assumptions have been made in this study:
The liquid phase (water) is incompressible. The solid phase (sand) is continuous. The physical properties of each phase are constants.
The solid phase consists of sand particles spherical in shape and uniform in size.
Neither the suspended matter nor the carrier liquid undergoes any phase change.
Interactions between particles, as well as between particles and the wall, are neglected.
The usual approach for describing turbulence transport in the flow is to separate each of the instantaneous variables into a mean part and a fluctuating part. Thus, the time-averaged continuity equations and momentum equations for solid–liquid two-phase flows can be written as9,10
Time-averaged liquid phase continuity equation

Time-averaged solid phase continuity equation

Time-averaged liquid phase momentum equation
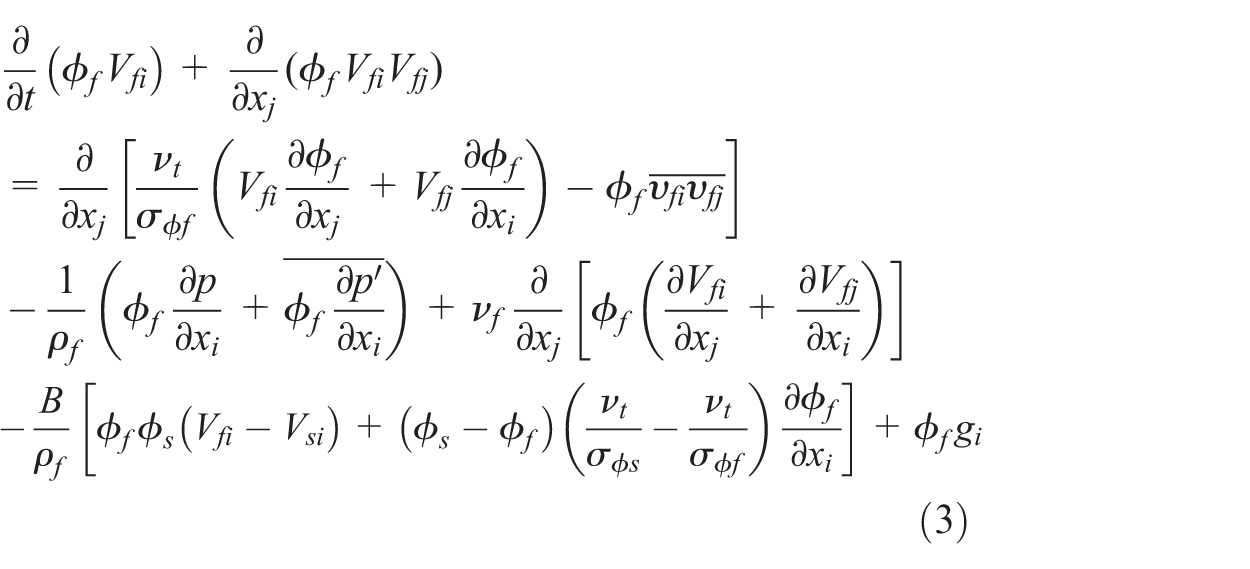
Time-averaged solid phase momentum equation

The turbulent kinetic energy equation (k equation) for solid–liquid two-phase flow is

The turbulent energy dissipation rate equation (ε equation) for solid–liquid two-phase flow is

where


In the above equations, subscripts f and s represent the liquid and the solid phases, respectively, and i, j, and k tensors. t is the time, Vi
is the time-averaged velocity components,
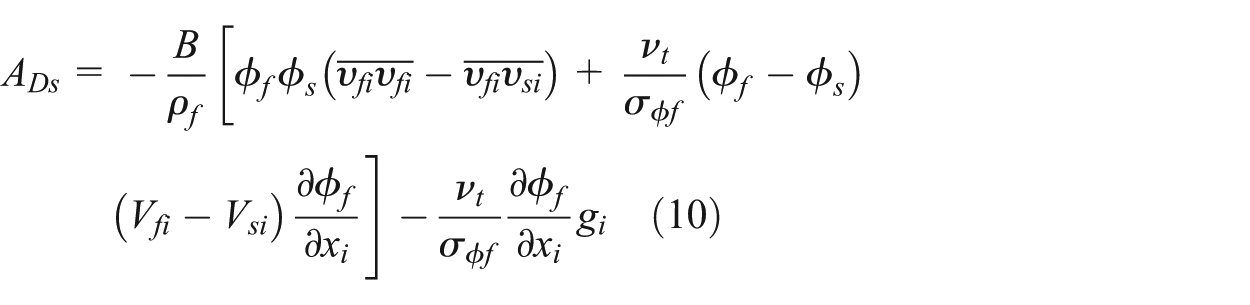
The mean relation equations for the liquid and solid volume fractions are


where A is the ratio of particle response time τ
p
[ρ
s
d
2/(18ρfνf
)] to the fluid Lagrangian integral time scale
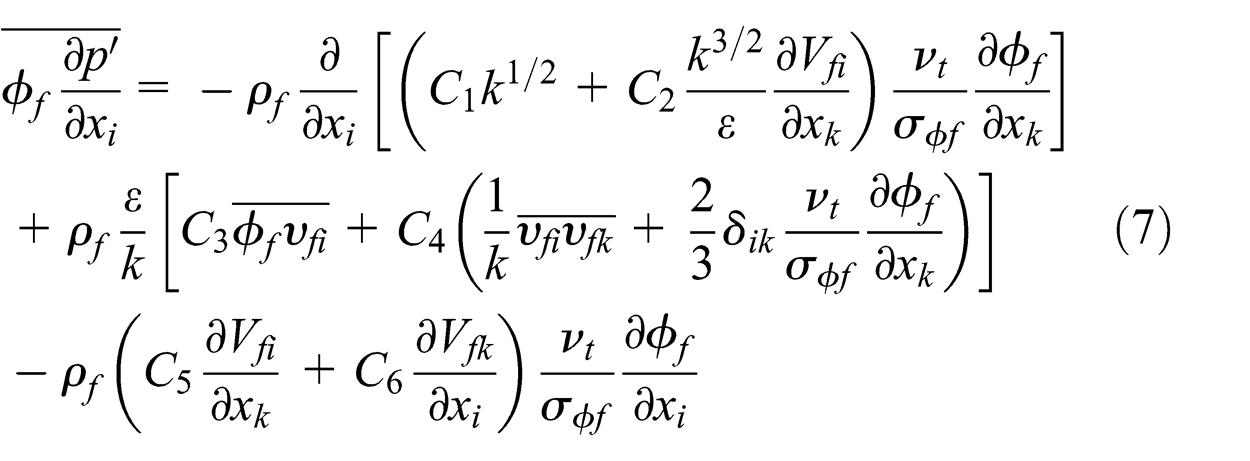
The liquid phase Reynolds stress

where
Calculation parameters
Basic parameters of turbine
The turbine in Jinping-II Hydropower Station on Yalong River of China (the specific speed of the turbine is Ns = 110 and the runner blades are splitter blades) was selected, and the whole flow passage of the turbine was numerically simulated. The basic parameters of the turbine are listed in Table 1.
Basic design parameters of the turbine.
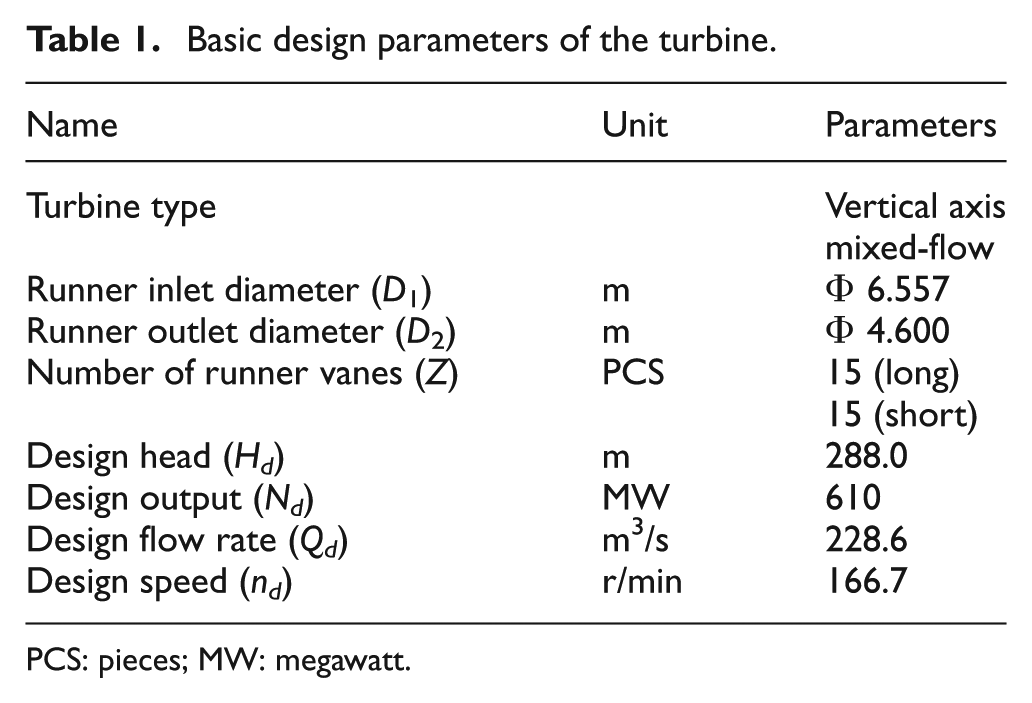
PCS: pieces; MW: megawatt.
On UG software platform, the whole flow passage components of the turbine in this power station was geometrically and digitally modeled by using the data provided by the turbine designer. The three-dimensional model of the turbine runner is shown in Figure 1. And then, the CFD-dedicated front processor—Gambit software was used to divide meshes of all flow components, and totally 2,193,457 meshes were generated. The mesh diagram of turbine runner is shown in Figure 2.
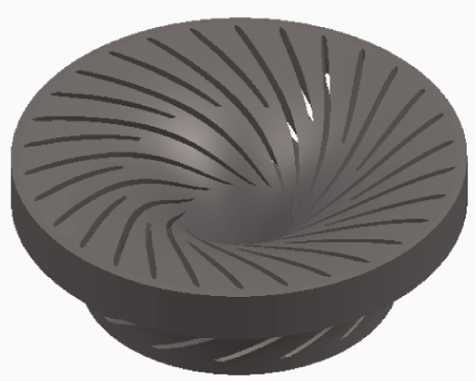
Three-dimensional model of turbine runner.

Mesh diagram of turbine runner.
Calculation parameters
According to the design parameters and the scope of operating conditions of the turbine, three operating points were selected. The calculation parameters of various conditions are listed in Table 2.
Statistics of CFD calculation conditions.

CFD: computational fluid dynamics.
Boundary conditions
The SIMPLE (Semi-Implicit Method for Pressure-Linked Equations) algorithm of RNG (Renormalization Group) k-ε model was adopted. The velocity inlet was adopted as the inlet boundary conditions. The inlet velocity was determined according to the flow rate. It was assumed that the inlet has uniform incoming flow, and the inlet velocity is perpendicular to the inlet boundary surface. The inlet velocities of various conditions were calculated by using the data in Table 2. For the outlet boundary conditions, the pressure outlet was determined according to the suction height, the direction was perpendicular to the outlet surface, and the calculated outlet section pressure was 99081 Pa. The velocity on solid wall could meet the no-slip wall conditions, and the standard wall function was adopted in the near-wall area. While determining the velocity and pressure on the inlet and outlet, the volume fraction and particle size were given. The sand volume concentrations (fractions) of various conditions are listed in Table 2. And the average particle size was taken as 0.246 mm according to those provided by the power station.
Calculation results and analysis
According to the calculation parameters and by using the Fluent software and the numerical simulation model of solid–liquid two-phase turbulent flow, the turbulent flow in a turbine runner under three different load conditions were numerically analyzed. The distributions of pressure and sand concentration on the leading side and the suction side of the runner blades, as well as the velocity vector distribution of water and sand on the horizontal section of the runner, were obtained.
Condition 1 (single unit with 1/4 load, wicket gate opening of 7.3°, and flow rate of 66.0 m3/s)
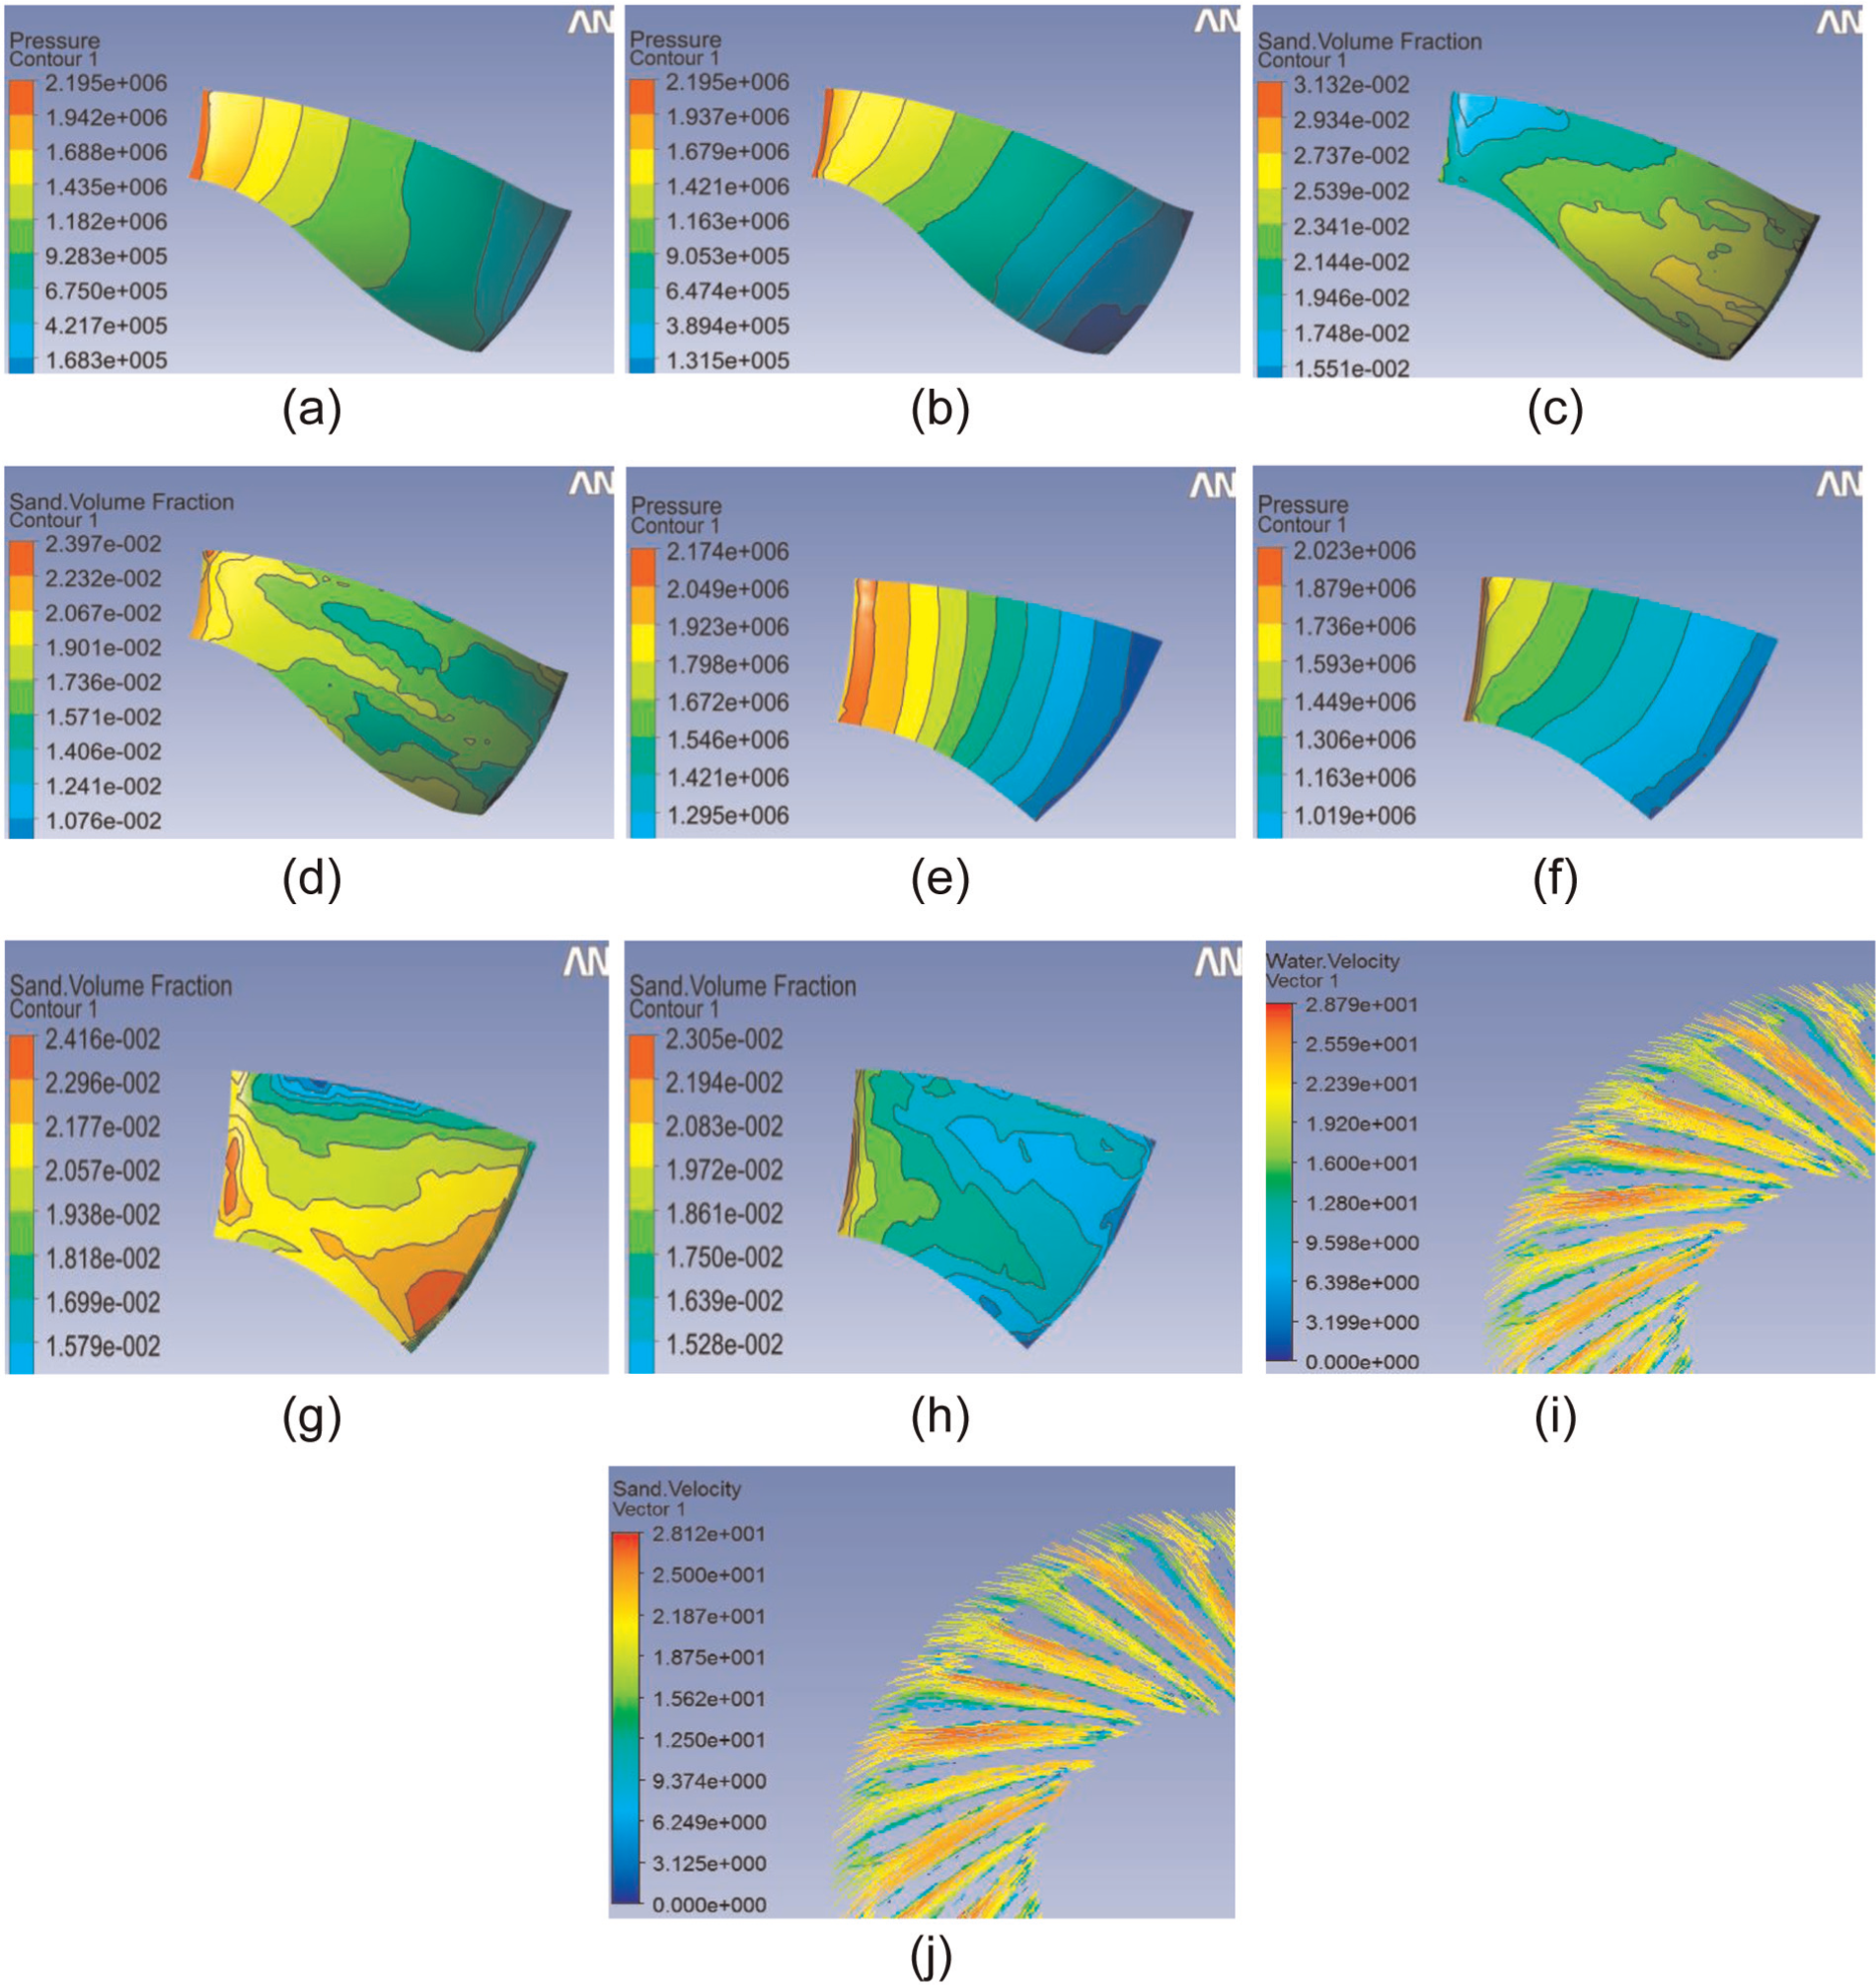
The distributions of pressure, sand concentration, and velocity vector on the runner blade surface are shown from Figure 3a–j.

Distributions of pressure and sand concentration on runner blades in Condition 1 (single unit with 1/4 load). (a) Pressure distribution on leading side of long blade, (b) pressure distribution on suction side of long blade, (c) sand concentration distribution on leading side of long blade, (d) sand concentration distribution on suction side of long blade, (e) pressure distribution on leading side of short blade, (f) pressure distribution on suction side of short blade, (g) sand concentration distribution on leading side of short blade, (h) sand concentration distribution on suction side of short blade, (i) velocity vector distribution of water on the horizontal section, and (j) velocity vector distribution of sand on the horizontal section.
It can be seen from Figure 3a–j that the distributions of pressure on the leading side and suction side of the long and short blades are basically uniform and roughly follow the cylindrical layer independence assumption for single unit with 1/4 load. The pressure gradually reduces from the inlet to the outlet of the long and short blades. The pressure at the blade inlet near the band is high, while a low-pressure zone is appeared on the blade outlet near the crown. The pressure distribution laws on the long blade and short blade are basically consistent. The low-pressure zone on the long blade has negative pressure; therefore, the long blade is more prone to cavitation. The sand distributions on the long and short blades are uneven. The sand concentration has a general increasing trend from the crown to the band of the blade. A high sand concentration appeared on a small zone at the center of the band on the leading side of the long blade and on some zones on the band near the inlet on the suction side. The velocity distribution of sand and the velocity vector distribution of water are basically consistent, and the velocity vector of sand is slightly less than that of water. High-velocity vector appeared on the blade leading side near the head. Some vortexes flow off from the head of long and short blades near the leading side, which indicates small flow rate in this condition and weak sand-carrying capacity.
Condition 2 (single unit with 1/2 load, wicket gate opening of 12.5°, and flow rate of 117.0 m3/s)
The distributions of pressure, sand concentration, and velocity vector on the runner blade surface are shown in Figure 4a–j.

Distributions of pressure and sand concentration on runner blades in Condition 2 (single unit with 1/2 load). (a) Pressure distribution on leading side of long blade, (b) pressure distribution on suction side of long blade, (c) sand concentration distribution on leading side of long blade, (d) sand concentration distribution on suction side of long blade, (e) pressure distribution on leading side of short blade, (f) pressure distribution on suction side of short blade, (g) sand concentration distribution on leading side of short blade, (h) sand concentration distribution on suction side of short blade, (i) velocity vector distribution of water on the horizontal section, and (j) velocity vector distribution of sand on the horizontal section.
It can be seen from Figure 4a–j that the distributions of pressure on the leading side and suction side of the long and short blades are uniform and basically consistent with the cylindrical layer independence assumption for single unit with 1/2 load. The pressure gradually reduces from the inlet to the outlet of the long and short blades. Some high-pressure zones appeared at the inlet of the long and short blades. Low-pressure zones appeared on the outlet of the long blade, and the area of low-pressure zone on the suction side is large. There is negative pressure in this zone which is vulnerable to cavitation. There is no negative pressure in the low-pressure zone on the short blade, which is less likely to cavitate. The sand concentration distributions on the long and short blades are roughly uniform. The sand concentration has a general increasing trend from the crown to the band of the blade. A slightly high sand concentration appeared on the blade outlet near the band, and the zones with high sand concentration are prone to sand abrasion. The distributions of sand concentrations on long and short blades are basically consistent. Relatively high-velocity vectors appeared on some parts of the blade leading side near the head. The velocity distribution of sand is basically consistent with the velocity vector distribution of water, and the velocity vector of sand is slightly less than that of water. Only few vortexes flow off from the head of long and short blades near the leading side. Compared with Condition 1, the sand-carrying capacity is strong.
Condition 3 (single unit with full load, wicket gate opening of 24°, and flow rate of 228.6 m3/s)
The distributions of pressure, sand concentration, and velocity vector on the runner blade surface are shown in Figure 5a–j.
Distributions of pressure and sand concentration on runner blades in Condition 3 (single unit with full load). (a) Pressure distribution on leading side of long blade, (b) pressure distribution on suction side of long blade, (c) sand concentration distribution on leading side of long blade, (d) sand concentration distribution on suction side of long blade, (e) pressure distribution on leading side of short blade, (f) pressure distribution on suction side of short blade, (g) sand concentration distribution on leading side of short blade, (h) sand concentration distribution on suction side of short blade, (i) velocity vector distribution of water on the horizontal section, and (j) velocity vector distribution of sand on the horizontal section.
It can be seen from Figure 5a–j that the distributions of pressure on the leading side and suction side of the long and short blades are uniform and basically consistent with the cylindrical layer independence assumption for single unit with full load. The pressure gradually reduces from the inlet to the outlet of the long and short blades. Some high-pressure zones appeared at the blade inlet. A large negative pressure zone appeared on the long blade outlet near the band, which is more likely to cavitate. The sand concentration distributions on the blades are roughly uniform. The sand concentration has a general increasing trend from the crown to the band of the blade. Some parts of the inlet of long blade suction side near the crown, the band of short blade leading side near the inlet and outlet, and some parts on the central inlet of the suction side of the short blade have high sand concentrations. These areas are prone to cavitation. Some parts on the blade leading side near the head have high-velocity vectors. The velocity distribution of sand is basically consistent with the velocity vector distribution of water, and the velocity vector of sand is slightly less than that of water. There is basically no flow off of vortexes on the head of long and short blades. Compared with Condition 1 and Condition 2, the sand-carrying capacity is stronger.
Conclusion
Under various conditions, the pressure distributions on turbine blades are uniform. There is a high-pressure zone near the blade inlet and a small low-pressure zone at the blade outlet in each condition. With the increase in load, the low-pressure zone gradually moves to the band from the crown of the blade outlet. This is also the place most vulnerable to cavitation on turbine blade. Compared to the short blades, the long blades are more likely to produce a negative pressure, and the cavitation phenomenon on long blades is worth attention.
According to the distribution of sand in different areas of the runner and the size of sand particles under various conditions, the sand distribution area and sand concentration are large on the blade outlet near the band and on the runner band. Therefore, the damages to various flow passage components by sand can be qualitatively predicated under various conditions. To guarantee the safety and stability of the unit, the adverse conditions shall be avoided, which can provide certain reference for plant operation.
The sand-carrying capacity is increasing with the flow rate. Thus, with the increase in load, the guide vane opening, the flow rate, and the sand concentration will increase, and the velocity of sandy flow will be accelerated. We believe that sand will wear and tear the turbine flow components under any conditions, especially under cavitation conditions. Sandy water will intensify the damages to turbine if it is deviating from the design point, and the energy features of the unit will be significantly affected. Our research results show that the fatal damage to the turbine is the joint action of sand erosion and cavitation. These two factors accelerate the damage of turbine runner by aiding each other at every moment.
Footnotes
Academic Editor: Jose R Serrano
Declaration of conflicting interests
The authors declare that there is no conflict of interests regarding the publication of this article.
Funding
The work described in this article was supported by the National Natural Science Foundation of China (grant no.: 51279172) and the Open Research Fund of the Key Laboratory of Fluid and Power Machinery, Ministry of Education (Xihua University) (grant no.: szjj2014-041).