
Abstract
This article presents the fluid mechanics of a ventilation system formed by a momentum source and buoyancy sources. We investigate the interaction between plumes and a non-isothermal air jet for separate sources of buoyancy produced by the plume and the momentum of the air jet. The mathematical model represents the situation in which a plume rises from two heat sources causing buoyancy. The model is used to discuss the interactions involved. The effects of parameters such as the power of the source and the air-flow volume used in the mathematical-physical model are also discussed. An expression is deduced for the trajectory of the non-isothermal air jet penetrated by plumes. Experiments were also carried out to illustrate the effect on the flow of the air jet and to validate the theoretical work. The results show that the buoyancy source’s efforts to baffle the descent of the cold air have even been effective in reversing the direction of the trajectory. However, increasing the distance between the plumes can reduce the effect of the plumes on the jet curve. And it is apparent that when the velocity of the air supply increases, the interference caused by the plumes can be reduced.
Introduction
The accumulation of heat in the upper part of rooms is utilized in the stratification and zoning room air-conditioning strategies. 1 The supply air devices are located in the lower zone. The temperature of the supply air is normally lower than the temperature of the room air in the controlled zone. The zone boundary should be defined high enough to get nearly all the induction air to the supply jet from the lower zone. The plume generated by the heat source penetration through the supply air jets depends on the air distribution method, locations of the plume and supply air device, plume heat power, and momentum of the supply jets. This article presents an analytical method for modeling the supply air jet penetrated by plumes for an air distribution method based on the sidewall vents.
Many sources that generate heat may be regarded as localized, for example, electrical equipment (including computers) and occupants. The plume generated by a localized heat source at floor level in an air-conditioned space can be of considerable interest with regard to building ventilation. In this article, these sources are classified as pure buoyancy sources (characterized by zero initial momentum flux), consisting of two plumes with either the same or different power.
A constant buoyancy flux may act against the descent of the cold air produced by the jet diffuser. As a result, the temperature of the residential zone may become higher than the intended value. In addition, the temperature in the confined spaces in the upper region may be actually lower than planned as cold air lingers there. In this case, it is obvious that flow resistance between the buoyancy source (the plume) and the momentum source (the air jet) has an effect on the flowing action of the non-isothermal air jet from the air-conditioning system. This thermal buoyancy effect may raise the air jet trajectory. Therefore, the effect of heat sources on the non-isothermal jet may not be insignificant. The universal mathematical model for non-isothermal air jets includes the buoyancy force caused by the temperature difference between the indoor air and the cooling air supplied by the jet diffuser. 2
Both at home and abroad, the calculation method of air jet is widely found in all design manuals, mainly divided into two systems: 3 the calculation system of the former Soviet Union scholar Abramovich and computing system of the US scholar Alfred Koestel. While the calculation method of air jet in some countries in Europe, Japan, and the United States use the formulas of the same basic form as in the design manuals, the calculation formulas are similar to the Alfred Koestel system with just some different experience coefficients. Air jet mostly belongs to the multiple strands of non-isothermal confined turbulent jet motion. At present, the study is aimed at turbulent characteristics, 4 trajectory, 5 and velocity distribution 6 of jet.
These computational methods greatly facilitate the design of air-conditioning system, but it is also a widespread problem and is accurate enough, without considering the influence of indoor thermal plume of air jet.
However, the buoyancy force produced by plumes has not yet been considered. Zeldovich, 7 Batchelor, 8 and Morton et al. 9 laid the foundations for classical plume theory, a theoretical description that is elegant in its simplicity and yet encapsulates the complex turbulent engulfment of ambient fluid into the plume. The theory presented—despite its simplicity—has been very successful in describing and explaining the behavior of plumes across the wide range of scales they are observed. A number of articles have been written on turbulent plumes.10–16 The solution procedures adopted the physical implications of these, and the scope of applying these approaches more widely to other plumes and plume-like flows is presented in these articles.
Scase et al. 17 again enriched Morton et al.’s results on the basis of the research-increasing hypothesis; obtained thermal plume buoyancy flux, mass flux, and momentum flux motion control equation; and gave its approximate solution in steady uniform environment.
Many scholars have studied the multiple plume mixing and interaction problems.18,19 Kaye and Linden 20 greatly enriched the research contents of multiple strands of plume. They start from two strands equal and unequal plume flow, respectively, from the theoretical and experimental analysis on the mixing process and movement situation after mixing of multi-strand plume mixing into axisymmetric plume, and in the entrainment coefficient determined, calculate the mixing height of plume.
In many applications, it is not the plume itself that is of primary interest, but rather its effect on the environment as a whole. Applications in the built environment include the natural ventilation of buildings where thermal plumes rising from heat sources not only determine the thermal stratification in a room but also set the rate of ventilation and thereby the comfort of occupants. The flow induced by these plumes plays a key role in setting the pattern of air movement and within a well-designed room may give rise to a desirable cooling flow through ventilation openings. 21 In other applications, it is the stratification established by the plume that is of primary interest; plumes confined within a container may be used in an experimental context specifically to stratify an environment.22,23
Our oceans and atmosphere are stratified and driven by a need to understand the dispersion of chemical pollutants 24 (often released locally forming pollutant plumes), the deepening of the ocean mixed layer, 25 or indeed the analogous mixed layer in a ventilated room. 26 Several workers have given attention to the cases in which there is either an air jet or heat source. Linden and Cooper, 27 Hunt et al.28,29 and Chen et al. 30 reported on ventilation and stratification in naturally ventilated spaces driven by heat sources. Hunt et al. 31 presented an experimental study of the thermal stratification produced by plumes and jets in enclosed spaces. Cho and Awbi 32 studied the effect of heat source location in a ventilated room. In their work, the authors used multiple regression analysis to predict the average velocity in the room and to determine the parameters that have the largest influence on the velocity. List 33 reviewed the ways in which jets and plumes interact with environmental factors.
Plume penetration through air supply jets depends on the air distribution method, the locations of the plume and the device supplying air, the heating power of the plume, and the momentum of the supply jets. This article presents an analytical method for modeling plume penetration when the air distribution method is based on a sidewall supply air jet. The purpose of the theoretical work described in this article is to develop the fluid mechanics for the ventilation system. We consider the buoyancy source required for a more efficient ventilation system and develop a better trajectory expression for the non-isothermal air jet taking into account the effect of the plume. Experiments are also performed to test the validity of the theory presented.
Methods
Penetration model
The penetration model is based on the forces created by the air supply jet and buoyancy. The principle of the model is illustrated in Figure 1.

The interaction of the cold jet and the hot plume.
When the jet encounters the plume, it is impacted by the plume in a direction perpendicular to its course. Thus, the speed of the jet in the perpendicular direction changes, which leads to a change in the vertical component of the velocity of the jet, as shown in Figure 1. As the air supply temperature is different from the room temperature and the plume temperature, the resultant external force is non-zero. This leads to an offset of the jet in the vertical direction. In this article, it is assumed that the offset in the vertical direction does not change the axial symmetry of the whole jet. Thus, it is enough to study the curve of the axis when studying the motion of the whole jet.
The plume phenomenon is caused by rising warm air. An analysis of the physical mechanism
14
responsible for the plume suggests that the main driving force behind the rising plume is the temperature difference between it and the ambient air which leads to a density difference,

where k is the buoyancy force factor of the plume, which may be expressed by the equation

where
Morton et al. 9 showed that the density of the plume is related to the momentum flux, buoyancy flux, and mass flux, which can be expressed as follows
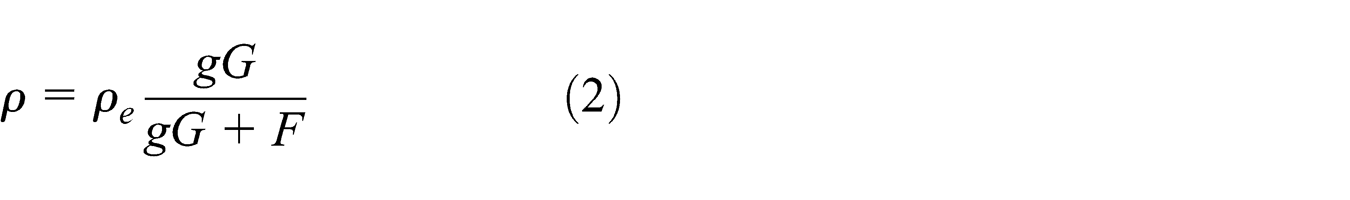
where G (m3/s) is the mass flux of the plume generated by the point source and F (m4/s3) is the buoyancy flux of the plume generated by the point source.
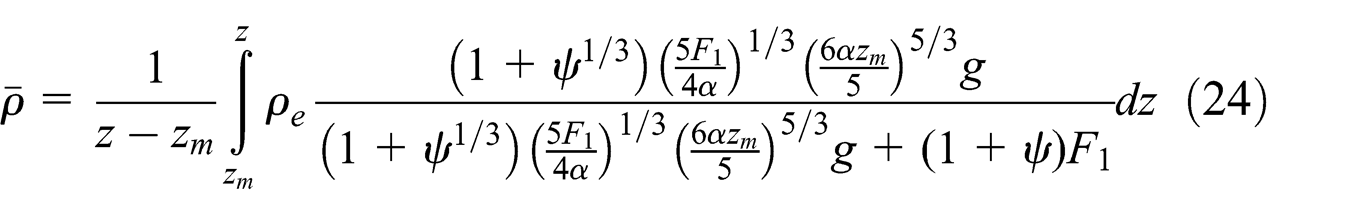
The density of the plume generated by the mixing of the two plumes can be represented as a function of height z:
Mixing of two plumes with the same power

Mixing of two plumes with different power

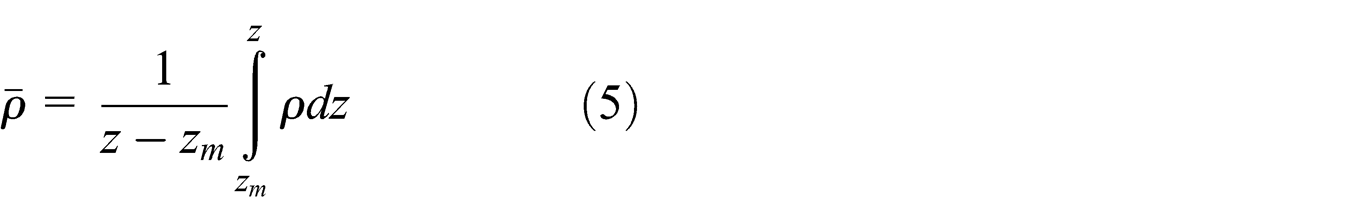
where ψ is the buoyancy flux ratio. Then, at height z, the average density of several plumes can be expressed as
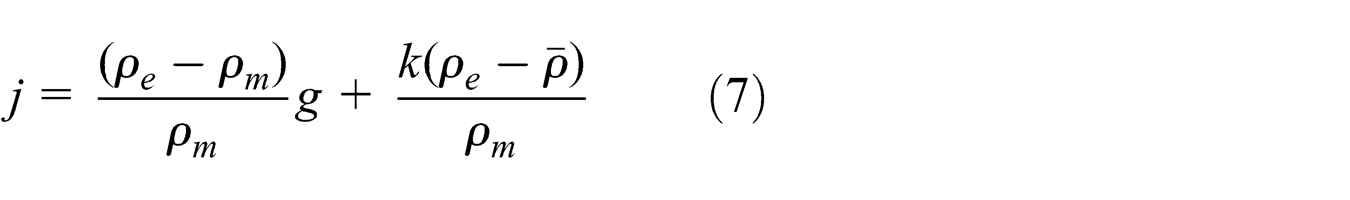
Defining the upward direction to be positive, the external force F 1 on the unit A can be expressed as

where ρm (kg/m3) is the axis density of the plume and j is the effective vertical acceleration due to gravity. This can be transformed into
According to basic physics, the relationship between the descending distance y′ of the cold jet pivot, the vertical velocity component uy ′, and the vertical acceleration due to gravity j is given by

Thus

Therefore

where Te is the indoor (environment) air temperature (°C), T 0 is the cold air temperature (°C), Tm is the axis temperature of the cold air jet (°C), ΔT 0 = T 0 − Te , and ΔTm = Tm − Te .
Substituting the pivot temperature with the pivot velocity, the last equation can be expressed as

where vm is the jet centerline velocity (m/s) and v 0 is the nozzle exit velocity (m/s).
So

Similarly

Combining equations (12) and (13) gives the pivot velocity of the cold jet

The descent distance of the cold jet pivot in the vertical direction is

According to fluid mechanics 19
The integral of y 2′ times s is

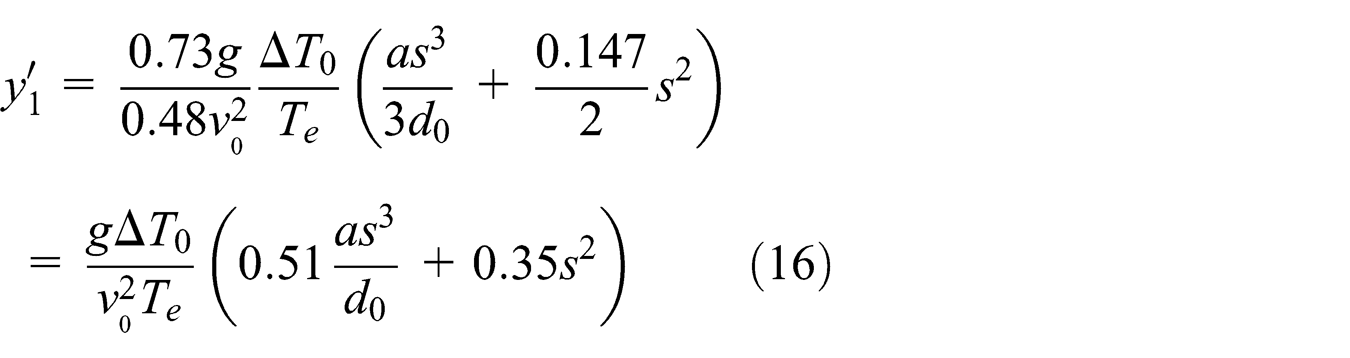
Substituting y 1′ and y 2′ into equation (15) and simplifying give

Equation (18) gives the change in the jet pivot descent distance as a function of the horizontal distance s. Dividing y′ by the nozzle’s diameter d 0 gives a dimensionless expression

Introducing the Archimedes number
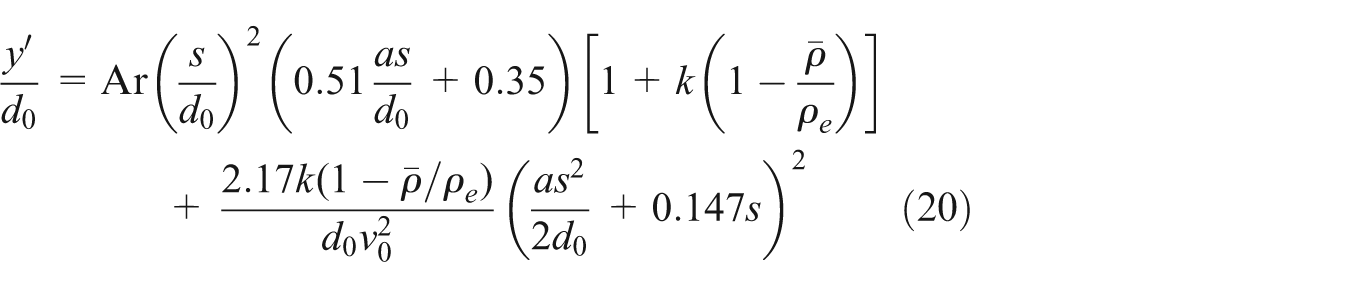
Equation (20) is the final dimensionless path equation for a horizontal jet in an air-conditioned space subjected to a plume.
Effect of several plumes
Equation for the jet with two equal plumes Q1 = Q2
Assume that the two plumes have the same heat power, Q 1 = Q 2, that the distance between them is x 0 and the mixing height is zm . Equation (3) gives the density of the plume after the two equally powerful plumes are mixed.
Thus, the dimensionless equation for the jet subject to the effects of the two plumes is

where the average density of several plumes can be expressed as

Equation for the jet with two plumes of different power Q1≠ Q2
If the two plumes have different power, Q 1≠Q 2, the distance between them is x 0, the mixing height is zm , and the buoyancy flux ratio is ψ; equation (4) gives the density of the plume after they mix. Thus, the dimensionless equation for the jet now has the same form as equation (21)

where the average density of several plumes can be expressed as
Test measurements
The schematic of the environmental laboratory building and air-conditioning system layout is shown in Figure 2. The laboratory air-conditioning system ensures the sent key air temperature and velocity, and ensures that the jet interferes in other motions, such as infiltration air movement and the envelope structure heat transfer.

Structure of building environmental laboratory schematic and air conditioning system layout.
The model was evaluated using test room experiments. The dimensions of the test room were length 5 m, width 3.5 m, and height 2.5 m. The heat source for the plumes was a convector heater, capable of creating a heat flow of up to 1000 W.
The thermal plume is composed of lawn lamp, as the simulation of point source plume. The lamp shade needs to be increased to fix the lawn, as shown in Figure 3. Change the different power of tubes to satisfy the requirements of plume heat source. In order to ensure to match the motion feature of point source plume, the jet radius of lawn lamp b and flow height x should meet the requirements of equation (25) and the entrainment coefficient


Front view and side view of lawn lamp shade structure.
One air supply nozzle with a diameter of 0.6 m was located close to the middle of the shorter wall of the test room at a height of 1.6 m. Venturi was used as the air supply nozzle. The design of venturi tube is divided into five parts: the entrance section A, the conical contraction section B, the cylindrical throat section C, the design of inner diameter D, and the diffusion section E. The size of each part and the cone angle are shown in Figure 4. From the figure, the diameter of A is the same as the design of the pipeline inner diameter D; entrance length is two times the design of inner diameter; the throat diameter

The design dimensions of venturi tube.
The experimental conditions are shown in Table 1. An anemometer was used to measure the velocity of the air, and thermocouples were adopted to measure the temperatures of the environment and the air supply. The model experiment uses Delta OHE universal wind instrument made in Italy, and the basic parameters are shown in Table 2.
Experiment conditions.

Delta OHE universal anemometer.

There were, in total, 924 measuring points recorded for each experimental condition used in Figure 5. The x–y plane lies in the laboratory floor, while z is in the altitude direction of the laboratory. A total of 12 horizontal measuring rows were arranged in the vertical direction, the distance from the floor, a starting height of 0.5m to the end height of 1.6m (the nozzle height) at equal intervals (0.1 m). Each measuring row included seven measuring points at different intervals (0.3, 0.2, 0.1, 0.1, 0.2, and 0.3 m, respectively) in the y-direction. The choice of different intervals is mainly in response to the rapidly changing velocity gradient around the pivot. The measuring points in the x-direction are at intervals of 0.3 m and are 11 in total.
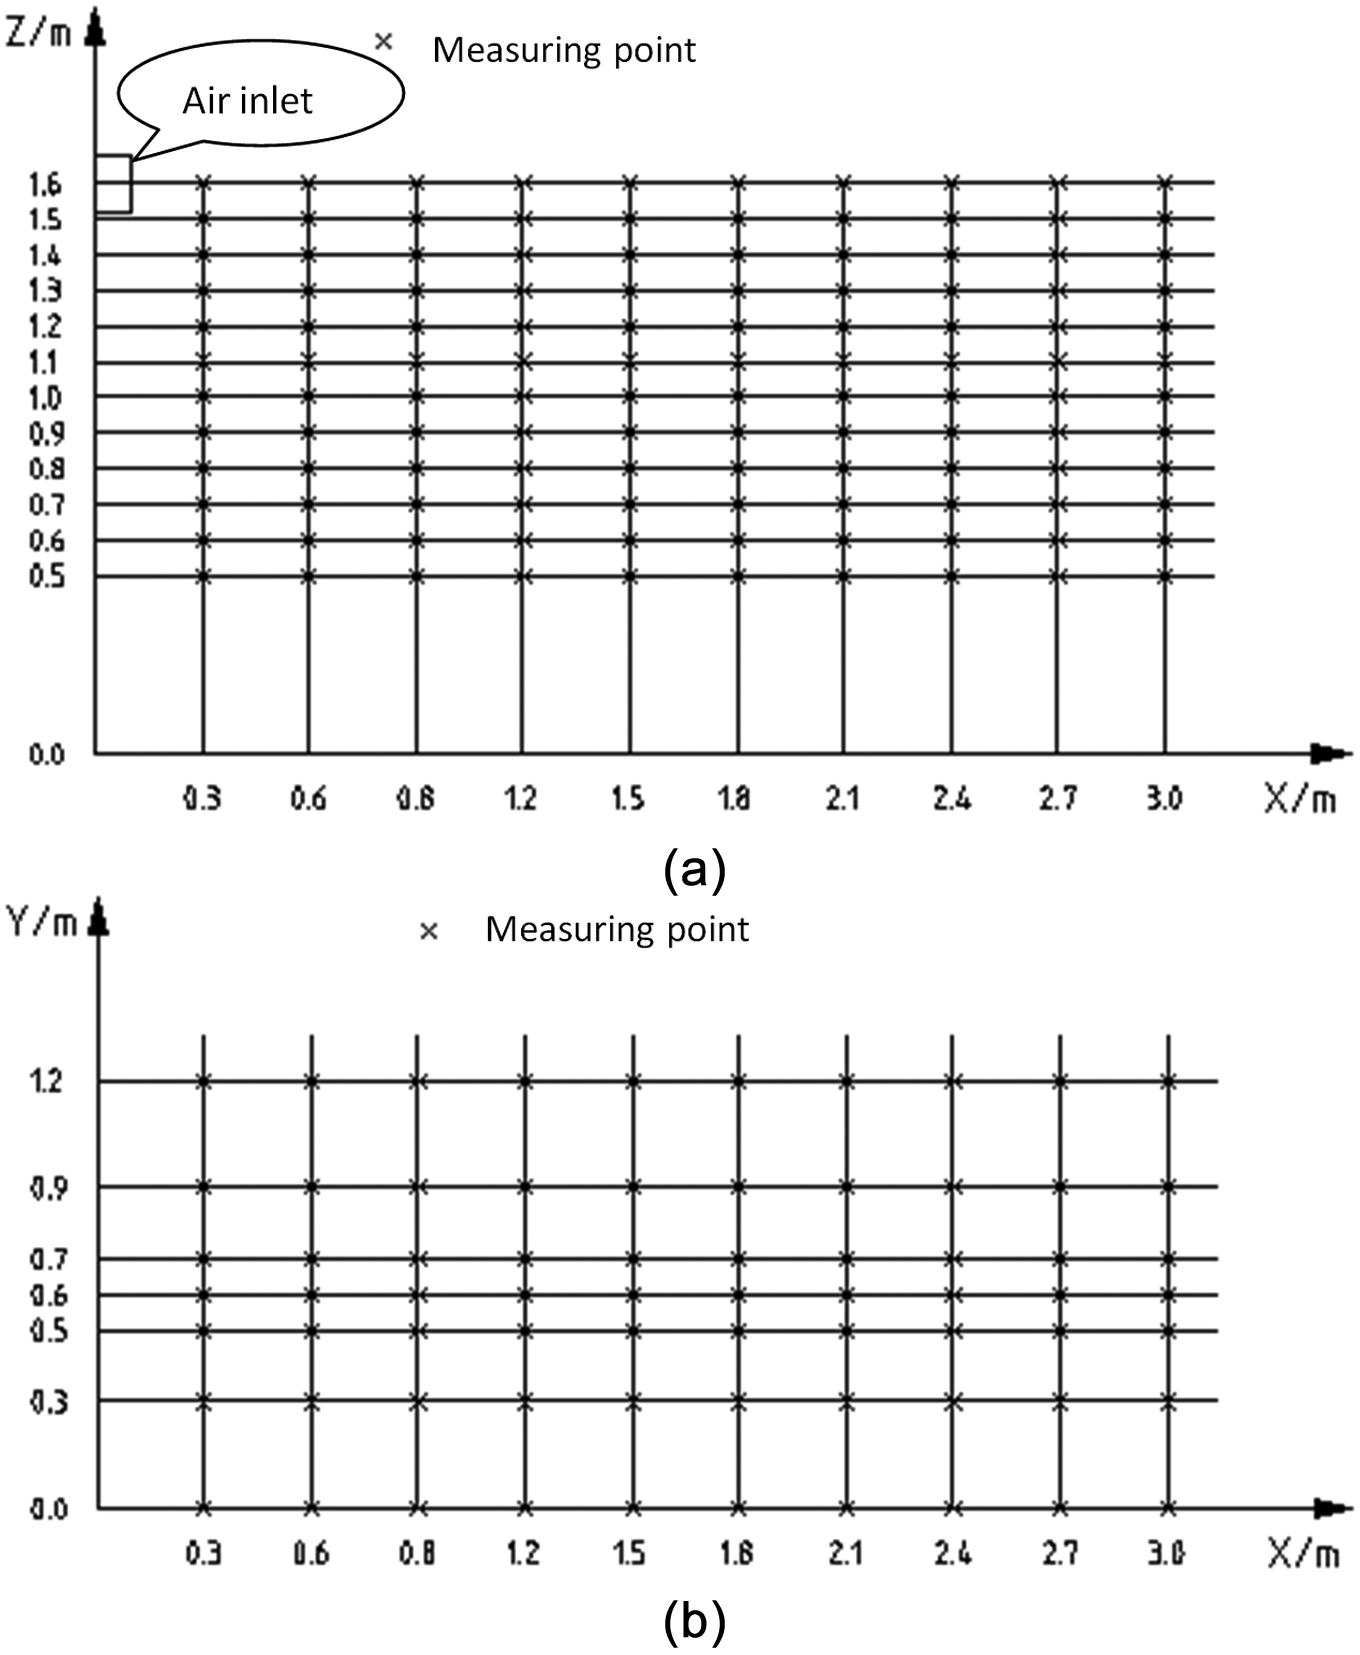
Layout of measuring point coordinates.
First, testers arrange the seven universal anemometers with unequal spacing of Y-direction on air vents’ horizontal distance of 0 positions. Second, they arrange mobile test position every 10 cm along the height direction (Z-direction) and complete 84 measuring points in the region. Third, they measure every 30 cm along the X-direction to the next test area, and so on, until all the 924 points are measured.
In order to ensure the accuracy of the experiment, each measuring point, every 1 min a group of data, records a total of three sets of data, and the average value is taken as the test data of the measuring point. Replace the lawn lamp source for other conditions during the experiment, need to readjust heater position, to ensure that the indoor temperature stabilizes at 26°C, then measure these measuring points.
Results
Two plumes with the same power
The experimental results and corresponding theoretical calculations for the jet under two plumes with the same power are shown in Figure 6. From Figure 5, it can be seen that the experimental values measured using conditions 1–3 are all smaller than the theoretical values. At s = 3 m, the maximum error in the jet curve is within 15%. On the whole, the theoretical values are in good agreement with the experimental values.

Comparison between theoretical analysis and experiment data with cases 1–3.
Two plumes with different power
The experimental results and theoretical calculations for two plumes with different power are shown in Figure 7. From Figure 6, it can be seen that the experimental values measured using conditions 4–7 are all smaller than the theoretical values. At s = 3 m, the maximum error in the jet curve is within 15%. On the whole, the theoretical values are again in good agreement with the experimental values. Figure 6 shows the comparison between theoretical analysis and experiment data with cases 1–3.

Comparison between theoretical analysis and experiment data with cases 4–7.
Discussion
Distance between the two plumes
The analysis in the previous section is based on a distance between the plumes of 0.1 m. The experimental and theoretical jet curves when the distance is enlarged to 0.2 and 0.3 m are shown in Figure 8. Under these conditions, the plumes are located symmetrically 1.5 m away from the nozzle.

The effects of distance between the two plumes on the non-isothermal air jet.
According to the theoretical analysis, the mixing height of the plumes is
From Figure 5, it is seen that the effect of the plumes on the jet curve is largest when the power of the two plumes is 150 W and the distance between the plumes is 0.1 m. The jet curve is raised to the largest degree at s = 3 m. Within the range s = 1.3–1.5 m, the jet curve is raised more than when x 0 = 0.2 m and x 0 = 0.3 m. When the power of the heat source is 300 W, the results are the same. The effect of the buoyancy of the plumes on the jet curve appears to decrease as the distance between the plumes increases. Thus, increasing the distance between the plumes can reduce the effect of the plumes on the jet curve.
The locations of the plumes
Figure 9 shows the effect of the plumes on the jet curve for different locations of the plumes. The heat source was located 0.5, 1.5, and 2.5 m from the nozzles successively while keeping the heat source power constant at 300 W. From the results, it can be seen that the coupling effect first occurs when the heat source is 0.5 m from the jet. The plume begins to influence the jet at 0.5 m height and the jet curve is lifted. However, the jet has a high velocity and strong rigidity, and so the effect on the plume is not distinct. When the heat source is located 1.5 m from the nozzles, the plumes and the jet start to interact at s = 1.5 m and the jet curve begins to migrate. In general, at s = 3 m, the conditions having the plume at 0.5 m from the nozzle influence the jet curve most. This is due to the long interaction time within which the jet curve can be affected.
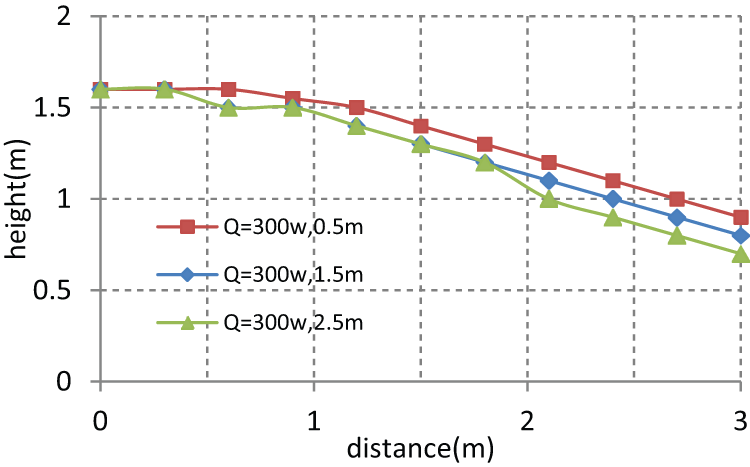
The effects of the location of the plume on the non-isothermal air jet.
The air supply height of the jet
Figure 10 shows the effect of the air supply height on the jet curve. It can be seen that when h = 1.9 m and h = 1.6 m, the effect on the jet curve increases if the heating power is increased from 150 to 1000 W. The greater the heating power, the more evident is the effect. Also, the extent of the effect of two plumes with different power is right between the effects of two single plumes. When the air supply height is 1.9 m and the heat source power is 1000 W, the trend in the jet curve is downward. This means that the buoyancy of the plumes cannot change the tendency of the jet. When the air supply height is 1.6 m and the heat source power increases from 150 to 1000 W, the tendency of the jet to bend upward is fairly apparent. At s = 3 m, the jet curve is raised approximately 0.6 m by the buoyancy of the plumes. It is clear that the air supply height influences the jet curve the most. The effect of the plumes on the jet curve can be reduced by increasing the height difference between the cold jet and the hot plumes. This can also be confirmed from the experiments.
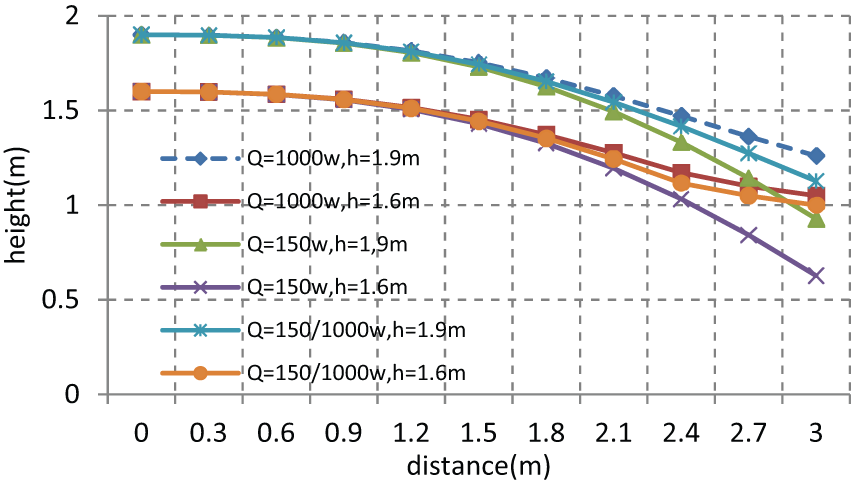
The effect of the plumes on the jet curve under conditions of different air supply heights.
The air supply velocity of the jet
Figure 11 shows the effect of the air supply velocity on the jet curve. From the figure, it is seen that if the air supply height is 1.6 m and the air supply velocity is 2 m/s, the jet curve is raised at s = 1.5 m when the heat source power increases from 150 to 1000 W. The lifting is also evident at s = 3 m. If the air supply velocity is increased to 2.5 m/s, then increasing the heating power lifts the jet curve at the same time. However, the amount of lift at s = 3 m/s under these conditions is smaller than when the velocity was 2 m/s. This is because increasing the velocity of the air supply increases the rigidity of the jet and the buoyancy of the plume is relatively weakened. Thus, the effect of the plume on the jet curve is reduced. The above phenomenon is also observed when two plumes with different power are used. It is apparent that when the velocity of the air supply increases, the interference caused by the plumes can be reduced.
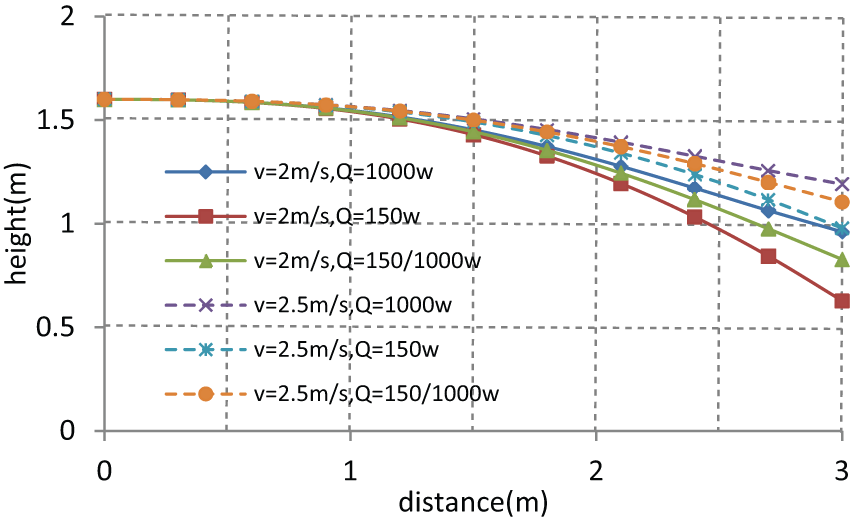
The effect of the plume on the jet curve under the conditions of different air supply velocities.
Conclusion
This article presents a theoretical and experimental study of the interaction between a plume and an air jet. In the study, the behavior of the (non-isothermal) air jet is affected by the plume which rises from a point heat source due to buoyancy. A theoretical model, which can predict the flowing action of the non-isothermal air jet, was developed. It is based on the theory of a pure plume and also incorporates the effect of the plume generated by the buoyancy of the source. It is concluded that the interaction between the air jet and the plume has an effect on the trajectory of the non-isothermal air jet. The trajectory is mainly determined by the jet height, the jet angle, and the velocity of the supplied air. The buoyancy source’s efforts to baffle the descent of the cold air have even been effective in reversing the direction of the trajectory. This generalization is predicted by the theoretical model and is well supported by the field experiments. Further investigations of the effects of the buoyancy force and jet force should be carried out, perhaps, to more thoroughly determine the effects of the plumes.
Footnotes
Academic Editor: Mohammad R Salimpour
Declaration of conflicting interests
The authors declared that they have no conflicts of interest to this work.
Funding
This research was financially supported by National Natural Science Foundation of China (Grant Nos 51108263 and 51278302) and the Hujiang Foundation of China (D14003).