
Abstract
During selective laser melting, the irradiated material experiences large temperature fluctuations in a short time which causes unwanted thermal stresses. In order to assess thermal stresses in a simple and fast way, a new pragmatic method is developed, namely the bridge curvature method. The bridge curvature method is used to assess and qualitatively compare the influence of different laser scan patterns, laser parameter settings and more fundamental process changes on residual stresses. The results from the experiments, as well as the findings from literature, lead to two general conclusions: changes that reduce the high temperature gradient, like using short scan vectors and preheating of the base plate, reduce the thermal stresses. And, thermal stresses in a particular direction can be reduced by optimal choice of the orientation of scan vectors. The experiments indicate the reliability of the bridge curvature method. Statistical analysis is used to check the repeatability of the method and to quantify the uncertainties during measurement.
Introduction
Selective laser melting (SLM) is a layered manufacturing process that allows the building of complex, lightweight and customized parts by consolidating successive layers of powder via melting with a laser. Since during the SLM process the powder material is fully melted, a low degree of porosity and good mechanical properties can be achieved.
During the SLM process, the material experiences large localized temperature fluctuations in a short time. This causes high thermal and resulting residual stresses that can introduce part warpage, cracks or an undesired reduction of strength. The goal of the reported investigation is to reduce the thermal stresses by changing the scan pattern, and altering process parameters like the layer thickness, pre-scanning a deposited powder layer or post-scanning an already scanned layer. To help achieve this goal, a new method is defined that enables the assessing of thermal stresses in a fast way by measuring the curvature of test parts when releasing them from the base plate on which they are built. The method enables the assessing and comparing of thermal stresses qualitatively.
Thermal stresses are stresses induced in a body when some or all of its volume is not free to expand or contract in response to changes in temperature. A material in its liquid phase does not contain thermal stresses. In the SLM process, thermal stresses arise in solidified material, subjected to temperature gradients, or subjected to shrinkage caused by the solidification of adjacent laser melted material.
For cases where no extra material is deposited, residual stresses arise by non-uniform plastic deformations in solid material. In that case, as long as the thermal stresses are elastic, no residual stresses will remain when the temperature comes back to its original value. If the thermal stresses inside a material become higher than the yield stress, residual stresses will remain after cooling. The sign (±) of the remaining residual stress will always be the opposite of the sign of the thermal stress. As a decrease of thermal stress will reduce the residual stresses, the terms ‘thermal stress’ and ‘residual stress’ are somewhat coupled. In the remainder of this article, these terms will be used interchangeably.
Mechanisms of thermal stresses in SLM
During the SLM process, the laser beam heats and melts material and causes a temperature gradient in the solid material being irradiated, resulting in residual stresses after cool down. Residual stresses in SLM are often larger than in, for example, selective laser sintering (SLS). Metal parts built by SLS are, by definition, more porous. Since the stress normal to a pore is zero, these porosities tend to decrease the residual stresses.
SLM parts are built onto a thick and stiff base plate in order to avoid large part distortions when a successive layer shrinks on top of the previous one. As seen in Figure 1, the part produced will crack if the residual stresses are too high.
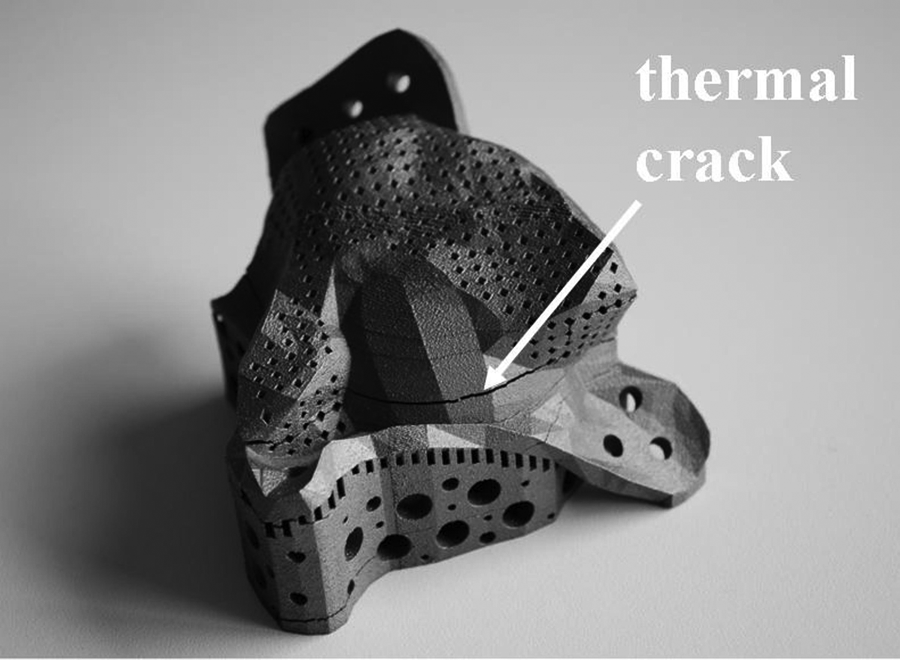
Selective laser melted part with cracks induced by thermal stresses.
Mercelis 1 uses two descriptive models to explain the mechanism of the thermal stresses in SLM: the temperature gradient mechanism (TGM) model and the cool-down phase model. The TGM model states that the laser beam heats up solid material being irradiated during the SLM process, which, as a result, tends to expand as shown in Figure 2(a). The thermal expansion (εth) is partially inhibited by the surrounding colder material, yielding a compressive stress–strain condition in the irradiated zone. If the compressive stress exceeds the compressive yield stress (σ yield ) of the material, the compressive strain will be partially elastic (εel) and partially plastic (εpl) as illustrated in Figure 2(b).
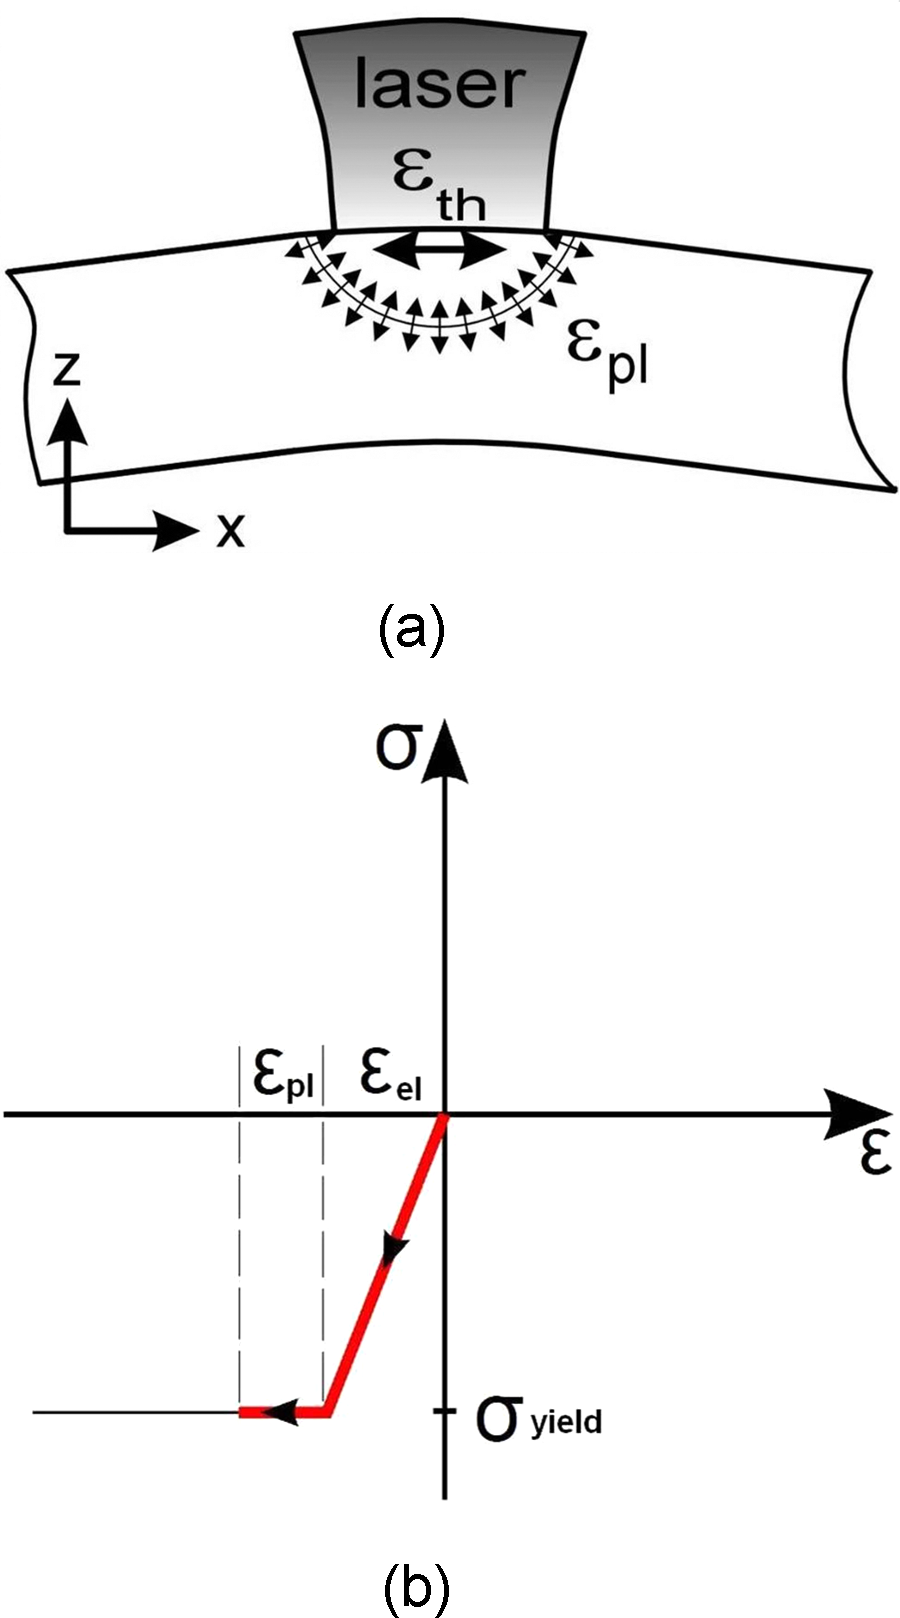
(a) Induced stresses and deformation (strain) during laser beam heating. 1 (b) Simplified representation of the formation of thermal stress and strains in the irradiated zone.
After the laser beam leaves that area, the irradiated zone will cool and tends to shrink. The shrinkage is partially inhibited as a consequence of the plastic deformation developed during heating, yielding a residual tensile stress (σ tens ) condition at the irradiated zone. According to the equilibriums of force and momentum of the part, the irradiated zone will become surrounded by a zone of compressive stress (σ comp ) (Figure 3).

(a) Occuring stresses and deformation (strain) when the part cools down. 1 (b) Simplified representation of the formation of residual stresses and strain in the irradiated zone.
The cool-down phase model describes the formation of residual stress as it arises in previously melted material when it re-solidifies and shrinks in solid state. The shrinkage is partially inhibited by the underlying material, thus introducing tensile stresses in the added top layer.
Modelling of thermal stresses in SLM
Mercelis 1 and Shiomi et al. 2 have defined a similar simplified mechanical model that quantifies the descriptive cool-down phase model by using the equilibriums of force and momentum. They assume the residual stresses in the latest added layer equal to the yield strength of the material. This causes high tensile stresses in the SLM part, compressive stresses in the upper part of the base plate and lower tensile stresses in the lower part of the base plate, as illustrated in Figure 4. The high tensile stresses inside the SLM part partially relax when removing the part from the base plate. The occurring relaxation consists of a constant term, which effects a uniform shrinkage of the part produced, and a linear term, which effects the bending of the produced part. The stresses in the part, which remain after relaxation, are considered as residual stresses (Figure 5).
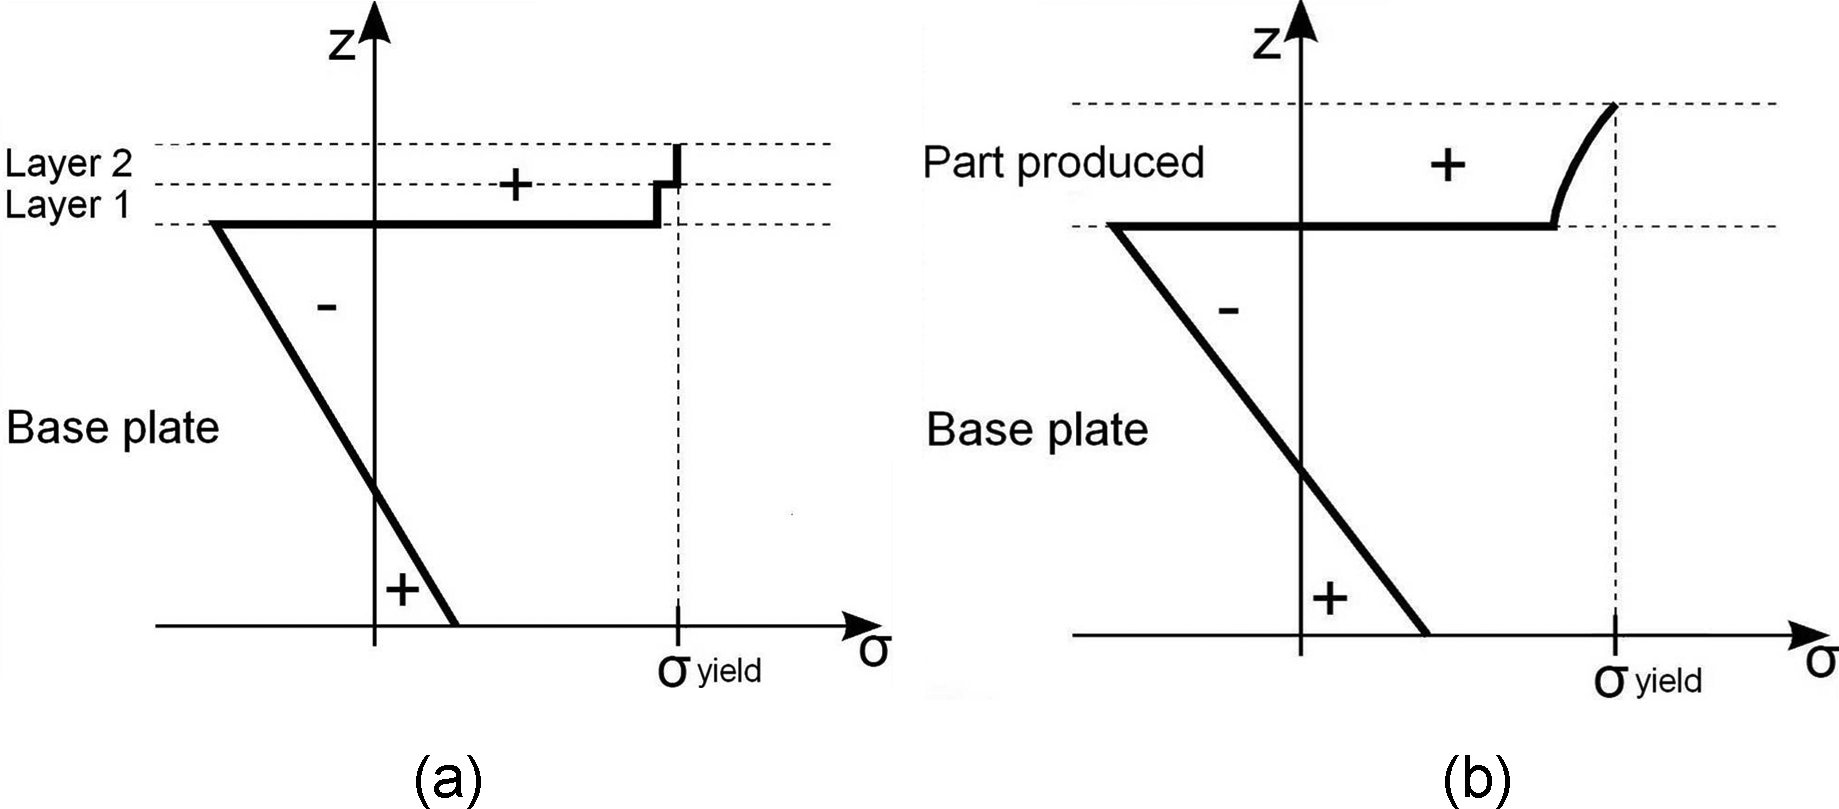
(a) Residual stresses after adding two layers of melted powder on a base plate. (b) Residual stresses of a SLM part on a base plate after melting more or all layers forming the part (simplified model).
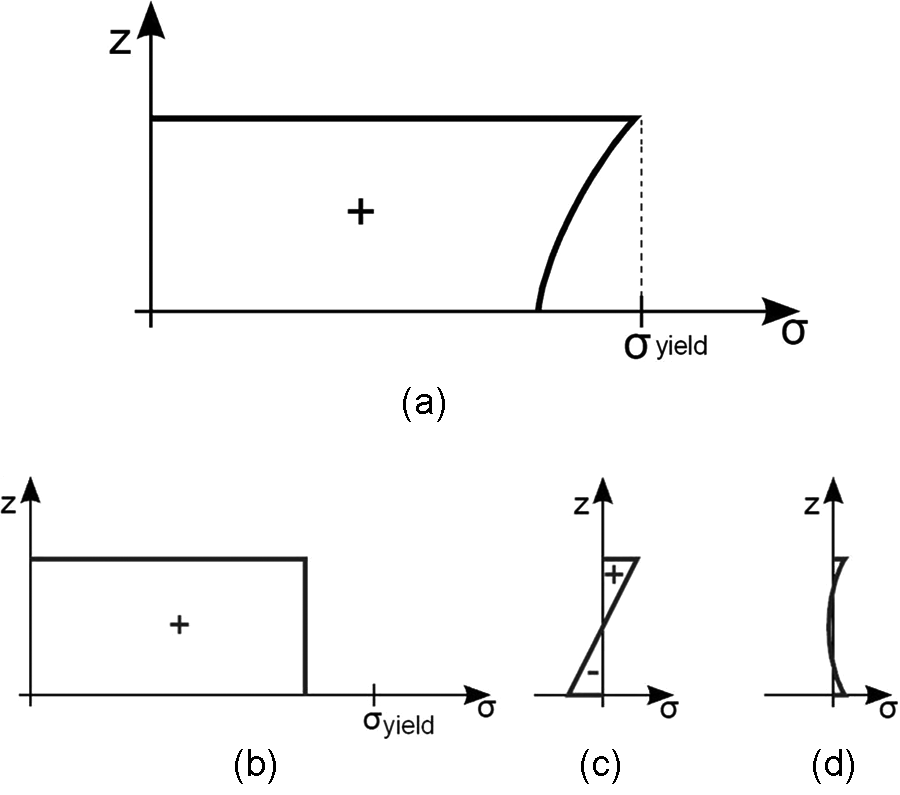
(a) Residual stresses within an SLM part still connected to the base plate. Constant (b) and linear (c) relaxation terms. (d) Residual stresses in a SLM part removed from the base plate.
Mechanical models simplify the heat input of the laser. In order to have more accurate models, it is necessary to calculate the exact temperature distribution in the part during processing. Many authors have discussed thermal modelling of other laser processing techniques like laser welding 3 and laser forming. 4 Thermal modelling of the SLM process is similar, but the powder characteristics and the scanning pattern of the laser beam also have to be taken into account.
Since residual stresses do not only depend on the temperature history, thermal models cannot predict the resulting residual stresses without mechanical considerations. Thermomechanical models are able to calculate a resulting stress profile from a thermal model. Many authors use the ABAQUS finite element package for creating thermomechanical models. Nickel et al. 5 used the finite element package to examine the effect of deposition patterns on the resulting stresses and deflections in laser deposited metal parts. Li et al. 6 used the package to investigate thermal stresses and their implication on cracking during laser melting of ceramic materials. Some researchers use their own written methods (e.g. Osakada and Shiomi 7 ) or use other packages like MARC MENTAT (Over et al. 8 ) or SYSWORLD (Niebling and Otto 9 ).
As illustrated by Bhadeshia, 10 many relations between material properties and thermal stresses are well understood. However, all this knowledge has not been extensively implemented yet for the calculation of thermal stresses.
Measuring residual stresses
Besides modelling the SLM process, many researchers have performed experimental tests to measure the residual stresses. These tests aim to verify the results of the theoretical models, or to examine the influence of non-simulated phenomena.
As illustrated by Withers and Bhadeshia 11 and by Kandil et al., 12 many techniques for measuring the residual stresses in a part are available. Usually a classification is made in two groups, whether the measurement is destructive or not. Destructive methods include the layer removal method, the crack compliance method, 1 the contour method 13 and the hole drilling method. Non-destructive methods include X-ray diffraction, neutron diffraction, ultrasonic and magnetic measuring methods.
Purpose of current work
Modelling thermal stresses and detailed investigation of thermal stresses by experiments can be time consuming. On the other hand, qualitative information of thermal stresses may be sufficient in SLM for comparing stress magnitude and for selecting build strategy and parameters minimizing stress levels. The purpose of this article is to introduce a new pragmatic method (bridge curvature method, BCM) for simple, fast and still accurate analysis of possible strategies to reduce residual stresses during SLM. The BCM resembles the layer removal methods (see the section on ‘Measuring residual stresses’ previously discussed). Bridge-like structures are produced on a baseplate using SLM. When removing the bridge structure from the base plate, the amount of resulting curvature is used as a measure for the amount of residual stresses in the part after production.
In a first set of experiments, statistical analysis is used to optimize the geometry of the bridges for repeatable measurement results. The reliability of this geometry and of the BCM in general is proven in two ways. Firstly, the curvature of the reference bridges are measured in order to investigate the repeatability. Secondly, the results, obtained by investigating the influence of different stress reducing strategies with BCM, are compared with results from literature.
The BCM enables qualitative comparisons with possible stress reducing strategies in a fast and easy way. For example the BCM can be used qualitatively to identify the benefit of a certain island scanning strategy with a particular stress relieving furnace treatment, or to compare two stress relieving furnace treatments with different parameters, etc.
Description of the novel analysis method and equipment
The first section below describes the main equipment used in this article. The second section describes the BCM and illustrates the influence of bridge geometry on the repeatability of the method.
Equipment
Since the easiness of implementing stress reducing strategies is machine dependent, two different machines are selected to produce the test parts: an in-house developed SLM machine (Katholieke Universiteit Leuven (KUL)-SLM machine) and a Concept Laser M3 Linear machine. The benefit of the in-house developed SLM machine is that its software enables more convenient control over the scan vectors to investigate new scan strategies (e.g. using short scan vectors). On the other hand, some scanning algorithms (e.g. island scanning) are not implemented in the in-house machine. For these algorithms the Concept Laser M3 Linear machine is used.
In order to investigate the reliability of the proposed method, not only two different machines are used, but also two different materials. To avoid powder contamination, one type of powder is used in each machine. Ti–6Al–4V test parts are produced using an in-house developed SLM machine and AISI 316L stainless steel test parts are produced using a Concept Laser M3 Linear machine. Table 1 gives an overview of the properties of these machines.
Properties of the KUL-SLM machine and the Concept Laser M3 Linear machine
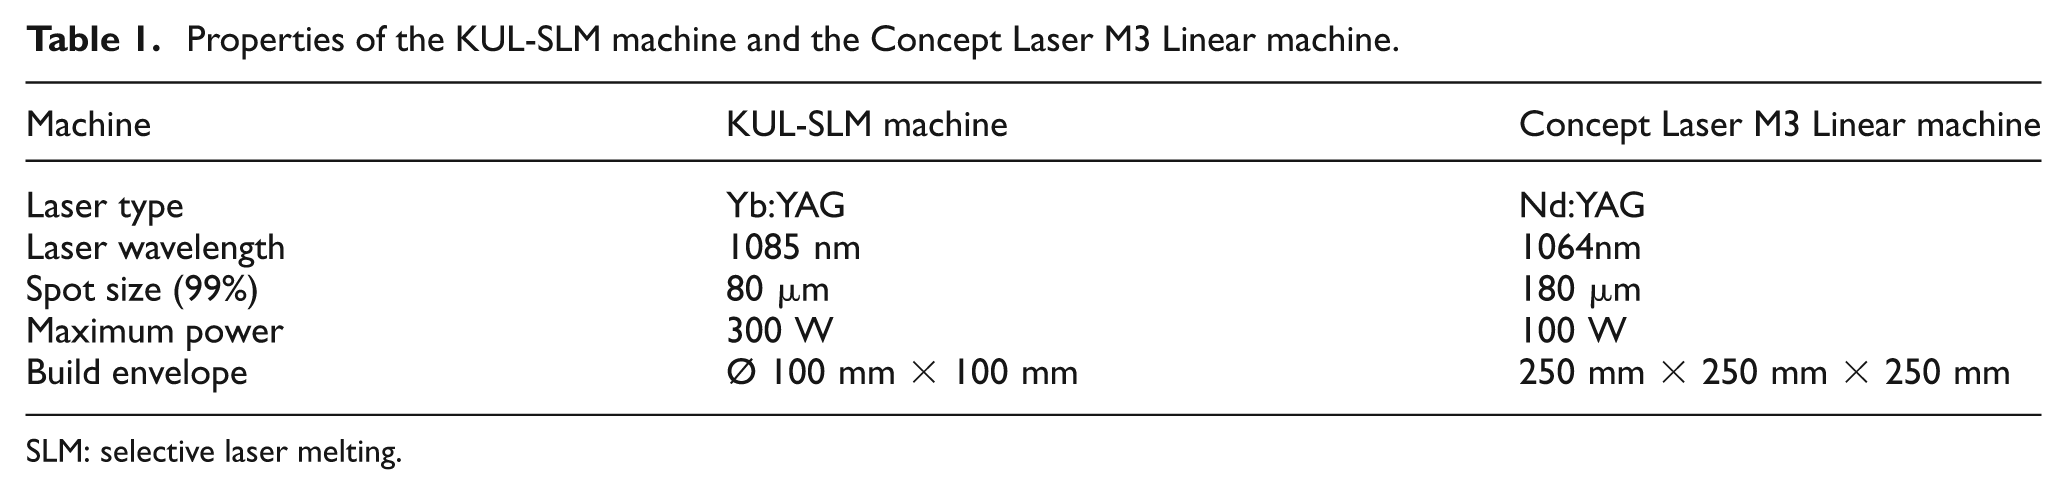
SLM: selective laser melting.
Besides the equipment to produce the parts, a non-contact vision measuring system (Mitutoyo Quick Vision Pro 202) is used for measuring the angle of curvature α of the parts. For the investigation of the influence of layer thickness on thermal stresses with new SLM parameters (see section on ‘Process changes’), an optical microscope is used to investigate the cross-sections and a device that incorporates the Archimedes method is used to assess the densities of the produced parts.
BCM
As illustrated in Figure 6(a), for using the BCM, a bridge-like part has to be built on a base plate. When the test part is cut off the base plate, for example, by wire electrical discharge machining (EDM), the bridge curls because of the relaxation of internal stresses. 1 Figure 6(a) and (b) illustrate the method. The planes at the bottom of the pillars of the bridge deviate from their normal position and form a curling angle α, which is indicative of the thermal stresses. The lines that determine the curling angle α and the curling angle α itself are automatically determined by the measurement software of the Mitutoyo Quick Vision Pro 202 system. For each test part, the curling angle is fastly measured 10 times (5 times on each side of the part). From the measured data the mean value and standard deviation are calculated together with a 95% confidence interval. Notice that only the residual tensile stresses in the x-direction at the top middle of the part (i.e. at the bridge overhang) cause the bending and that the Quick Vision measurements can be executed very quickly (in only a few minutes).
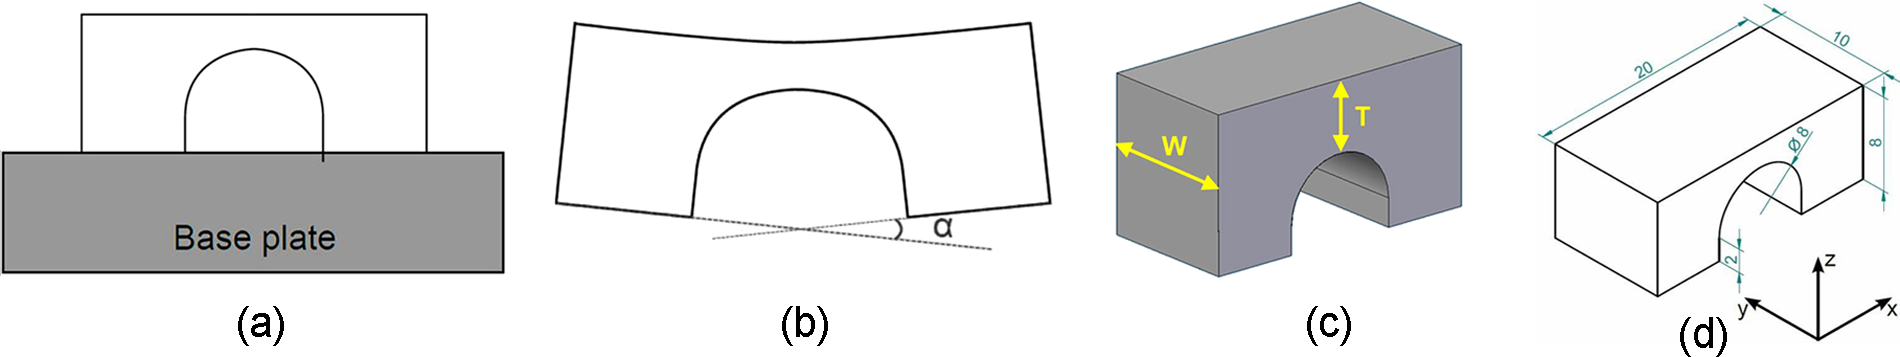
Principle of the method for identifying the residual stresses in the test parts. (a) Before, and (b) after removal from base plate. Geometry of the test parts: (c) variable width W and thickness T to optimize the bridge structure for repeatability. (d) Final dimensions of the optimized bridge geometry [mm].
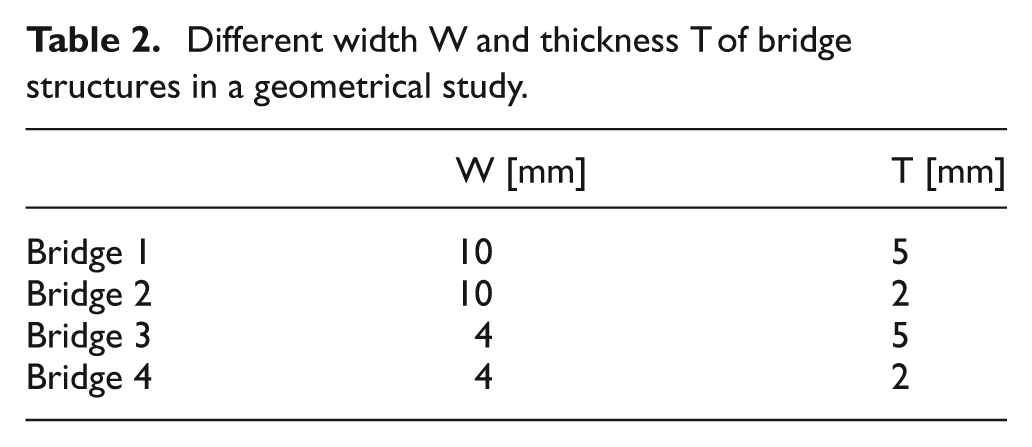
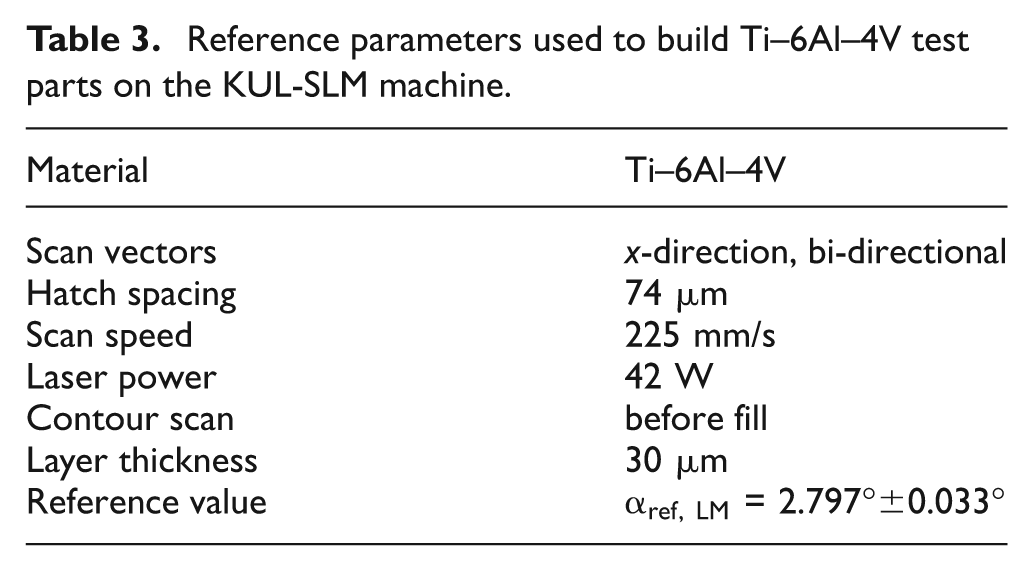
In a first set of experiments, four bridge structures with different geometries (width W and thickness T, see Figure 6(c) and Table 2) were each produced 2 times on the KUL-SLM machine with standard SLM parameters, optimized for density (see Table 3). After measuring the curling angle of each produced bridge structure 10 times, as described above, Fisher tests and Student tests are used to determine which geometries give repeatable measurement results. As a result both bridge 1 and bridge 2 had geometries that could be used further to investigate the residual stresses. Bridge geometry 2 is finally chosen to become the reference geometry, because it can be produced faster compared with geometry 1 owing to a smaller build height (smaller T value). (See Appendix 2 for a more detailed explanation).
Different width W and thickness T of bridge structures in a geometrical study.
Reference parameters used to build Ti–6Al–4V test parts on the KUL-SLM machine.
Since bridge 2 is produced with parameters optimized for density and geometry, it is called the ‘reference part’. All other bridge structures in this article are produced with the geometry of the reference part (see Figure 6(d)).
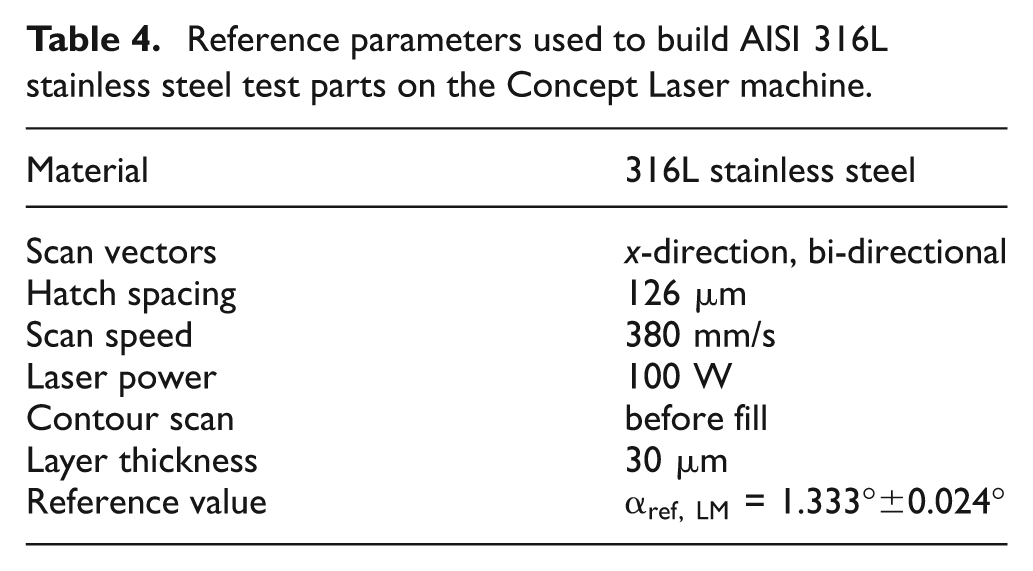
During each SLM experiment the reference part is made in order to investigate the repeatability of the BCM. In all graphical representations of the curling angle α, the curling angle of the reference part is illustrated and indicated with ‘REF.’. Tables 3 and 4 show the obtained mean values and standard deviations (95% confidence interval, Student test) for the curling angle α, considering all produced reference parts: on the KUL-SLM machine, 10 reference parts were produced (100 measurements) and on the Concept Laser M3 Linear machine four reference parts (40 measurements). A more detailed uncertainty analysis of the method (e.g. the influence of a bad EDM cut on the measured angle) is described by Wauthlé. 14
Reference parameters used to build AISI 316L stainless steel test parts on the Concept Laser machine.
Experiments and results
The first section describes the influence of the laser scan pattern on the measured curling angle of the test parts. Laser scan strategies can be adapted in a relatively easy way by changes in the scanning software. The second section describes the influence of more fundamental process changes that are not yet commonly used for SLM.
Change in laser scan pattern
Length of the scan vectors
The parallel bi-directional scan vectors, often used in SLM, do not always have the same length. The first test checks the influence of the vector length (l) in the x-direction on the bending of the part and is performed on the KUL-SLM machine. Figure 7 shows the scan pattern used to investigate the influence of shorter scan vectors on the thermal stresses. The sequence of the vectors scanned by the laser is determined by the path of the dotted line.
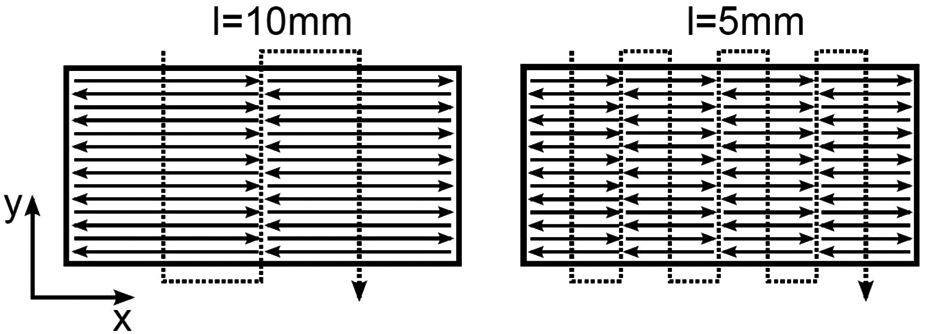
Scan pattern to investigate short scan vectors.
The results for vector lengths are shown in Figure 8. Three test parts with shorter vector lengths are compared with the reference part that has a vector length of 20 mm (indicated by REF.). There is almost no difference in the measured angle between vectors of 20 mm and 10 mm. At lower vector lengths, the measured angle decreases. This effect is more pronounced if the vector length is reduced further. Vector lengths of 2 mm record the largest improvement with a 13% reduction of curling angle α, as compared with the curling angle of the reference part.
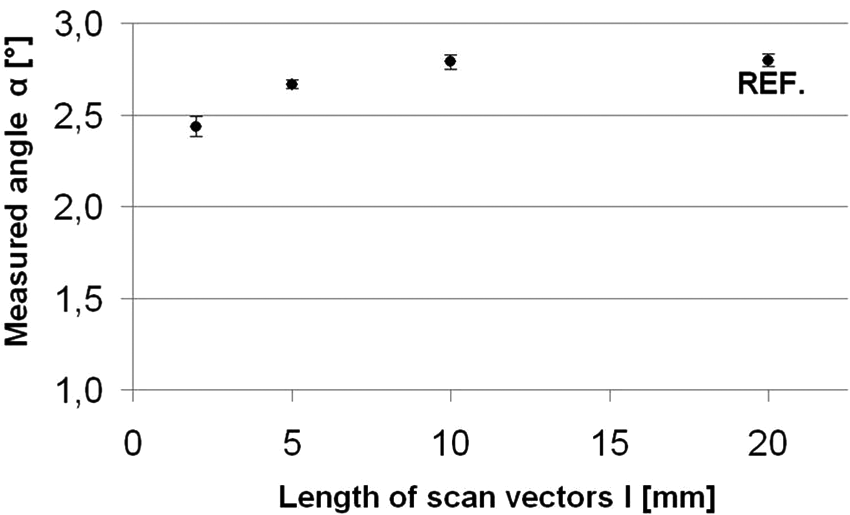
Influence of vector length (l) in the x-direction on curling of Ti–6Al–4V test parts.
Orientation of the scan vectors
To see the influence of the orientation of the parallel scan vectors on the measured angle α, different test parts are made on the KUL-SLM machine, in which the angle β between the parallel scan vectors and the measurement datum (x-direction) changes from 0° (reference) to 90°. Figure 9 illustrates this rotation for 45° and 90°.
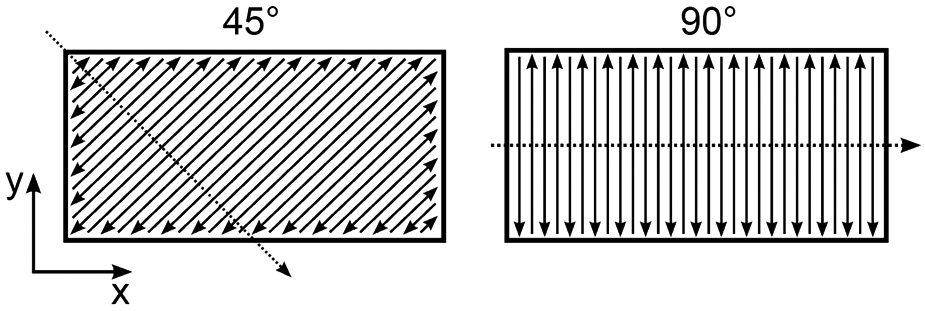
Scan pattern to investigate the orientation β of the scan vectors.
The measured curling angle α decreases as the rotational angle is changed from 0° to 90° (Figure 10). The bending of the test part reduces by 59% if the scan vectors are oriented 90° from the curling measurement datum. If the parallel scan vectors are layer-wise alternated (β = 0° – 90°), the reduction of the measured angle is found to be 45%.
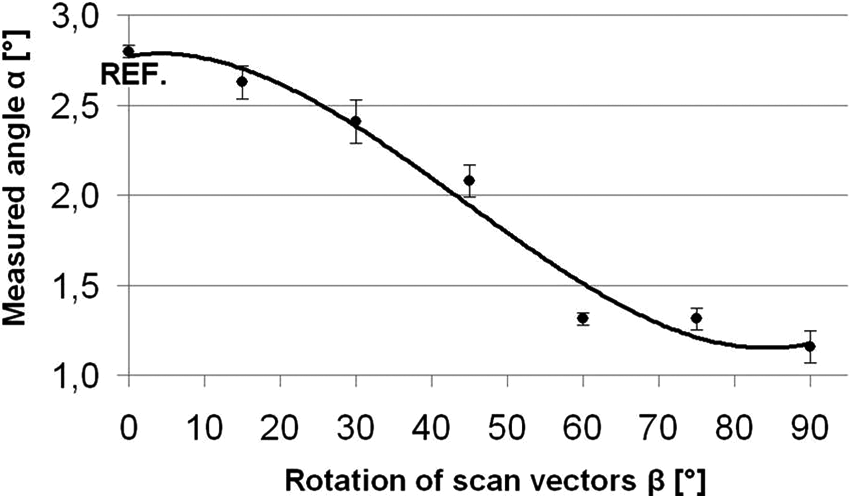
Influence of the orientation β of the scan vectors on the curling of the test part.
Notice that the length of the vectors also changes during this rotation of the scan vectors. Owing to the small difference in curling angle for the test parts with vector lengths of 20 mm and 10 mm (Figure 8), this change in vector length (l) has a negligible influence on the obtained results.
Island scanning
Island scanning is a scan strategy patented by Concept Laser GmbH. This scan strategy divides the area to be scanned into small square islands. The sequence in which the islands are scanned is chosen randomly. The special slicing algorithm embedded in Magics® software allows a change in the size of the islands, the orientation of the islands, and it is also possible to shift the islands in the x- and y-direction between different layers. Figure 11 shows a possible scan pattern for islands of 5 × 5 mm and a 15°γ rotation from the x-direction. Notice that the scan vectors of the islands alternate from parallel to perpendicular to the orientation of the island arrangement (γ).
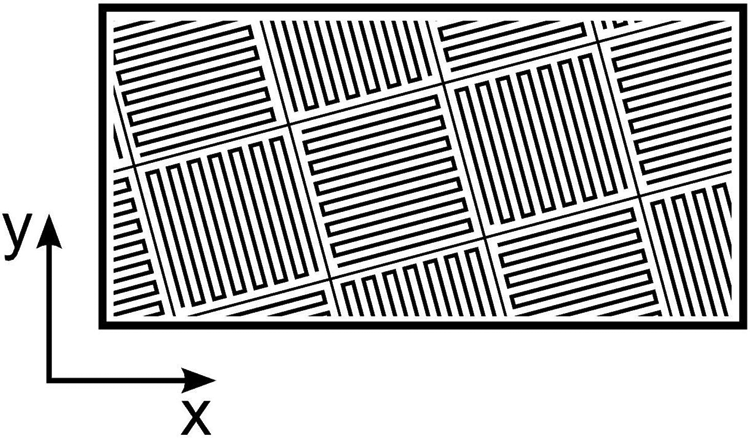
Possible scan pattern for island scanning with islands of 5 × 5 mm and a 15°γ rotation.
The effect of the island size is shown in Figure 12 for islands rotated 15° from the x-direction. The use of island scanning reduces the measured angle α, but the size of the islands does not seem to influence the results. Figure 13 illustrates the effect of the rotation γ for islands of 5 × 5 mm. If the rotation γ is 45° instead of 15°, the measured angle further decreases. Island scanning with islands of 5 × 5 mm, rotated 45° from the x-direction reduces the measured angle by 36%.
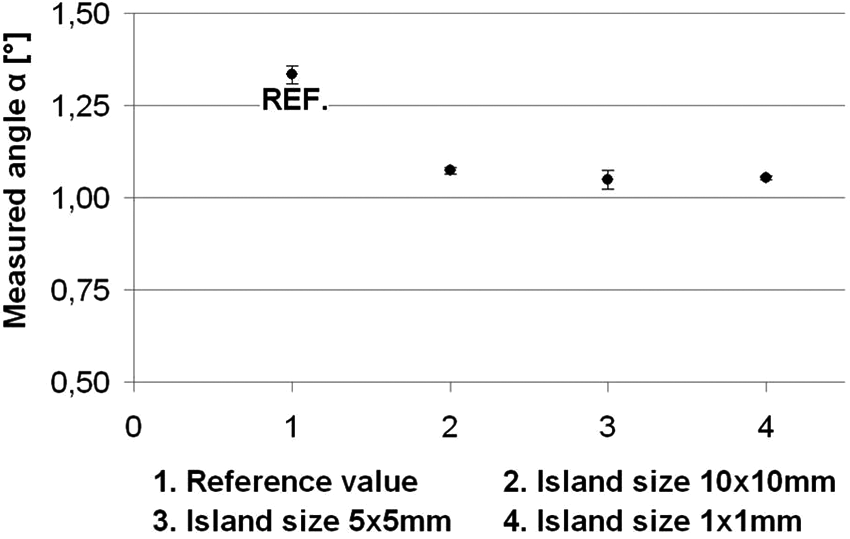
Results of island scanning with different island size on the Concept Laser machine.
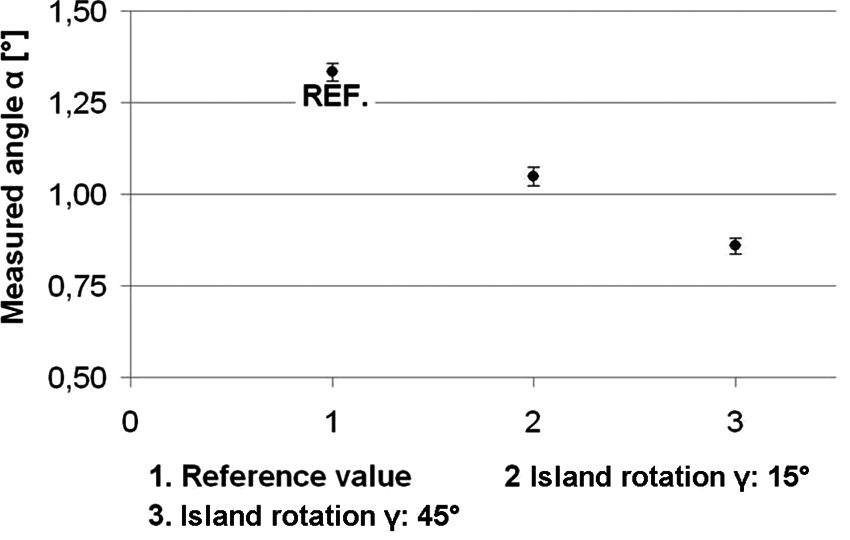
Results of island scanning with different island orientations γ on the Concept Laser machine.
Process changes
Post-scanning
Post-scanning means re-scanning a melted and consolidated layer: each layer is first melted using the reference parameters given in Table 3. Then the layer is re-scanned with the same scan pattern and spot size. The results for post-scanning of Ti–6Al–4V parts with different scan speeds on the KUL-SLM machine are shown in Figure 14. In this figure, the value at 0 mm/s is the reference value without post-scanning (SLM scan speed of 225 mm/s).
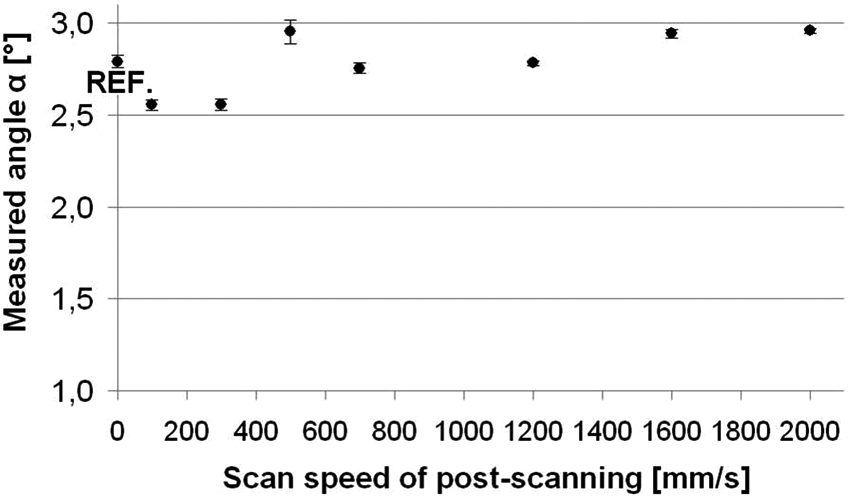
Results of post-scanning with different scan speeds on the KUL-SLM machine.
Only the low scan speeds, involving remelting, reduce the measured angle slightly. A machine using a post-scanning speed of 100 mm/s gives the maximum reduction of 8%. Also some 316L test parts were produced on the Concept Laser M3 Linear machine, but none of these parts showed any noticeable reduction in curling angle. 14
Pre-scanning
When pre-scanning is applied, the laser first sinters the powder material, before melting the material completely with the reference parameters of Table 3 (Ti–6Al–4V and 225 mm/s). The results for pre-scanning with 800 mm/s and 1600 mm/s speeds and a constant laser power of 42 W on the KUL-SLM machine are presented in Figure 15. The value at 0 mm/s is the reference value without pre-scanning. Pre-scanning reduces the measured angle α only slightly, with a maximum reduction of 6% obtained at 800 mm/s.
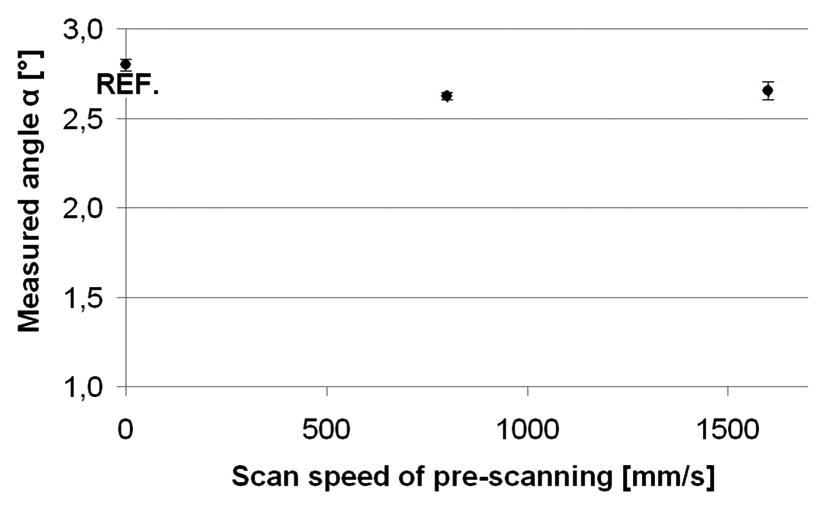
Results of pre-scanning with different scan speeds on the KUL-SLM machine.
Different layer thickness
Larger layer thicknesses can be used to increase the production rate of the process. However, the improvement in the productivity is limited as the layer thickness cannot exceed the melting depth. If the powder layer is too thick, the laser beam will not be able to fully penetrate and melt it, inducing unwanted porosities that affect the mechanical properties in an undesired way. Other process parameters (e.g. scan speed and scan spacing) are influential in optimizing the layer thickness for productivity. Since the stress normal to a pore is zero, porosities tend to decrease the residual stresses.
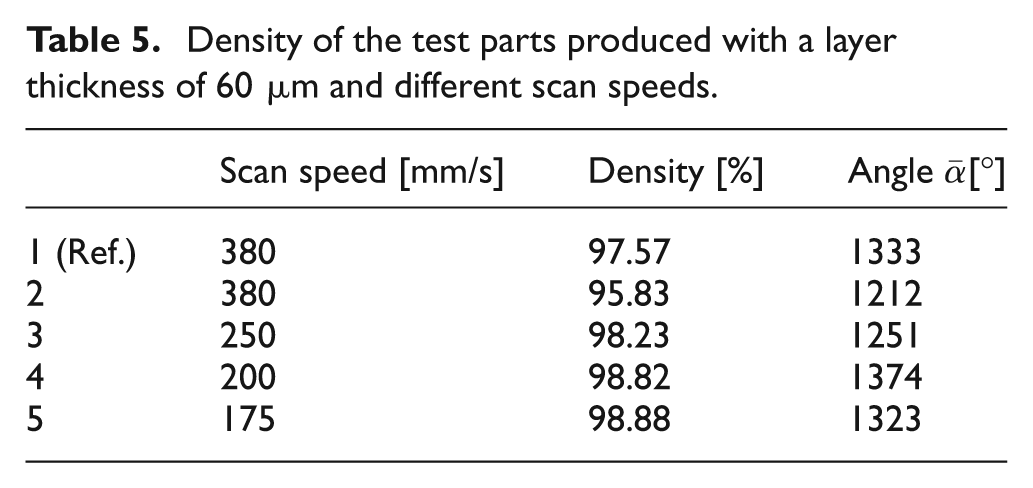
The scan speed needed to produce optimal density parts was not known for layer thicknesses other than 30 µm. Therefore, multiple test parts with a layer thickness of 60 µm but with different scan speeds (v) were produced on the Concept Laser machine. For each part produced, the curling angle is measured (Figure 16). Also the part densities are measured with the Archimedes weighting method (Table 5) and the cross-sections are investigated by an optical microscope (Figure 17). It is noted that Figure 17(a) has more porosity than approximately 4%. Recent studies at our laboratory have shown that the Archimedes method overestimates the densities, since this method also measures the weight of loose powder particles that are entrapped in the closed porosities. Nevertheless, the densities can be compared with one another.
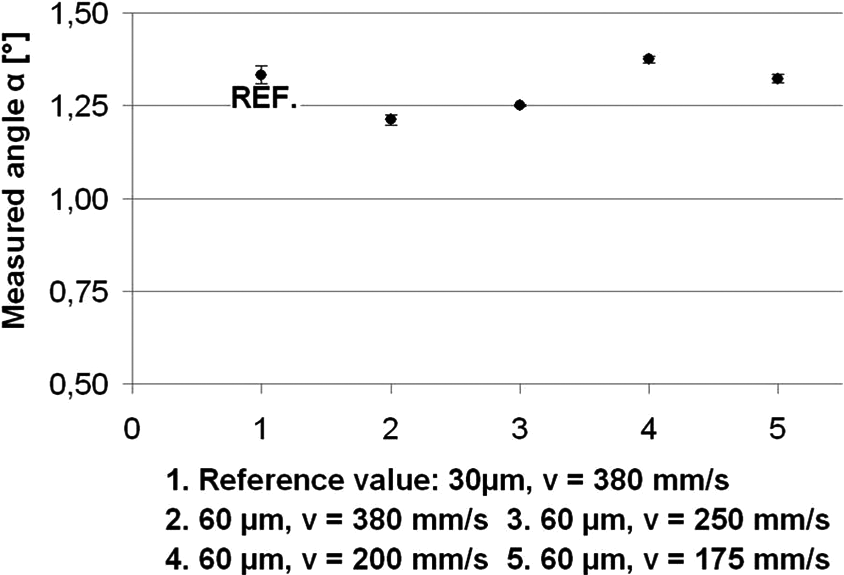
Influence of layer thickness and scan speed on the curling of the test part.
Density of the test parts produced with a layer thickness of 60 µm and different scan speeds.

Optical microscope images of cross-sections of 60 µm layer thickness parts. (a) v = 380 mm/s, (b) v = 175 mm/s.
A low scan speed is expected to heat up more material around the laser spot and to reduce in this way the temperature gradient and related thermal stresses. Contrary to this expectation, Figure 16 shows only a decrease in the curling angle for the higher scan speeds of 250 mm/s and 380 mm/s. Since part number 3 (250 mm/s) has a rather high density value, the lower curling angle for its scan speed cannot be as a result of stress relaxation caused by a large amount of pores in the part. It seems to be difficult to compare the influence of layer thickness on thermal stresses without taking into account the combined influence of part density and scan parameters (in this case the scan speed) to achieve this density. On the other hand, it can be stated that the measured angle of the test part with a density closest to the density of the reference part (part number 3) and a layer thickness of 60 µm gives a reduction of 6%.
Preheating of the base plate
In order to investigate the influence of preheating on residual stresses, the base plate is heated to 180 °C. This resulted in a reduction of 10% of the measured angle of curvature of the SLM part.
Heat treatment
Heat treatments relieve the residual stresses developed during fabrication. 15 Figure 18 shows the temperature cycle that is applied to a Ti–6Al–4V reference part on the baseplate, produced on the KUL-SLM machine (Table 3). This heat treatment reduces the measured angle by 80%. Notice that heat treatments are post-processing techniques allowing the reduction of thermal stresses, but cannot be used to avoid thermal cracking during the building of a part.
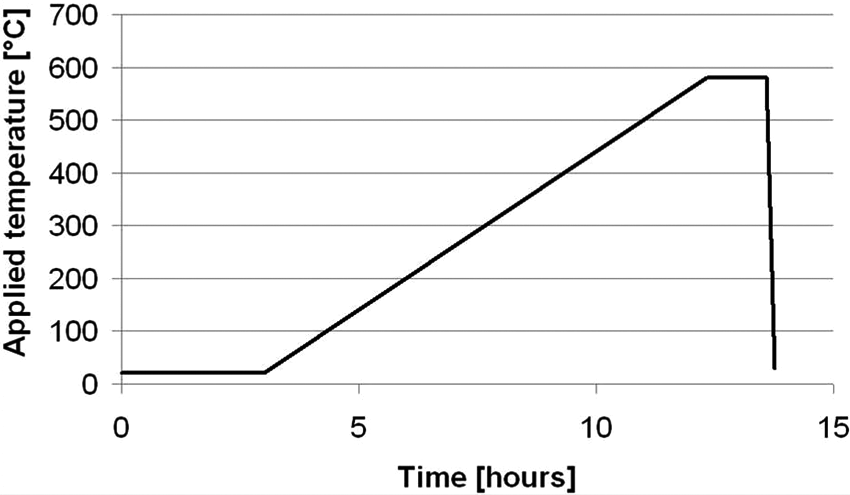
Temperature cycle for heat treatment.
Discussion
The BCM is developed and used as a novel analysis method to investigate the thermal stresses formed during SLM. The method can be used to assess and qualitatively compare thermal stresses in other layered manufacturing processes that use a base plate, like fused deposition modelling (FDM), laminated object manufacturing (LOM), etc.
The experiments revealed that scanning with short scan vectors reduces the thermal stresses. Tests with Ti–6Al–4V demonstrated that if the length of the scan vectors is 2 mm instead of 20 mm, the measured angle of curvature produced after cutting the part from the base plate is reduced by 13%. Increasing the process temperature by preheating the base plate up to 180 °C reduces the curling angle by 10%. Both results indicate that changes which lower the thermal gradients reduce the thermal stresses: shorter scan vectors experience a smaller temperature gradient owing to the higher remnant heat of the previous scan line. Preheating the base plate also reduces the temperature gradient during scanning. These findings are in agreement with the TGM described in literature (see ‘Mechanisms of thermal stresses in SLM’ section), which indicates the reliability of the BCM.
The tests in ‘Orientation of the scan vectors’ and ‘Island scanning’ show that the magnitude of the thermal stresses differs as the angle β between the scan vectors and the curvature measurement datum (x-direction) changes. Thermal stresses in the direction perpendicular to the scan vectors are lower than thermal stresses parallel to the scan vectors. Thermal stresses in a particular direction can be reduced by optimal choice of the orientation of scan vectors. Nickel et al. 5 observes similar results by making a thermomechanical model and doing similar experiments to investigate the relation between thermal stresses and deposition patterns in rapid manufacturing. Again the reliability of the BCM is indicated by comparing the obtained results with results from literature.
Notice that using the effect of scan orientation simply moves the problem to another axis. In order to avoid thermal deformation, one has to orientate the scan vectors always to the direction with the highest resistance against that deformation (i.e. highest stiffness). On the other hand one has to keep in mind that if thermal stresses cannot be tempered during production, they can induce cracks before the part is completed.
Post-scanning and pre-scanning with the same laser beam spot size and the same scan pattern could only reduce the measured angle by 8% and 6%, respectively. These reductions are considered to be relatively low because the same mechanism that induces the high thermal stresses during the melting step will induce thermal stresses during the post-scanning and pre-scanning step.
The influence of the stress reducing strategies on the mechanical properties is only partially studied. For example, Yasa 16 demonstrated the effect of post-scanning with 316L stainless steel on toughness by using Charpy impact tests. The results show that applying post-scanning (i.e. re-melting of every SLM layer with the parameters utilized during SLM) improves toughness because it reduces part porosity. During SLM of metals, the density of the parts is the most important metallurgical parameter that determines the mechanical properties. The SLM parameters used to produce the reference parts (see Tables 3 and 4) are optimized for density. It is observed that during the tests performed in this article (except the tests with different layer thickness, see ‘Process changes’) the density of the parts produced is not less than the densities of the reference parts. The influence of stress reducing strategies (e.g. furnace treatment) on other metallurgical parameters (e.g. undesirable carbide formation) is still open for future research.
Other than optimizing the bridge geometry (i.e. an overhang structure) for repeatability, the influence of geometry on thermal stresses during SLM is not thoroughly investigated in the scope of this study. Other geometries may be employed to assess the residual stresses qualitatively. Alternatively, thermomechanical models can be used if validated correctly.
The proposed method gives only information about thermal stresses after the production of a part while it is still connected on the base plate. No direct information about what happens during production is given. The stress reducing strategies investigated in this article are strictly limited to the case where the part does not fail during production. Thermal, mechanical or thermomechanical models can be used to correlate thermal stresses during and after the production of a part. For example, the TGM model (see ‘Mechanisms of thermal stresses in SLM’) states that high stresses during laser irradiation leads to more plastic deformation, and more plastic deformation during production leads to higher thermal stresses after production. The TGM model states that stresses during and after production have opposite signs and that their absolute values are more or less proportional. Other models (see ‘Modelling of thermal stresses in SLM’) can be used to investigate the influence of other effects, e.g. part geometry, on thermal stresses during and after production.
Withers and Bhadeshia 11 explain why it is important to consider the sampling volume characteristics of stress measurement techniques and the types of stresses that may be of importance, before selecting one method over another. The BCM can only be used to qualitatively assess macro-stresses (type I), which vary continuously over a large distance. No residual stresses that vary over the grain scale (type II or inter-granular stresses) or atomic scale (type III) can be assessed.
According to Kandil et al. 12 numerous publications have been produced on the subject of residual stress and significant advances have been made recently to improve current measuring techniques. However, a number of important issues still remain, including the uncertainties in the measurement, reliability and interpretation of results and, for many techniques, the general lack of standards. The current article describes a way to assess the curling angle of a bridge structure with defined geometry, after removal by EDM from the base plate, as a measure for the residual stresses in the part. The curling angle is measured 10 times by a non-contact vision measuring system (5 times on each side of the part). From the measured data the mean value and standard deviation are calculated with a 95% confidence interval, quantifying the uncertainty in the measurement. As described above, the reliability of the BCM is indicated by comparing the obtained results with results from literature. However, the obtained results can only be interpreted qualitatively.
Summary and conclusion
This article presents a new pragmatic method for stress assessment, namely the BCM. The method uses a standardized technique to assess the angle of curvature α of SLM-made bridge structures cut off from the base plate as a measure for the thermal stresses.
The uncertainties during measurement and the repeatability of the method are determined by statistical analysis. The reliability of the method is indicated by comparing experimental results with findings from literature. Both literature review and performed experiments confirm that changes which reduce the high temperature gradient reduce the thermal stresses. Also, optimizing the orientation of the laser scan vectors can reduce thermal stresses or make their orientation less harmful.
The BCM not only enables a new manner of assessing stresses, but also enables qualitatively comparing stress-reducing strategies: i.e. different laser scan patterns, parameter settings and more fundamental process changes on residual stresses. One can, for example, conclude that the described heat treatment (that resulted in an 80% reduction of measured angle of curvature) reduces the thermal stresses more than optimizing parameters for island scanning (36% reduction of measured angle).
Footnotes
Appendix 1
Appendix 2
Before choosing bridge geometry 2, the following two coherence tests were performed.
Acknowledgements
The authors thank IWT for the support through the SBO project DiRaMaP and the TUBITAK Research Council of Turkey for its financial support.
This research received no specific grant from any funding agency in the public, commercial, or not-for-profit sectors.