
Abstract
Methanol, a versatile carbon-neutral fuel, offers significant potential for reducing greenhouse gas emissions in spark-ignition (SI) engines. This study systematically compares the combustion and emission characteristics of methanol and gasoline under varying compression ratios (CRs) and lean-burn conditions, combining experimental measurements with three-dimensional computational fluid dynamics (CFD) simulations. Experimental results demonstrate that Methanol exhibits superior knock resistance and a higher octane rating than gasoline, enabling stable combustion at CRs up to 15.2. However, its early combustion phase results in a 15% shorter burn duration and 18% higher peak in-cylinder pressure, posing challenges to mechanical durability. Under lean combustion (excess air coefficient (λ) = 1.0–1.8), methanol achieves optimal thermal efficiency at brake mean effective pressure (BMEP) = 1.1 MPa with λ = 1.6, where total hydrocarbon (THC) emissions increase marginally by 8% compared to stoichiometric conditions. CFD simulations reveal localized fuel-rich zones (equivalence ratio > 1.2) and thermal gradients (>250 K reduction in peak temperature at λ = 1.6), directly linking spatial inhomogeneity to THC and nitrogen oxides (NOx) emission trends. Notably, NOx peaks at λ = 1.2 under high loads (BMEP = 1.6 MPa) due to elevated combustion temperatures, despite excess air dilution. This work highlights methanol’s viability in high-compression engines and provides critical insights for optimizing lean-burn strategies, advancing the development of efficient, low-emission methanol engines for carbon-neutral transportation.
Keywords
Introduction
The rapid growth of the automotive industry and the increasing number of vehicles have greatly improved people’s lives and production. However, this has also brought significant challenges such as fossil fuel shortages and global environmental pollution. To address these issues, new technologies such as renewable and clean alternative fuels have gained attention in the automotive industry and are gradually being adopted. 1 Global warming is an undeniable fact closely related to human activities. In the past century, humans have consumed large amounts of oil and coal, increasing CO2 emissions, which not only exacerbate the greenhouse effect but also accelerate the process of global warming, posing a serious threat to human life safety. As global concern about climate change grows, the transportation sector is facing immense pressure to reduce greenhouse gas emissions, and some countries have already established timelines for phasing out conventional vehicles. Although electric vehicles are rapidly developing in some countries, issues with battery technology and the disposal of used batteries have not been effectively resolved. The large-scale use of electric vehicles has limited capabilities to reduce greenhouse gas emissions and may cause new environmental pollution. Therefore, seeking long-term solutions to achieve net-zero greenhouse gas emissions and mitigate global warming has become particularly crucial. 2
Methanol, derived from abundant raw materials, serves as a fuel with high economic value, safety, environmental friendliness, reliability, and applicability, making it an ideal substitute for traditional internal combustion engines.3,4 Compared to traditional gasoline and diesel, methanol contains only one carbon atom and tends not to form soot during combustion. Due to its high oxygen content, methanol is more suitable for lean combustion, which can lower the combustion temperature in the cylinder and inhibit the formation of nitrogen oxides.5–7 If methanol can be used for compression ignition in diesel engines, it might eliminate the need for diesel particulate filters (DPF) and selective catalytic reduction (SCR) systems, thereby reducing both operating costs and emissions.8,9 This could further propel the global internal combustion engine industry towards a low-carbon, environmentally friendly direction. Methanol has been extensively researched and applied in both spark ignition and compression ignition engines.10–12 In the future, as the number of traditional fuel vehicles decreases and carbon-neutral goals are achieved sooner, the use of methanol fuel in engines will inevitably increase. Therefore, research on methanol fuel is highly significant and has broad market prospects for the future. The combustion of fossil fuels produces pollutants and carbon dioxide, adversely impacting global climate change and the development of a green, low-carbon society. 13 Additionally, the uneven global distribution of fossil fuels leads to regional development imbalances and exacerbates regional conflicts, which is not conducive to building a society with a shared future for humanity. With economic development, global automobile production continues to increase, intensifying the consumption of fossil fuels. Therefore, developing renewable alternative fuels is of great practical significance. 14 Utilizing CO2 to synthesize methanol not only reduces the greenhouse effect caused by CO2 but also yields various chemical products and clean fuels, making it a multifaceted innovative approach.
Methanol is an important basic chemical material and fuel. Currently, it is primarily produced from natural gas or coal through syngas. Using coke oven gas to synthesize methanol can convert the surplus coke oven gas into basic chemical raw materials, enhance the comprehensive utilization of coke resources, and reduce environmental pollution from coke oven gas emissions. However, producing methanol from coal or coke oven gas generates wastewater and emissions, causing severe ecological and environmental pollution. The process also emits a significant amount of carbon dioxide, contributing to the greenhouse effect. Therefore, some researchers are exploring biomass to produce methanol to reduce environmental pollution and greenhouse gas emissions. However, the availability of biomass depends on the national conditions of each country. For instance, countries like the USA and Brazil, with less land per capita but higher forest coverage, primarily source biomass energy from corn and sugarcane. Whether using crops like corn and sugarcane or residues like straw and wood, there are ample sources available. This approach is relatively low-cost and avoids ethical issues related to competing with food crops for resources. In recent years, as the concept of carbon neutrality deepens, the technological pathway of hydrogenating carbon dioxide to produce methanol is gaining attention. 15 In the long term, this pathway is also a vital means to achieve carbon neutrality. Converting carbon dioxide into high-value fuels or chemicals represents a process of turning waste into treasure. Using carbon dioxide to synthesize methanol not only reduces the greenhouse effect caused by CO2 but also produces various chemical products and clean fuels. 16 Methanol is not only a high-quality fuel but can also be converted into high-value chemicals like olefins and aromatics.17,18 The widespread application of carbon dioxide hydrogenation to produce methanol will need to leverage photocatalytic, photoelectrocatalytic, or solar energy-driven water electrolysis technologies. In a numerical simulation study conducted by Sahu et al., 19 a comparative analysis of methanol and gasoline engines’ performance was carried out. The results demonstrated that methanol-fueled engines exhibited a 36% increase in indicated thermal efficiency (ITE) compared to gasoline engines. Moreover, when optimized methanol injection timing was utilized, total hydrocarbon (THC), carbon monoxide (CO), and soot emissions were reduced by 58.2%, 68%, and 73.9% respectively. Another study by Balki and Sayin 20 focused on a spark ignition engine fueled with methanol and gasoline, and investigated the effect of varying the compression ratio (CR) from 8 to 9.5 on combustion. The research revealed that the optimum CR was 9, and the combustion efficiency based on methanol fuel exceeded that of gasoline fuel. Wu et al. 21 conducted research on a port fuel injection (PFI) engine and found that when using methanol fuel under idle and lean burn conditions, the indicated thermal efficiency was higher at each excess air coefficient, and the flame development and combustion duration were shorter. For emissions, methanol used in SI and CI engines can reduce CO, NOx, soot, and PM emissions. 22 Xu et al. 23 investigated the effect of methanol injection position on engine combustion and emissions, the results show that the intake manifold injection also could reduce the in-cylinder pressure and NOx emissions.
Lean combustion has emerged as an effective approach for improving engine thermal efficiency and reducing emissions. It achieves this by reducing combustion temperature, heat transfer losses, pumping losses, and specific heat ratios.24–27 Wang et al. 28 found that, at 2400 RPM (revolutions per minute) and 12 bar with the same dilution ratio, excess air dilution demonstrated better economy compared to exhaust gas recirculation (EGR) dilution. The effects of multiple-injection on combustion characteristics were evaluated by Duan et al. 29 They found the cycle-to-cycle variations were significantly improved by multiple-injection. The thermal efficiency and NOx emissions also could be improved simultaneously. Gong et al. 30 conducted a comprehensive analysis and comparison of the effects of excess air ratio and EGR rate on the combustion and emissions behavior of gasoline direct injection (GDI) engines with simulated EGR (carbon dioxide) under low load conditions. The study aimed to evaluate the difference between actual EGR and simulated EGR (CO2). The findings indicated that simulated EGR (CO2) had little effect on CO emissions under lean combustion conditions and HC emissions under stoichiometric conditions. However, NOx and soot emissions significantly decreased with increasing EGR rate under different forms of EGR and excess air ratios.31,32 Additionally, at a fixed EGR rate, the smoke emission of simulated EGR (CO2) was higher than the actual emission at any excess air ratio. The effects of the injection timing, EGR ratio, engine speed and load on unregulated emissions were studied by Zhang et al. 33 In their study, the formaldehyde emission mechanism was studied by experiment and simulation. Formaldehyde emission is produced during the post-oxidation of unburned methanol. Jiang et al. 34 investigated the use of two biofuel candidates, 2-methylfuran (MF) and 2,5-dimethylfuran (DMF), to verify the effectiveness of the stratified lean combustion strategy in spark ignition engines in improving fuel economy by reducing pumping losses and heat losses. The study reported a 6.3% increase in the thermal efficiency of the engine using lean combustion technology. Methanol, with its 50% oxygen content, fast flame propagation speed, and high lean burn limit for air/fuel mixtures, is particularly suitable for applications with high fuel dilution ratios. Moreover, and equally important for combustion efficiency, methanol is characterized by a substantially higher laminar flame speed than gasoline under typical engine-relevant conditions.35,36 The combination of exceptional knock resistance and inherently faster flame propagation makes methanol a uniquely promising fuel for achieving high-efficiency engine operation. 37 Research by Zhen et al. 38 and Li et al. 39 indicates that methanol engines can still operate effectively even when the dilution ratio exceeds 30%. It is evident from the literature that faster combustion speeds lead to higher combustion stability limits.40–43 However, the limitations of this combustion process, especially for methanol, aren’t well understood. 44
Based on the aforementioned analysis, the utilization of methanol fuel and the adoption of lean combustion technology have been identified as effective means to improve the thermal efficiency and reduce emissions of spark ignition engines. 45 Since methanol molecules inherently contain oxygen atoms, in lean combustion mode, the presence of these oxygen atoms results in differences in the fuel’s adaptability to the lean combustion process and the formation of emission pollutants compared to conventional gasoline. Furthermore, for Miller cycle engines, advancing the intake valve closure can reduce the effective compression ratio to suppress knock. The high-octane number of methanol further enhances this advantage, allowing the engine to adopt a higher geometric compression ratio, which has been rarely reported in previous studies. Consequently, this study aimed to further explore the thermal efficiency potential of direct-ignition methanol engines in passenger cars and investigate the performance of methanol fuel under lean combustion conditions. The combustion characteristics of a methanol engine employing lean combustion technology were studied at various loads. To further validate the experimental findings and elucidate the underlying mechanisms of the combustion and emission characteristics, numerical analysis was employed. These simulations complement the experimental data by visualizing in-cylinder equivalence ratio and temperature distributions, offering a deeper understanding of the underlying physical and chemical processes. The objective of this research is to provide data support and engineering references for the development of efficient methanol engines.46,47
Test object and test method
Test object
The investigation was conducted using a four-cylinder SI Miller Cycle engine rated at 140 kW with 5500 RPM. Figure 1 illustrates the engine setup, subsystems used in the investigation, and the engine specifications are detailed in Table 1. The experimental engine features a compression ratio of 11.5:1, adjustable through piston replacement, with increased piston crown protrusion achieving higher compression ratios. Custom pistons are used to achieve a maximum compression ratio of 15.2:1 in the study. Because of the poorer lubrication properties of the experimental methanol fuel, customized methanol injectors replace the original gasoline injectors. Additionally, due to differences in fuel calorific values, the flow rates of the methanol injectors and high-pressure fuel pump are recalibrated. The engine features a high-energy ignition system delivering up to 110 mJ of energy, coupled with an open-loop electronic control unit (ECU) for precise ignition timing control within a 0.5°CA crankshaft angle range.

Schematic diagram of the experimental setup.
Engine technical parameters.

During the experiments, an alternating current dynamometer is employed to load the engine under various conditions, while an airflow meter is used to measure the intake airflow. To ensure data reliability, a long straight pipe is installed before the airflow meter to maintain a uniform airflow. Under each operating condition, the AVL 753 transient fuel flow meter is utilized to measure fuel consumption, and the AVL 735 fuel cooling unit is employed to cool the fuel to mitigate the impact of fuel temperature fluctuations on the test results. The intake temperature is measured using a temperature sensor fixed on the intake manifold. A piezoelectric pressure sensor is mounted above the cylinder head to measure in-cylinder pressure. A Kistler angular encoder is installed on the camshaft to precisely capture the engine’s angular position, enabling the derivation of changes in cylinder pressure based on crankshaft angle. The pressure in the intake manifold is measured based on inputs from pressure sensors installed on the intake manifold. Before each experiment, to ensure the reliability of the data, the engine undergoes a cylinder leakage test to obtain the compression pressure within the combustion chamber and to check for any leaks. The experiments utilize a high-speed data acquisition system to capture in-cylinder pressure at each interval of crankshaft rotation. For each operating condition, data from 200 cycles are collected and processed to obtain the average pressure-crank angle values. The collected pressure data are also used to calculate peak in-cylinder pressure, indicated mean effective pressure (IMEP), ignition delay, peak pressure occurrence time, combustion duration, and maximum pressure rise rate. Additionally, the relationship between average cylinder pressure and crank angle is employed, using the first law of thermodynamics, to calculate the cumulative heat release and heat release rate. The excess air coefficient (λ) was measured using the ETAS ES430 and Bosch LSU 4.8-line oxygen sensor. The HORIBA 7400 exhaust gas analyzer was used to measure the concentrations of exhaust pollutants during the experiments.
Test and data analysis method
The experiment explored methanol lean combustion under typical operating conditions: 2500 RPM, brake mean effective pressures (BMEPs) of 0.6, 1.1, and 1.6 MPa. Throughout the test, boundary conditions including inlet air temperature, intercooling temperature, oil water temperature, oil pressure, and ambient temperature were consistently maintained. Various dilution ratios were controlled by adjusting λ. Ignition timing was adjusted to maintain engine operation near the detonation boundary, setting CA50 at 8 ± 2°CA ATDC to optimize thermal efficiency. Knock was assessed by the maximum cylinder pressure fluctuation, identified using a 4 kHz high-pass filter on the cylinder pressure curve. To protect the engine, ignition timing was delayed to ensure the maximum explosion pressure remained below 16 MPa whenever it exceeded the threshold. The combustion duration, CA10-90, was defined as the crankshaft angle between 10% and 90% cumulative heat releases, with CA50 defined as the angle at which 50% of heat release occurs. Heat transfer and unburned losses were studied and calculated by modeling the internal combustion engine as a steady-state, open system with balanced flow. Total fuel energy was categorized into five components: brake thermal efficiency, unburned losses, exhaust losses, heat transfer losses, and friction losses. The heat balance diagram of methanol internal combustion engine is shown in Figure 2.

Schematic diagram of the thermal balance of an internal combustion engine.
The calculation method for total fuel heat release power is as follows:

Wherein, Q Fuel is the total fuel combustion heat release power (kW), RATE Fuel is the fuel consumption per unit time (kg/h), and LHV Fuel is the fuel low calorific value (MJ/kg).
The calculation method for unburned power loss is as follows:
Wherein, Q Ub is the unburned power loss (kW), M THC and M CO are the direct flow emissions of total hydrocarbon and carbon monoxide (g/h), and LHV CO is the low calorific value of carbon monoxide (MJ/kg).
The friction loss is calculated as follows:
Wherein, Q FL is the friction loss (kW), IMEP is the average indicated pressure (bar), and BMEP is the average effective pressure (bar).
Total exhaust loss is calculated by subtracting exhaust enthalpy from intake enthalpy. Intake and exhaust enthalpies are determined by intake and exhaust temperatures, gas composition, and flow rate. Intake and exhaust temperatures are calculated based on manifold temperature.
The calculation method of inlet flow enthalpy is as follows:

Wherein, Q Air is the intake flow enthalpy (kW), Cp Air is the constant pressure specific heat capacity of the intake air (J/kg K), TIN is the intake manifold temperature (°C), and M Air is the intake dry air mass flow (kg/h).
The calculation method of exhaust flow enthalpy is as follows:
Wherein, Q Exh is the exhaust flow enthalpy (kW), Cp Exh is the constant pressure specific heat capacity of the exhaust (J/kg K), T Exh is the exhaust manifold temperature (°C), and M Exh is the wet mass flow rate of the exhaust (kg/h).
Heat transfer loss cannot be directly measured because heat transferred in the cylinder is ultimately dissipated through coolant, oil, and radiation. Heat transfer loss is calculated as the difference between total energy and the sum of effective thermal efficiency, unburned losses, exhaust losses, and friction losses. Thus, the calculation method for heat transfer loss considers both heat transfer within the cylinder and in the air duct. The effective thermal efficiency of the engine, also known as brake thermal efficiency, is calculated using the engine’s fuel consumption rate. Data collected during the tests represented an average over a stable 60-s period to ensure calculation reliability. Fluctuation range of controllable boundary conditions was maintained between 3% and 6% to minimize measurement errors. Adhering to energy conservation principles and optimizing the test bench kept calculation errors below 10%, meeting engineering application standards.
Results and discussion
Effect of compression ratio on the combustion characteristics of the methanol engine
Figure 3 presents comparisons of in-cylinder pressure and heat release rate under different load conditions and compression ratios. It can be observed that when fueled with gasoline, significant variations in in-cylinder pressure and heat release rate exist among different compression ratios. Under low-load conditions, since the combustion process is not limited by knock, increasing the compression ratio leads to an increase in both the peak in-cylinder pressure and peak heat release rate. However, under high-load conditions, due to knock limitations, the combustion phase is significantly retarded at higher compression ratios. Consequently, the combustion process primarily occurs during the expansion stroke as the piston descends, resulting in a decrease in the peak in-cylinder pressure instead.

Comparison of combustion characteristics of under different loads with various compression ratios. (a) BMEP = 0.5 MPa, (b) BMEP = 1.5 MPa.
Figure 4 provides a comparative analysis of combustion phasing, represented by the crankshaft angle at 50% of the cumulative heat release (CA50), under varying engine loads at two different compression ratios: 11.5 and 14.8. As observed, the trend indicates that CA50 values generally increase with rising engine load across both compression ratios, especially for gasoline with CR = 11.5. For the engine with a compression ratio of 11.5, the CA50 values exhibit a relatively stable increase, indicating a modest retard in combustion phasing as engine load increases. Specifically, the CA50 values remain nearly constant at lower loads and begin to rise as the load exceeds 1.2 MPa for gasoline fuel. However, the load where CA50 is significantly delayed when using methanol fuel is approximately 1.8 MPa, and the delay in CA50 is notably less than that of gasoline fuel. Conversely, the engine with a compression ratio of 14.8 shows a similar trend but with slightly more pronounced variations in combustion phasing at higher engine loads. Notably, the CA50 values for this higher compression ratio are consistently higher compared to the lower compression ratio at corresponding loads, particularly noticeable beyond 1.5 MPa, where the CA50 values rise more steeply. Moreover, even at CR = 15.2, the CA50 when using methanol fuel advances compared to that at CR = 11.5 with gasoline fuel, indicating methanol’s greater suitability for higher compression ratios.

Comparison of CA50 values under varying loads and compression ratios.
Figures 5 and 6 represent two critical aspects of combustion characteristics in a methanol-fueled ignition gasoline engine at varying compression ratios: burn duration and ignition delay. The burn duration, primarily governed by the flame propagation speed, as seen in Figure 5, reflects the duration of combustion and thus the speed at which the fuel-air mixture is consumed. It is observed that for both compression ratios with methanol, the burn duration exhibits a non-linear response to changes with load increasing. Initially, the duration decreases as the BMEP increases from 0 to around 1.2 MPa, suggesting a more efficient combustion process at slightly higher loads, especially for gasoline fuel below the load of BMEP = 0.8 MPa. As the load continues to increase, the burn duration increases significantly, particularly in engines with higher compression ratios, indicating slower combustion as the engine operates under higher load conditions. This could be attributed to more complex interactions of flame propagation and retarded combustion phasing at higher loads.

Comparison of burn duration under various loads with different compression ratios.

Comparison of ignition delay under various loads with different compression ratios.
Crucially, methanol consistently exhibits shorter burn durations than gasoline across all tested loads and compression ratios. This is fundamentally attributed to methanol’s significantly higher laminar and turbulent flame speeds, a well-established characteristic of this oxygenated fuel. The faster flame propagation in methanol enables quicker combustion completion.
The ignition delay, shown in Figure 6, represents the period from the point of ignition until 10% of the cumulative heat release has occurred. This figure reveals a generally decreasing trend in ignition delay as the load increases, more prominently for the higher compression ratio. The decreasing trend suggests that as the load increases, the conditions within the combustion chamber become more conducive to faster auto-ignition, likely due to higher temperatures and pressures. This is particularly evident in the engine with a CR of 14.8, where the decreased ignition delay aligns with a more rapid initiation of combustion under higher compression conditions. Furthermore, at BMEP < 1 MPa, under the same compression ratio conditions, the ignition delay of gasoline fuel is significantly longer compared to methanol fuel. This is primarily because methanol molecules contain oxygen atoms, which participate in chemical reactions during combustion, thereby shortening the ignition delay to some extent. As the load increases, cylinder temperature rises, making temperature the primary factor influencing ignition delay. At this point, the difference in ignition delay between gasoline and methanol gradually diminishes.
Figure 7 presents a comparative analysis of the maximum combustion pressure (P max ) at varying engine loads for two different compression ratios. P max is crucial as it directly relates to the mechanical stress on engine components and overall engine durability. Both curves demonstrate a linear increase in P max with increasing BMEP, indicating that higher engine loads result in higher combustion pressures. At BMEP above 1.2 MPa, due to excessive delay in combustion phase when using gasoline fuel, combustion primarily occurs during the expansion stroke, resulting in a significantly lower peak pressure compared to methanol fuel. The engine with a higher compression ratio consistently shows higher P max values at equivalent BMEP levels compared to the engine with lower CR. This is expected since higher compression ratios generally enhance the combustion process, leading to higher peak pressures. It is worthy to note that the engine with a CR of 14.8 approaches the threshold of mechanical strength at a BMEP of approximately 2 MPa, suggesting that while the increased compression ratio improves combustion efficiency and power output, it also brings the engine closer to its structural limits.

Comparison of peak fire pressure under various loads with different compression ratios.
Combustion and emission characteristics for methanol engine under lean operating conditions
Because of methanol fuel’s higher-octane number, knocking can be effectively suppressed under high compression ratio conditions, offering potential advantages for improving thermal efficiency. This section analyses the lean combustion and emission characteristics of methanol engines under high compression ratio conditions, building on previous studies.
Combustion characteristics
Figure 8 depicts the effects of λ on combustion phasing under different engine loads. At BMEP = 0.6 MPa and BMEP = 1.1 MPa, the CA50 remain relatively stable across the entire range of λ, showing minimal fluctuations. At BMEP = 1.6 MPa, the trend shows an increase in CA50 as λ increases up to 1.3, peaking sharply at this point, and then decreasing thereafter. Crucially, at BMEP ≤ 1.1 MPa where CA50 remains nearly constant despite increasing λ, this is achieved by actively advancing ignition timing to compensate for slower combustion velocity. The observed peak around λ values of 1.4 indicates the necessity of adjusting combustion phasing to mitigate the risk of knocking caused by higher oxygen content in the mixture. As λ further increases beyond this threshold, resulting in a leaner mixture, the combustion reaction rate slows due to reduced fuel concentration, thereby diminishing the risk of detonation.

Comparison of CA50 variation with λ under different loads.
The relationship between the burn duration of combustion and the λ across different engine loads has been shown in Figure 9. As depicted in this figure, at BMEP = 0.6 MPa, the burn duration gradually increases as λ rises from stoichiometric to 1.9, showing a steady extend of the combustion period. This trend suggests that at lower engine loads, the combustion becomes progressively slower as the mixture becomes leaner, likely due to decreased fuel concentration which limits the reaction rates. While, under higher loads, the combustion duration tends to decrease initially and then increase with the mixture becoming leaner. At λ around 1.3, combustion duration is minimized due to higher oxygen concentration in the mixture and favorable temperature and pressure conditions in the cylinder. With further increases in λ, combustion rate slows due to increased mixture dilution.
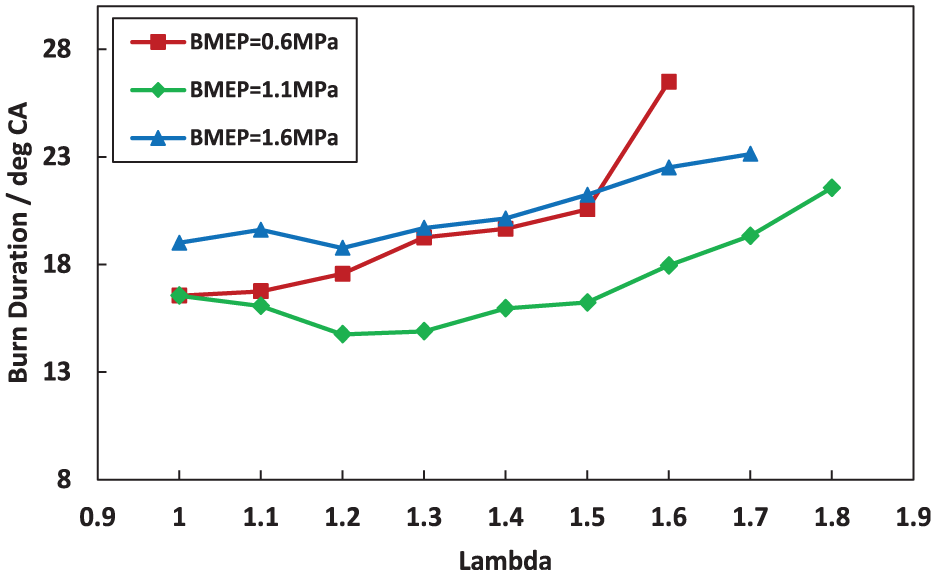
Comparison of burn duration variation with λ under different loads.
The increase in CoV of IMEP with λ in Figure 10, particularly noticeable at higher λ values, highlights the challenges associated with maintaining combustion stability in lean-burn conditions. As λ increases, the fuel-air mixture becomes leaner, which can lead to difficulties in achieving consistent ignition and complete combustion, as evidenced by the increased variation in IMEP. This is particularly problematic at lower loads (BMEP = 0.6 MPa) where the temperature has been lower and thus the sensitivity to mixture inconsistencies are greater. The sharp rise in CoV at a λ of 1.6 under the lowest load suggests a threshold beyond which the mixture is too lean to sustain stable combustion without significant variability in performance.

Comparison of CoVimep variation with λ under different loads.
Emission characteristics
Engine gas emissions are directly measured using the HORIBA MEXA-ONE gas analyzer. Figure 11 provides an overview of how lean combustion affects NOx, CO, and THC emissions in methanol engines.

Emission characteristics under various λ. (a) CO, (b) THC, and (c) NOx.
Generally, CO and THC emissions are lower at the higher BMEP of 1.1 MPa compared to the 0.8 MPa condition. Figure 11(a) illustrates that CO emissions are mainly influenced by the equivalence ratio and combustion temperature. A slight increase in the excess air coefficient enhances CO oxidation by raising the oxygen concentration in the cylinder. However, this increase in excess air coefficient lowers the combustion temperature. Additionally, the increased in excess air coefficient lowers the combustion temperature. As a result, CO emissions initially decrease and then begin to rise, reaching their lowest point at Λ of 1.1. However, under the 1.6 MPa condition, more methanol fuel undergoes combustion and heat release, leading to higher combustion temperatures and lower overall CO emissions compared to the 0.6 MPa condition. The lowest recorded CO values are 588 PPM for the 1.6 MPa condition and 600 PPM for the 0.6 MPa condition. Figure 11(b) demonstrates that THC emissions are influenced by the amount of fuel involved in combustion and the combustion temperature, which increases with larger loads. Consequently, THC emissions tend to be lower under the 1.6 MPa condition compared to lower loads. However, as the dilution ratio increases and extends the combustion duration, THC emissions caused by flame quenching also increase. Thus, at λ of 1.6, the THC emissions are 1020 PPM for the 1.6 MPa condition and 2017 PPM for the 0.6 MPa condition. However, as shown in Figure 11(c), NOx emissions increase under the 1.6 MPa condition, despite the potential to extend the lean burn limit to λ of 1.7, suggesting room for further NOx reduction. Unlike the 0.6 MPa condition, NOx emissions peak at λ of 1.2 under a BMEP of 1.6 MPa. This is due to increased load, leading to a higher concentration of completely burned methanol in the cylinder, resulting in a more significant temperature increase effect compared to the cooling effect of air.
To elucidate the experimental emission trends, three-dimensional simulations were conducted under stoichiometric and lean (λ = 1.6) conditions. In order to ensure the reliability of numerical simulations, the CFD model developed in this study was subjected to rigorous validation against experimental measurements. Figure 12 presents a comparative analysis between the in-cylinder pressure curves derived from the current CFD simulations and those obtained through experimental procedures. Additionally, this figure illustrates the correlation of crank angle positions corresponding to 50% fuel mass burned fractions, as predicted by the CFD model versus experimental observations. Such validation efforts establish the necessary credibility for subsequent in-depth analyses based on the CFD framework, thereby demonstrating the suitability of the numerical approach in capturing key characteristics of the combustion process. Overall, the good agreement between simulation and experimental results indicates successful validation of the model, confirming its reliability for analyzing in-cylinder mixture concentration and temperature distributions.

Comparison of in-cylinder pressure and crank angle positions at 50% fuel mass burned fractions between CFD simulation and experiments.
The equivalence ratio distribution (Figure 13) reveals localized fuel-rich zones under λ = 1.6, which directly correlates with the observed increase in THC emissions compared to λ = 1.0.

Effect of λ on in-cylinder equivalence ratio distribution. (a) λ = 1.0, (b) λ = 1.2, (c) λ = 1.4, and (d) λ = 1.6.
Conversely, Figure 14 illustrates the temperature field evolution in the cylinder from −5°CA to 15°CA, with representative slices at −5°CA, 5°CA, and 15°CA. The results a reduction in peak combustion temperatures by at least 250 K at λ = 1.6, aligning with the significant reduction in NOx emissions measured in Figure 14. Further, the numerical analysis reveals a non-linear thermal response across λ. Specifically, at λ = 1.2, the temperature nearby the spark plugs peaks at 2280 K, which correlates with the maximum NOx emissions (Figure 14). This is in stark contrast to the lower temperatures observed at λ = 1.6, thereby validating the experimentally observed slightly increase in NOx emissions when transitioning from λ = 1.0 to 1.2.
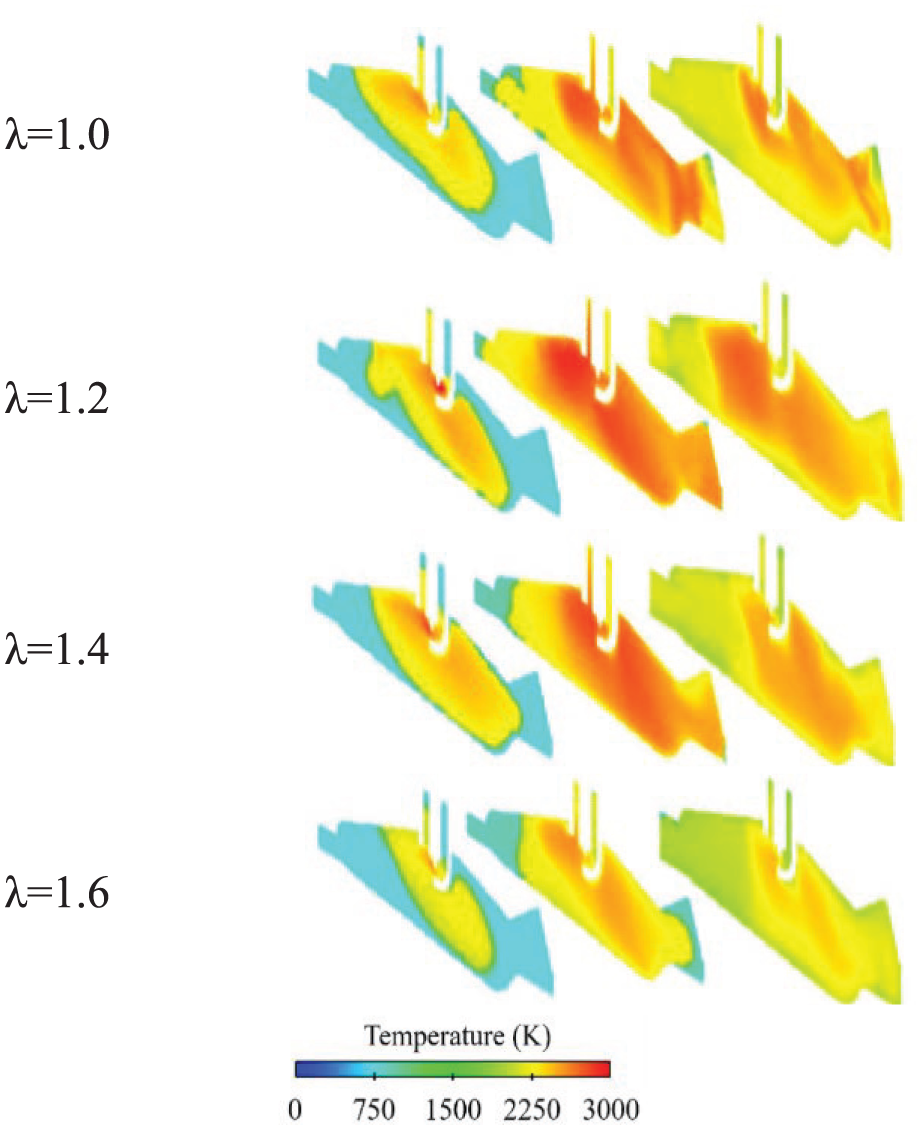
Effect of λ on in-cylinder temperature field.
Energy balance analysis for methanol engine under lean operating conditions
Figure 15 illustrates the energy balance at different λ values under two distinct engine loads: 0.6 MPa (Figure 15(a)) and 1.6 MPa (Figure 15(b)). The categories in each bar represent different aspects of where the energy from the fuel goes: unburned fuel (UNBURN), friction losses (FRICTION), heat lost to cooling (HEAT), exhaust energy (EXHAUST), and brake thermal efficiency (BTE). For lower load, the unburn loss exhibits an initial decrease with an increase in λ, suggesting improved combustion efficiency as the mixture leans. However, a subsequent increase at higher λ values indicates a degradation in combustion instability, likely due to the mixture becoming excessively lean. While heat loss shows a consistent decrease as λ increases, which may be attributed to improved thermal management and less energy being lost to heat as combustion efficiency improves. The BTE rises uniformly with an increase in λ, reflecting better overall engine performance and efficiency under leaner conditions. Similar to the lower load condition, unburned fuel energy decreases initially and then increases, mirroring the adverse effects of excessively lean mixtures on combustion stability at higher engine loads.

Energy balance analysis for different load under lean conditions. (a) BMEP = 0.6 MPa, (b) BMEP = 1.6 MPa.
Conclusions
This study systematically investigates the combustion and emission characteristics of methanol fuel in spark-ignition engines under high compression ratios and lean-burn conditions. Key findings and engineering implications are summarized as follows:
(1) Methanol’s high-octane rating and oxygenated molecular structure enable stable combustion in high compression ratio engines, significantly surpassing gasoline in knock resistance. However, its rapid combustion phase demands enhanced mechanical durability for components subjected to elevated peak pressures.
(2) Methanol exhibits extended lean flammability limits under medium-to-high loads, achieving efficient combustion with minimal THC emissions. At low loads, excessive mixture dilution destabilizes combustion, increasing unburned hydrocarbon emissions. Optimal lean operation balances thermal efficiency and emission control.
(3) Three-dimensional simulations identify localized fuel-rich zones and thermal gradients as critical drivers of THC and NOx trends. These findings provide a mechanistic basis for optimizing injection and ignition strategies to mitigate emission trade-offs.
(4) The results validate methanol’s viability as a carbon-neutral fuel for high-efficiency engines. To harness its full potential, future designs should integrate adaptive combustion control and robust materials to address mechanical stress. This work advances practical pathways for decarbonizing the automotive sector through methanol-based engine technologies.
Footnotes
Handling Editor: Divyam Semwal
Author contributions
Wei Duan: Data curation, Funding acquisition, Investigation, Writing – review & editing. Xiaohua Geng: Conceptualization, Methodology, Investigation. Shuya Zhang: Supervision, Writing – original draft, Writing – review & editing. Li Wang: Data curation, Writing – original draft. Jinyuan Pan: Validation.
Funding
The authors disclosed receipt of the following financial support for the research, authorship, and/or publication of this article: This work was financially supported by Key projects of natural science research in colleges and universities of Anhui Province (Grant No: 2022AH052285) and Anhui Province university quality engineering project online course (Grant No: 2020mooc165).
Declaration of conflicting interests
The authors declared no potential conflicts of interest with respect to the research, authorship, and/or publication of this article.
Data availability statement
Data will be made available on request.