
Abstract
Minimum quantity lubrication (MQL) using nano cutting oil has gained much attention and is an up-to-date research topic. The suspension of nanoparticles not only improves the cooling lubrication of MQL technique but also creates the secondary lubrication mechanisms in contact zone. The main objective of this paper is to study the hard turning performance under Al2O3 nanofluid MQL environment using CBN inserts. Box – Behnken response surface methodology was used to investigate the impacts of nanoparticle concentration (NC), cutting speed (V), and feed rate (f) on surface roughness R a and cutting forces (F y and F z ). The obtained results indicated that the cutting efficiency of 90CrSi tool steel was improved, thanks to the enhancement of cooling lubrication of MQL using Al2O3 nano cutting oil. The applicability of vegetable oils like soybean oil was enlarged for the hard turning process. The findings indicate that Al2O3 nanoparticle concentration has the highest percentage contribution rate on R a , while air pressure is the most dominant effect on the cutting force F y . Moreover, the provision of the appropriate ranges and optimal set of investigated variables obtained in this paper will be the useful guides for further studies and different industrial applications.
Introduction
In recent years, hard machining technology has been widely applied in the metal cutting field. The application of this technology has brought the new, more flexible technological solutions for finishing hard materials such as heat-treated steel, supperalloys, super-hard metals, etc. 1 Some commonly used methods in hard machining technology include hard turning, hard milling, hard drilling, and so on. Among them, hard turning is a machining method that uses the cutting tool with geometrically defined cutting edges to machine such the parts with high hardness (usually 45 HRC or higher). 2 This is a very effective machining method for the parts that require high precision and good surface finish. Hard turning can achieve high machining accuracy, helping to minimize dimensional deviation and uniformity in production. 1 In addition, hard turning can still produce very smooth and shiny surface finish with surface roughness R a up to 0.2–0.8 µm or smaller, which reduces or eliminates the grinding step in the finishing process. 3 On the other hand, hard turning generates less heat than grinding, which reduces the risk of thermal deformation and ensures higher machining accuracy. 4 Hard turning can achieve faster cutting speeds than grinding, especially when machining small parts or large production batches, thus increasing productivity and production efficiency. 5 Since there is no need to change the grinding tool after each machining operation, hard turning saves time and costs for subsequent processes. Hard turning was first applied in industrial production in the automotive sector. 1 The finishing process of transmission shafts by hard turning has shown efficiency in terms of productivity and machined surface quality. 6 In addition, the finishing operations by hard turning in dry condition also bring positive effects in minimizing the negative environmental impact of the use of coolants. 7 This is also the simplest approach to sustainable machining.
However, the complete elimination of coolants means that the cutting forces and cutting heat generated during hard machining will be high. Besides, the material side flow, a distinguished phenomenon occurring in hard-turning operations, causes significant deterioration of surface finish because the squeezed, flake-like, hard, and very abrasive material is loosely attached to the generated surface along the feed marks. The characteristic burr formation on the feed mark ridges is more intensive in case of higher cutting speed and larger tool nose radii and tool wear land. 8 Hence, the selection of cutting tool materials, cutting parameters, and cooling lubrication technologies has been becoming vital factors for the successful hard turning process. Some of the commonly used cutting tool materials in hard cutting methods are coated carbide, ceramic, cubic boron nitride (CBN), diamond, and so on. To further improve the efficiency of hard turning, many environmentally friendly cooling lubrication technologies have been studied and developed. Minimum quantity cooling (MQC), minimum quantity lubrication (MQL), nanofluid MQL, and their combination have gained much attention and shown the promising results when applied to the hard machining methods.
Minimum quantity cooling (MQC) is essentially a technology that uses a low-temperature, high-pressure gas stream directly into the cutting zone. Some commonly used gases are CO2, nitro (N2), and liquid nitro (LN2). Sartori et al. 9 studied the performance of MQC using N2 cooled at −150 °C during the semi finishing turning process of Ti6Al4V. The obtained results indicated that the tool wear was significantly reduced on both rake and flank faces. In another study, the authors added the solid lubricant (SL) to MQC method and compared to dry, conventional wet, and pure MQL conditions. 10 The best performance in terms of tool wear and surface quality was reported under SL-assisted MQC environment. Iturbe et al. 11 made a study on the surface integrity under dry, MQL, and cryogenic assisted MQL conditions when turning Inconel 718. The findings revealed the better tool life and surface quality with MQL and cryogenic assisted MQL machining when compared to dry cutting, which proved the improvement of the cooling and lubricating effect. In addition to nitro (N2) and liquid nitro (LN2), the CO2 gas is commonly used in cryogenic cooling. Bagherzadeh and Budak 12 investigated the cryogenic CO2 cooling and MQL conditions in turning Ti6Al4V and Inconel 718 and reported that the machining performance was improved. Jamil et al. 13 compared the influences of cryogenic CO2 and Al2O3–CNT hybrid nanofluid MQL on turning Ti6Al4V. The experimental results showed that under Al2O3–CNT hybrid nanofluid MQL environment, the average values of surface roughness and cutting forces were reduced by 8.72% and 11.8%, respectively, and the tool life extended by 23%. At the same time, cryogenic CO2 cooling technique lowered the cutting temperature more effectively than hybrid nanoadditive MQL with the reduction of 11.2%. Llanos et al. 14 conducted a study on the hard turning process of AISI 52100 under cryogenic CO2 cooling technique. Compared to dry air blow, cryogenic CO2 cooling technique slowed down the tool wear progress and enhanced the surface integrity. Pereira et al. 15 applied the hybrid CO2 and MQL technique to the milling process of Inconel 718. The obtained achievements indicated the better machining performance due to the superior cooling lubrication when compared to the wet condition. Özbek et al. 16 studied the effects of different cooling lubrication environments (dry, cryo, and CryoMQL) on cutting tool vibration amplitude, cutting temperature, surface roughness, tool wear, and tool life in the turning performance of Vanadis 10 tool steel. CryoMQL turning achieved the best results, and it contributed to reduce up to 65.03% for surface roughness, 56.99% for flank wear, 32.77% for cutting temperature, and 42.76% for cutting tool vibration amplitude compared to dry cutting.
Minimum quantity lubrication (MQL) is a lubricating method, which is introduced with a very small amount of cutting oil directly to the contact zone. This method exhibits the high performance in lubrication and has been applied to hard turning. Chinchanikar and Choudhury 17 studied wear behavior under dry and MQL hard turning of AISI 4340 low alloy steel (55 HRC) and found the improvement in tool life by 20%–25% when machining under MQL method. They concluded that the better lubricating effect of MQL resulted in the reduction of different wear mechanisms in the hard turning process including chipping off at the nose, abrasion, and adhesion. In another study on MQL hard turning of AISI 4340 low alloy steel, Das et al. 18 investigated the effects of the different cutting fluids (nanofluid, water soluble coolant, and compressed air) used in MQL technique and claimed the better results in case of using nanofluid. The nanofluid MQL condition effectively slowed down the wear rate and contributed to generate the chips with the least serrations. Mia et al. 19 optimized the cutting parameters for surface roughness, tool wear, and material removal rate in MQL hard turning of hardened AISI 1060 steel. The dominant wear mechanisms are adhesion, abrasion, and built-up-edge due to the low cooling capacity of MQL method. This is also the main reason for the limited application of MQL in hard machining technology, where the high cutting forces and cutting heat are generated. In order to further improve MQL technique, the additives of nanoparticles to the cutting oil is the novel solution to enhance not only the cooling performance 20 but also the lubrication via secondary mechanisms.21,22 Günan et al. 23 implemented a study on MQL with Al2O3 mixed nanofluids assisted to the milling process of Hastelloy C276 alloy. In their work, three different volumetric Al2O3 concentrations of 0.5%, 1.0%, and 1.5% were investigated, and the authors pointed out that the nanoparticle concentration strongly affected the tool wear and tool life. Specifically, 1.0% Al2O3 concentration outperformed and brought the better results in comparison with 0.5% and 1.5% Al2O3 concentrations. Due to the better cooling and lubricating performance, the adhesion wear was reduced and even not observed at 1.0% and 1.5% Al2O3 based nanofluid MQL. Additionally, Şirin and Kıvak 24 pointed out the improved thermal conductivity and lubricity of nano cutting oils when compared to the based oils. Moreover, the effectiveness of nanofluid application mainly depends on such the parameters as the grain size, morphology, and type of nanoparticles. 25 In the meanwhile, the concentration rates and the types of the based fluids are also the equally important parameters.23,25 Some common nanoparticles used in MQL machining processes consists of Al2O3, MoS2, graphite, graphene, CuO, ZnO, SiO2, TiO2, hexagonal boron nitride (hBN), carbon nanotube (CNT), and so on. Each type of nanoparticles has their own property, so they can create the different cooling and lubricating mechanisms. There are four main mechanisms such as rolling, sliding, polishing, and filming when nanoparticles penetrate into the cutting zone. 26 Among them, Al2O3 nanoparticles (especially α-phase) are widely used due to the high hardness, high thermal stability, chemical inertness, good lubricity, and nearly spherical morphology. Abbas et al. 27 reported the better thermal conductivity and the significant decrease of friction coefficient due to the rolling effect by using Al2O3 mixed nanofluid MQL condition in hard turning of AISI 1045 steel. The high thermal stability makes Al2O3 nanoparticles stuiable to the hard machining processes, which generate high cutting heat. 28 Eltaggaz et al. 29 compared the turning efficiency of Austempered ductile iron alloys (ADI) under different cooling lubrication conditions (dry, wet, MQL, and Al2O3 nanofluid MQL). They concluded that Al2O3 nanofluid MQL mode effectively reduced the induced friction at the cutting zone, leading to a significant reduction in the cutting forces. Also, the better surface quality was achieved due to the higher cooling and lubrication on the tool/workpiece interface. Kara 30 concluded the significant improvement of surface roughness R a and the remarkable reduction of cutting temperature and crater wear in hard turning under Al2O3 nanoparticle-added MQL lubricant. Moreover, the cooling/lubrication method caused the strongest influences on surface roughness R a and cutting temperature.
Hegab et al. 31 claimed the tight relation between the concentration of Al2O3 nanoparticles and multi-walled carbon nanotubes (MWCNTs) and the machining outputs when turning Inconel 718 under MQL condition. Nevertheless, the nanoparticle concentration rate is a complex function, which requires more investigations to specify and optimize. 32 In addition, the parameters such as air pressure and air flow rate have the great influences on the lubrication and cooling efficiency of nanofluid MQL method 33 ; however, studies in this direction are still limited. Therefore, the optimization study of Al2O3 nanoparticle concentration, air pressure, and air flow rate for hard turning process of 90CrSi steel under MQL nanofluid environment has important scientific and practical significance. 90CrSi steel, the low alloy tool steel, is widely used in different industrial areas such as automotive, mold making, pharmaceutical toolings, and so on. This type of steel possesses high strength and hardness, excellent wear resistance, high temperature stability, and good oxidation resistance; therefore, it is often selected for machine elements like shafts, gears, bolts, screws, and so forth.
In this work, the effects of Al2O3 nanoparticle concentration, air pressure, and air flow rate on surface roughness (R a ) and cutting forces (F y and F z ) were examined, and the optimal sets of experimental parameters among the control factors were determined. Also, an analysis of variance (ANOVA) was implemented at a 95% confidence level to build up and specify the percentage contribution rates of the surveyed parameters on surface roughness (R a ) and cutting forces (F y and F z ). The content of this paper was structured by the following sections. Section 1 is introduction, which provides a comprehensive background on the existing studies related to hard machining performance under different cooling and lubricating conditions, specifically hard turning under nanofluid MQL environment. Section 2 is the Experimental procedures to show how the experimental system was set up and implemented. Section 3 is results and discussion to provide the measured data and analysis of the technological MQL parameters (nanoparticle concentration, air pressure, and air flow rate). Finally, Section 4 is conclusion of the study, which summarizes the significant findings, limitations, and future works.
Experimental procedures
The CS-460x1000 Chu Shing lathe (Pin Shin Machinery Co., Ltd, Taichung, Taiwan) was used to implement the hard turning experiments, and the set up diagram of hard turning experiments and cutting force measurement is shown in Figure 1. The designation of Sandvik Coromant CBN inserts (type: 80° positive rhombic inserts with two CBN tips) is CCGW 09T308S 01020 FWH, which is recommended for cutting hardened steels, sintered metals, and high temperature alloys. 4 The cutting parameters were kept constant during experiments at cutting speed V = 160 m/min, feed rate f = 0.12 mm/rev, and depth of cut t = 0.12 mm. The value selection was based on the previous work. 30 The experimental trials were performed under Al2O3 nanofluid MQL environment. The sample workpieces of 90CrSi tool steel (60–62 HRC) with 40 mm in diameter were used and the elemental composition is shown in Table 1. The design drawing of the workpieces is shown in Figure 2. The workpiece samples were machined and heat treated (quenched, tempered) to achieve the required hardness. Then, preliminary hard turning is performed to remove the outer layer to remove the burnt surface layer, remove the warping caused by the heat treatment process, and standardize the dimensions according to the design drawing. Then, the hardness value was re-checked to meet the requirements. Kistler 9257BA piezoelectric multicomponent dynamometer connected to the DQA N16210 A/D data (National Instruments, USA) was used for cutting force measurement. The designation of cutting force components is shown in Figure 3. F z is the cutting force (Fc), which acts tangentially to the rotational direction of the workpiece and is the primary force responsible for material removal. The cutting force F x , the feed force (F f ), acts in the direction of the tool’s feed motion, while F y is the passive force (F p ) acting perpendicular to both the cutting and feed forces. The sampling frequency of cutting forces is 0.001 s. Dasylab 11.0 software was applied to report and process the experimental data. The surface roughness R a were measured by Mitutoyo SJ-210 portable surface roughness tester surftest with the cut-off length of 0.08 mm. The criteria of surface roughness are based on ISO 4287-1997 standard. The measured R a values were measured by three times after each cutting trials and the average values were taken and reported. The Al2O3 nanofluid preparation process was shown in Figure 4. The Al2O3 nanoparticles in size of 30 nm were added to soybean oil at the rates of 0.5%, 1.0%, and 1.5% by weight. The prepared mixture was stirred and undergone in ultrasonic vibration with SELECTA Ultrasons-HD (Spain) for 1 h to improve the homogenization of nanoparticles with vegetable oil. 23 The obtained nanofluid was used for MQL system. The abbreviations of the variables and technical terms are given in Appendix.

Set up diagram of experiments and measurement.
Elemental composition of 90CrSi steel (wt.%) according to DIN EN ISO 4957 standard.


Design drawing of workpiece samples.

Designation of cutting force components.

Al2O3 nanofluid preparation process.
Box-Behnken experimental design in Minitab 21 software was applied for three input parameters (nanoparticle concentration, air pressure, and air flow rate) and their levels (Table 2). The chosen values of investigated parameters were based on previous studies. 3 The experimental matrix consists of fifteen distinct experiments, each representing a unique combination of surveyed parameter settings shown in Table 3. Each of the cutting trials in the experiment design was done independently in triplicates.
Investigated parameters and their levels.

The experiment design and measured values under Al2O3 NF MQL condition.

Results and discussion
Based on Box-Behnken experimental design, the hard turning trials were implemented by following the RunOrder. The cutting force components were directly measured during the cutting process. The values of surface roughness R a were measured three times after each trial, and the average values were reported. The experiment design and measured values under Al2O3 NF MQL condition were shown in Table 3.
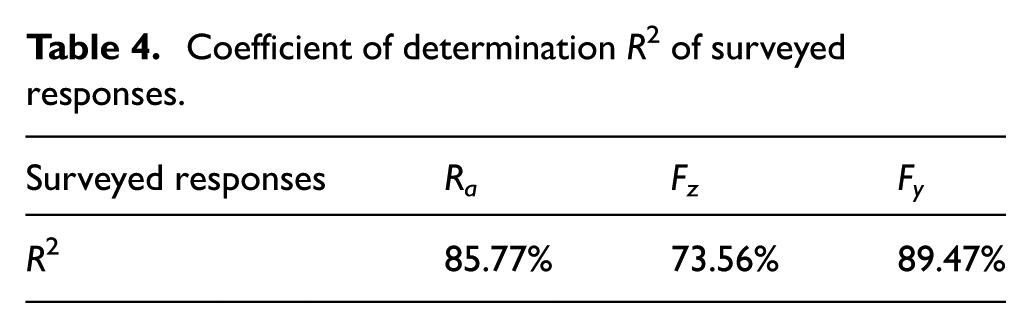
From the experimental data in Table 3, Minitab 21 software was used to process and get the results. The suitability of the experimental models with the experimental data is evaluated through the coefficient of determination R2 given in Table 4. With R2 ranging from 73.56% to 89.47%, they prove that the experimental models are very suitable with the experimental results.
Coefficient of determination R2 of surveyed responses.
Effects of nanoparticle concentration, air pressure, and air flow rate on objective functions
Effects of investigated parameters on R a
The regression model of surface roughness R a is given in equation (1).

The main effect of each investigated variable on the objective function R a is illustrated in Figure 5. Because the graphs all have inflection points for the objective functions to reach the smallest values, the ranges of the investigated variables are appropriate. The results also show that the air flow rate Q has less influence on R a . The obtained findings are corroborated by the results of ANOVA analysis shown in Table 5, which indicates that the Linear model has the highest percentage contribution of 45.80%. In the meanwhile, the Square model ranks second with a rate of 25.06%, and the least influence is Two-Way Interaction with a rate of 14.91%. Considered the main effects of surveyed variables in the models, it was noticeable that in the Linear model, nanoparticle concentration (NC) has highest percentage contribution of 61.21% with p value smaller than 0.05, followed by air pressure (38.77%), while air flow rate Q has the negligible impact (0.02%), as confirmed by a p value of 0.965. For the Square model, the second-order interaction p × p has the greatest effect (58.79%), followed by NC × NC with the percentage contribution of 48.22%. Also, the second-order interaction Q × Q has an insignificant effect (0.32%).

Main effects of investigated parameters on surface roughness R a .
Results of ANOVA for surface roughness R a .

ANOVA: analysis of variance. *indicates statistically significance.
The surface and contour plots presenting the influences of the investigated variables on the objective function R a are given in Figures 6 to 8.

Surface and contour plots of effects of nanoparticle concentration and air pressure on R a . (a) Surface plot. (b) Contour plot.

Surface and contour plots of effects of nanoparticle concentration and air flow rate on R a . (a) Surface plot. (b) Contour plot.

Surface and contour plots of effects of air pressure and air flow rate on R a . (a) Surface plot. (b) Contour plot.
In Figure 6(a), for Q = 200 l/min, the roughness values R a reach the smaller values with NC at the low and average levels, while R a increases rapidly with the increasing air pressure. Observed from the contour chart (Figure 6(b)), NC = 0.5%–1.2% and p = 4.2–5.3 bar are used for R a < 0.3 µm.
In Figure 7(a), for p = 5.0 bar, the surface roughness R a reaches the smaller values with NC at the low and average levels, but it rises with the decline of air flow rate. In Figure 7(b), NC = 0.5%–1.0% and Q = 170–250 l/min should be suggested in order to achieve R a < 0.3 µm.
In Figure 8(a), for NC = 1.0%, the surface roughness values R a decrease with the low levels of p and Q. In Figure 8(b), in order to achieve R a < 0.3 µm, p = 4.0–5.0 bar, and Q = 150–225 l/min are selected.
Surface and contour graphs play the important roles in practice because they will help technical staffs quickly observe the laws and the influence levels of the surveyed variables on the objective functions like surface roughness R a . Hence, they can quickly select the values of the surveyed variables within the reasonable ranges for the smallest R a . Additionally, the values of the input factors can be quickly selected around the average values to achieve the smaller value R a .
Effects of investigated parameters on cutting forces
The regression models of cutting force components F y , F z are given in equations (2) and (3).


Figures 9 and 10 illustrate the independent influence of the investigated variables on the objective functions F y and F z . The influence rules of the investigated variables on F y and F z are almost the same. In addition, the graphs all have inflection points for the objective functions to reach their smallest values, so the selected ranges are reasonable.

Main effects of investigated parameters on the passive force F y .

Main effects of investigated parameters on the tangential force F z .
The objective functions F y and F z reach small values when the Al2O3 nanoparticle concentration is at an average value of around 1.0%, which are suitable enough to create a rolling friction mechanism. 23 However, when the nanoparticle concentration increases to 1.5%, the phenomenon of compression and impedance among nanoparticle appears, negatively affecting the lubrication process.23,34
For the air pressure, a small value about p = 4.5 bar should be used for the smaller values of F y and F z . The other ranges of the air pressure cause the cutting force components to increase. The reasons lying in here are that air pressure has a great influence on the ability to create oil droplets, bring them into the cutting zone and keep them in the cutting zone. 35 External cylindrical turning belongs to the group of open machining methods, so if the air pressure is low, the ability to create oil droplets and bring them into the cutting zone is limited. However, oil mist is easily pushed out of the cutting zone in case of high air pressure, limiting the lubrication process. 4 For p = 4.5 bar, the formation of oil mist, the penetration into the cutting area, and the accumulation on the contact zone are better, so the efficiency of the cooling lubrication is improved.
The cutting forces rapidly fall down with the growth of Q from 150 l/min to about 215–220 l/min, and the objective functions F y and F z reach their smallest values at Q = 220 l/min. The increase of the air flow rate to 250 l/min leads to rise F y and F z . It can be explained that Q will affect the amount of nano cutting oil in the cutting zone. From the obtained results, the number of oil droplets containing nanoparticles in the cutting zone is reasonable with Q = 215–220 l/min. If the air flow rate increases or decreases, the amount of nano cutting oil in the cutting zone will change, causing the objective function values F y and F z to increase. 36
One the other hand, the ANOVA results of the force component F y (Table 6) indicate that the Linear and Two-Way Interaction models have the highest percentage contributions of 34.82% and 34.64%, respectively, while the Square model has the least percentage contribution rate of 20.01%. Also, NC, Q, and the Two-Way Interaction NC × p have the small percentage contributions, which means little influence on F y . The air pressure p is the most influential variable, with the contribution rate of 90.17%, while the remaining variables range from 41.72% to 55.87%.
Results of ANOVA for the cutting force F y .

ANOVA: analysis of variance. *indicates statistically significance.
Similarly, based on the ANOVA results of the force component F z in Table 7, the model of Two-Way Interaction had the greatest influence with PCR = 46.81%, followed by the Square model with a rate of 15.80%, and then the Linear model with the least influence (10.95%). However, the p values of the investigated factors are greater than the significance level α of 0.05, which proves that they have little statistical significance. 37
Results of ANOVA for the cutting force F z .

ANOVA: analysis of variance.
In statistics, F value represents the ratio of variance among groups to variance within groups, while the p value underlines if this difference is significant. From the obtained ANOVA results, when F value is large, the percentage contribution rate (PCR) are large and at the same time the p value is small (α < 0.05), proving that the survey variable is statistically significant. Factors with small F values and high p values are less statistically significant. 38
Figures 11 to 16 present the effects of investigated parameters (NC, p, and Q) on cutting forces F y and F z .

Surface and contour plots of effects of nanoparticle concentration and air pressure on F y . (a) Surface plot. (b) Contour plot.

Surface and contour plots of effects of nanoparticle concentration and air flow rate on F y . (a) Surface plot. (b) Contour plot.

Surface and contour plots of effects of air pressure and air flow rate on F y . (a) Surface plot. (b) Contour plot.
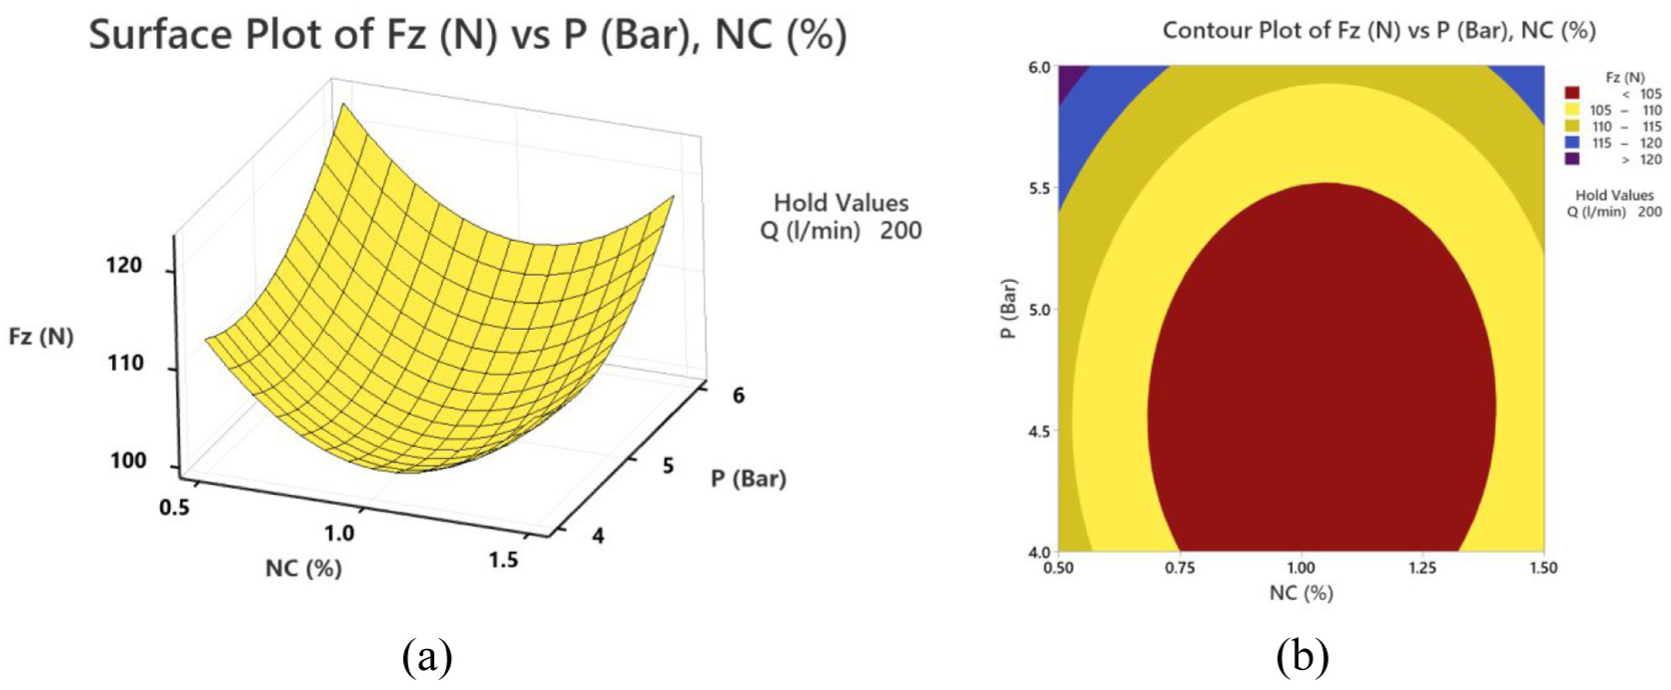
Surface and contour plots of effects of nanoparticle concentration and air pressure on F z . (a) Surface plot. (b) Contour plot.
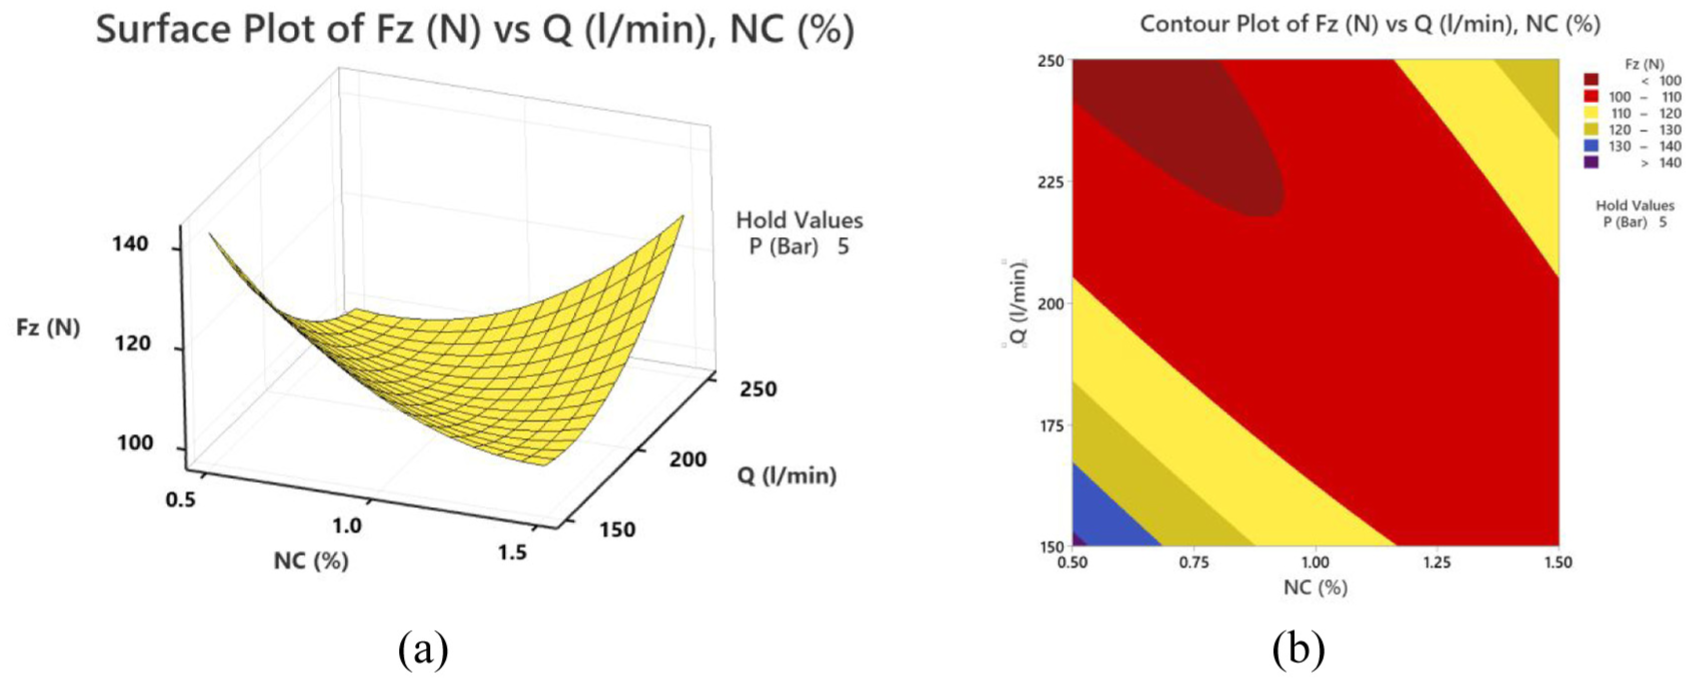
Surface and contour plots of effects of nanoparticle concentration and air flow rate on F z . (a) Surface plot. (b) Contour plot.

Surface and contour plots of effects of air pressure and air flow rate on F z . (a) Surface plot. (b) Contour plot.
In Figure 11(a), for Q = 200l /min, the cutting force F y reach the smaller values with NC at the average level, while F y goes up rapidly with the increasing air pressure. In Figure 11(b), NC = 1.1%–1.2% and p = 4.0–4.2 bar should be used for F y < 120 N, which is marked by the dark red color in Figure 10(b).
In Figure 12, for p = 5.0 bar, there is a close relationship among the levels of nanoparticle concentration and the air flow rate. When using NC at low, medium, or high levels, the air flow rate must also be used at the corresponding level for F y < 150 N (the dark red area in Figure 12(b)). Specifically, NC is selected in the range of 0.6%–1.4%, and Q is selected in the range of 170–250 l/min.
In Figure 13(a), for NC = 1.0%, the cutting force F y decrease with the low level of p combined with the high level of Q. In Figure 13(b), in order to achieve F y < 120 N (the dark red area), p = 4.0–4.5 bar, and Q = 200–225 l/min are chosen.
In Figure 13, for Q = 200 l/min, the medium value of NC combined with the low level of air pressure is for smaller F z (Figure 14(a)), in which NC = 0.7%–1.3% and p = 4.0–5.5 bar should be selected for F z < 105 N (Figure 14(b)). For p = 5.0 bar, F z reaches the smaller value when the low and medium levels of NC and the high ranges of Q are used (Figure 15(a)). Considered the dark red area (F z < 100 N) in Figure 15(b), NC = 0.5–0.9 and Q = 220–250 l/min are specified. For NC = 1.0%, the low level of air pressure and high ranges of Q bring the smaller F z (Figure 16(a)), and p = 4.0–4.4 bar and Q = 225–250 l/min could be suggested for F z smaller than 95 N (Figure 16(b)).
However, in order to determine the optimal values for the objective functions to reach its smallest values, the optimization should be done.
Determination of optimal nanoparticle concentration, air pressure, and air flow rate
If the objective function of surface roughness R a is considered, the single-objective optimization option will be chosen. With the same importance level of the investigated variables, the single-objective optimization result for R a is shown in Figure 17 with the optimal value set after rounding as NC = 0.54%; p = 5.0 bar; Q = 250 l/min.

Optimization result for surface roughness R a .
In hard turning, the thrust force component F y greatly affects the cutting process, tool wear, tool life, etc. For the smallest F y , the single-objective optimization should be done with the same importance level of the investigated variables. The obtained result is shown in Figure 18 with the rounded optimal value set of NC = 0.77%, p = 4.0 bar, and Q = 250 l/min.

Optimization result for thrust force F y .
If the objective functions F y and R a both are needed to be smallest, the multi-objective optimization solution will be chosen. As the result, the optimal set after rounding is NC = 0.8%, p = 4.4 bar, and Q = 234 l/min (Figure 19).
Multi-objective optimization results for F y and R a .
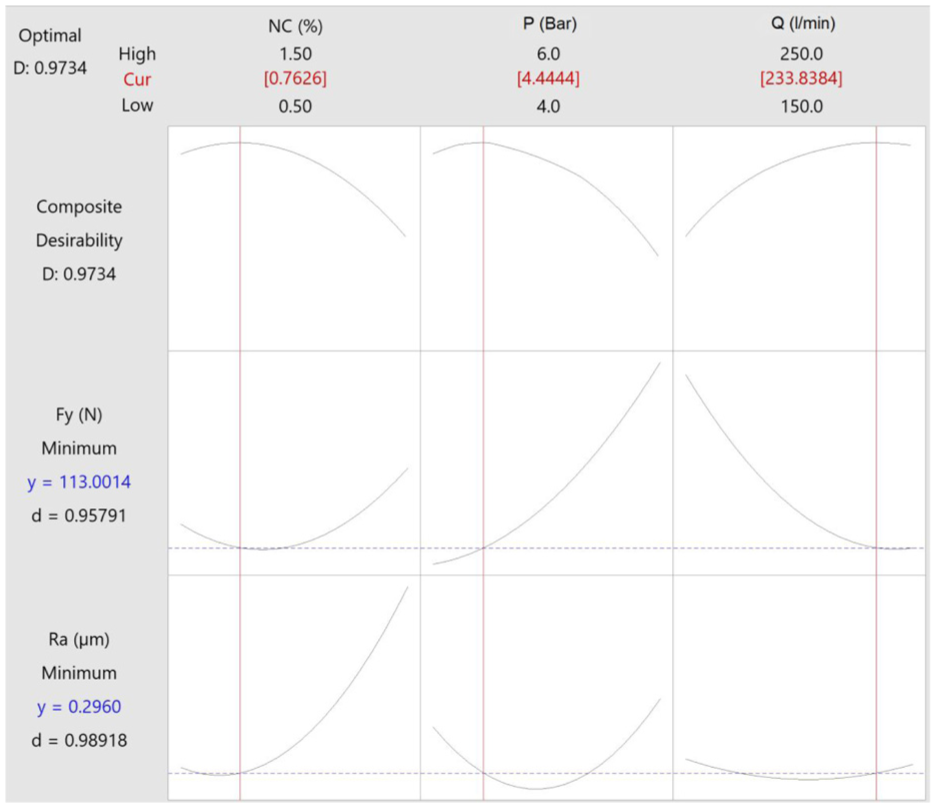
If all three objective functions including R a , F y , and F z are needed to be optimized, the multi-objective optimization will be selected to get the result in Figure 20. The optimal set after rounding is NC = 0.73%, p = 4.4 bar, and Q = 234 l/min.

Multi-objective optimization results for R a , F y , and F z .
Table 8 summarizes the optimization results for different objective functions under Al2O3 NF MQL condition. The composite desirability assesses how well a combination of variables satisfies the defined goals and evaluates how the settings optimize a set of responses overall. Desirability has a range of zero to one, in which one represents the ideal case, and zero means that one or more responses are outside their acceptable limits. It was noticeable that the results of single-objective or multi-objective optimization for R a , F y , and F z are not much different, as confirmed by composite desirability of 0.9734 and 0.9818 close to 1. Based on the analysis results of the main influence of independent variables (Figures 5, 9, and 10) as well as the interaction effects of surveyed variables on the objective functions through the contour graphs (Figures 6–8 and 11–16), the optimal sets of the investigated variables are mainly concentrated. Hence, in practical production, the values of the investigated variables can be chosen as NC = 0.75%, p = 4.5 bar, and Q = 240 l/min.
Summary of optimization results under Al2O3 NF MQL condition.

Conclusion
In the presented work, the influences of Al2O3 nanoparticles enriched in soybean oil on the hard turning performance of 90CrSi tool steel was studied. The effects of input parameters (nanoparticle concentration, air pressure, and air flow rate) on surface roughness R a and cutting forces (F y and F z ) were studied and evaluated. The main contributions of the study are summarized as follows:
The additives of Al2O3 nanoparticles in soybean oil has improved the cooling lubrication capacity of the based oil, so the applicability of vegetable oil was extended to the hard turning process, which contributes to ensure the sustainability.
Statistical analysis confirmed that among the investigated parameters, the nanoparticle concentration adjustments were found to have a substantial influence on surface roughness R a with the highest percentage contribution rate of 61.21% while the cutting force F y is affected mostly by air pressure with PCR = 90.17%. Additionally, the interactions of NC and Q as well as p and Q shows the significant effects. The investigated factors have little statistical significance on the cutting force F z .
The reasonable technological guidelines for achieving smaller surface roughness R a and cutting forces (F y and F z ) are provided. Based on the single-objective optimization results, NC = 0.54%, p = 5.0 bar, Q = 250 ml/min are the optimal set for R a , while NC = 0.77%, p = 4.0 bar, and Q = 250 l/min should be recommended for F y . For multi-objective optimization results, the optimal set for R a and F y is NC = 0.8%, p = 4.4 bar, and Q = 234 l/min, and the optimal set for R a , F y , and F z is NC = 0.73%, p = 4.4 bar, and Q = 234 l/min. These optimal results will provide the valued guidelines for further studies and industrial applications such as automotive, mold making, pharmaceutical toolings, and so on.
In future scope, more investigations should be focused on the influence of the obtained optimization results on surface microstructure, tool wear mechanism, and machining efficiency under MQL using Al2O3 nano biodegradable oil.
Footnotes
Appendix
Handling Editor: Sharmili Pandian
Funding
The authors disclosed receipt of the following financial support for the research, authorship, and/or publication of this article: The work presented in this paper is supported by Thai Nguyen University of Technology, Thai Nguyen University, Vietnam.
Declaration of conflicting interests
The authors declared no potential conflicts of interest with respect to the research, authorship, and/or publication of this article.