
Abstract
This article presents complete control architecture for electric power steering systems (EPS). First, the ideal power assist steering characteristics are built based on data obtained from real vehicle testing or dynamic simulation. Second, a formula is developed to calculate road resistance torque based on the structural parameters of the steering system. Third, an EPS dynamic model is established, which closely reflects the operating conditions of the system. Fourth, a dynamic model of the electric power steering motor is built. Fifth, an Adaptive Neural-Fuzzy Inference System (ANFIS) is designed with Field-Oriented Control (FOC) for the EPS controller. Sixth, the entire mathematical model is simulated and evaluated, including the above dynamic models, under three different working scenarios of EPS, considering the impact of random disturbance torque. The simulation results show that the constructed models closely reflect the physical and dynamic laws of the system, and in theory the proposed controller has obvious efficiency and strong adaptability to the effects of disturbance torque. The research results also identify three problems: (1) Due to the elasticity of the links in the steering system, there is a difference between the actual steering wheel rotation angle and the rotation angle calculated according to the steering wheel kinematics. (2) Due to the viscous drag and the influence of dry friction in the steering system, steering power is consumed, and the response delay of the steering system increases. (3) The steering frequency greatly affects the time delay of the system: the higher the frequency, the greater the delay. Therefore, it is proposed that future research should develop an algorithm and design an EPS controller that can: compensate for the difference due to the elasticity of the material; compensate for the delay due to viscous drag and dry friction in the system; and compensate for the delay when changing the steering frequency, especially when turning quickly and sharply.
Introduction
Developing assist characteristic maps, control strategies, and dynamic models for EPS systems is crucial for optimizing steering performance, ensuring stability, and enhancing driving comfort. A well-designed assist map improves steering response across varying conditions, while an effective control strategy ensures precise torque delivery and adaptability. Accurate dynamic modeling enables predictive analysis and system refinement, reducing energy consumption and enhancing robustness. Selecting an appropriate approach enhances vehicle safety, improves driving experience, and boosts system efficiency, addressing trade-offs between responsiveness, stability, and road feedback.
Various studies have proposed methods to optimize this curve for different applications. Lee et al. 1 aimed to improve steering feel by modifying the EPS torque map based on driver feedback and vehicle dynamics simulation. Their approach successfully enhanced handling and the subjective driver experience, though it relied heavily on subjective evaluations and limited testing across vehicle types. This work provides a practical method for tuning assist characteristics tailored to driver perception. Yaohua et al. 2 introduced novel EPS control strategies for commercial vehicles by designing multiple assist maps that adapt to road adhesion coefficients and vehicle speed. Simulation results demonstrated improved steering feel and vehicle stability across different road conditions. A key limitation is the reliance on accurate adhesion estimation. Nonetheless, the integration of road conditions into EPS map design offers an adaptive and context-sensitive approach to steering assistance. Liu et al. 3 proposed a methodical assist curve design using mathematical modeling and experimental data, focusing on the relationship between steering torque, assist torque, and driver input. The results showed improved driver comfort and steering responsiveness, though the simplified vehicle dynamics limited generalization. This study contributes a structured methodology that combines theoretical and empirical approaches for EPS map development. Similarly, Lee et al. 4 developed steering feel characteristics for EPAS through target torque tracking, employing a reference torque map with adaptive sliding mode control to address uncertainties. Simulation and HILS results validated robust steering feel reproduction. However, the study acknowledged the limitation of lacking full-scale vehicle tests, suggesting future experimental validation Zhao et al. 5 developed a dynamic correction method for EPS characteristic curves, adapting assist torque in real-time based on vehicle speed and driver input. This adaptive strategy enhanced steering feel and vehicle stability compared to static assist curves. However, the real-time control algorithm introduces complexity. The study’s main contribution is the development of a dynamic, flexible EPS mapping system. Ren and Deng 6 proposed a design methodology using mathematical modeling, incorporating driver effort and vehicle parameters to create assist maps. Their approach was validated through simulation and testing, although challenges remained in accurate parameter identification. This work provides a repeatable framework for EPS map construction. In a complementary study, Ren and Deng 7 analyzed ideal steering wheel effort characteristics from the driver’s perspective. By modeling driver torque preferences, they aimed to inform EPS map design aligned with driver expectations. The limitation lies in behavioral variability among drivers, but the integration of human factors into EPS design marks a significant advancement. Tajima et al. 8 examined the influence of steering system characteristics on control performance, specifically for steer-by-wire systems. Although not directly focused on EPS, their findings offer foundational insights into torque characteristics critical to steering system design. The study underscores the relevance of assist curve parameters in overall steering system behavior. Jungberg et al. 9 utilized computer-aided engineering (CAE) tools to model and optimize EPS systems. They focused on balancing improved steering feel and energy efficiency through precise parameterization of assist curves. While the method depends on model accuracy, it demonstrates a scalable and effective approach for modern EPS development. Fu et al. 10 proposed a novel dual power-driven EPS system tailored for electric commercial vehicles. The design enhances steering torque output and reliability under heavy-load conditions. Simulation and testing verified improved energy efficiency and performance. However, implementation complexity remains a challenge. The contribution lies in optimizing assist torque design for commercial applications. Li et al. 11 addressed EPS nonlinearity by applying a self-tuning PID controller using a backpropagation neural network. The method dynamically adjusts control parameters in real-time, improving steering response and stability. Results confirmed enhanced control precision, though network training requires careful tuning. This study offers an intelligent approach for constructing adaptive assist curves. Jingyi et al. 12 used hardware-in-the-loop simulation to study EPS assist characteristics. They analyzed torque-angle responses and built assist maps under realistic operating conditions. Although hardware limitations exist, the method allows real-time curve adjustment. The study contributes to developing responsive, test-based EPS characteristic maps.
EPS systems have undergone significant advancements with the implementation of various control strategies aimed at improving steering feel, stability, and overall driving experience. PID and fuzzy PID control strategies have been widely applied to enhance the performance of EPS systems. Govender et al. 13 combined classical PID control with a state-space approach to improve position tracking accuracy and dynamic response in EPS. This hybrid method enhances control precision but increases system complexity. Zhang and Wang 14 implemented a phase-lead compensator-based PID controller to improve steering responsiveness and system stability. Ma and Zhan 15 developed a state-space model to analyze EPS system stability and support controller design, although the approach assumes ideal conditions and has limited disturbance rejection. Conventional PID control provides a straightforward method for tracking target assist torque from steering inputs but struggles with system nonlinearities and external disturbances. Fuzzy logic control (FLC) effectively addresses these nonlinearities by dynamically adjusting PID parameters. Gao et al. 16 introduced a fuzzy PID controller that adapts gains in real time using fuzzy inference based on steering error and its derivative, resulting in improved disturbance rejection and smoother current tracking. Zhang et al. 17 proposed a fuzzy self-tuning PID controller that adjusts parameters using feedback from steering torque and angle, enhancing adaptability to changing conditions. Despite these advantages, fuzzy PID methods require complex rule design and extensive tuning and remain sensitive to model uncertainties. Nguyen and Nguyen 18 presented a hybrid control strategy combining Backstepping (BS) and PID controllers. The BSPID approach enhances robustness against external disturbances, improving steering feel and system stability. However, the Backstepping (BS) method has notable drawbacks, including its reliance on an accurate mathematical model of the EPS system, which can be challenging due to nonlinearities and parameter variations. Additionally, BS-based controllers often involve high computational complexity, making real-time implementation difficult. These limitations may impact practical applications, particularly in cost-sensitive and embedded EPS systems. Marouf et al.19,20 proposed a sliding mode control (SMC) approach to improve robustness against system uncertainties and disturbances. This method, combined with a reference model, enables ideal motor angle tracking. The integration of a sliding-mode observer further enhances system state estimation without additional sensors. Despite these advantages, SMC’s main drawback is the inherent chattering effect, which can lead to excessive wear on mechanical components and reduced driver comfort. Na et al. 21 and Zheng and Wei 22 employed active disturbance rejection control (ADRC) to mitigate low-frequency disturbances caused by road resistance and mechanical friction. By utilizing an extended state observer (ESO), ADRC estimates and compensates for disturbances, improving robustness and tracking accuracy. While this method outperforms conventional PID controllers in disturbance rejection, its effectiveness is hindered by the complexity of parameter tuning and high computational demands, which limit real-time feasibility. Hung et al. 23 and Lin et al. 24 introduced a wavelet fuzzy neural network (WFNN) approach incorporating an asymmetric membership function alongside an improved differential evolution (IDE) algorithm. This method integrates wavelet decomposition, fuzzy logic, and neural networks to provide adaptive learning and accurate system dynamics modeling. While this technique significantly reduces chattering compared to traditional sliding mode control, it suffers from computational complexity and instability risks due to improper learning rate selection.
Accurate modeling of steering system dynamics, including the complete calculation of road reaction torques and consideration of external disturbances, is crucial for effectively addressing EPS control engineering problems and ensure optimal EPS performance.
The analysis of various control methods for EPS reveals the trade-offs between performance, robustness, and implementation complexity. H2/H∞ control offers robust performance, and stability guarantees but requires complex tuning and accurate modeling, which can be challenging for complex EPS systems. Sliding mode control provides inherent robustness and fast response, but it is sensitive to model uncertainties and requires careful parameter selection. The Backstepping method and BSPID control can handle nonlinear systems and provide stability guarantees but they have a complex design process. The PID control method is simple and widely used, but it is limited in highly nonlinear systems. The LQR method provides optimal control and robustness but relies on accurate modeling. The LQG method combines LQR controller and Kalman filtering is computationally complex and sensitive to modeling assumptions. The above techniques for EPS control can achieve high efficiency under certain conditions, but face challenges due to the nonlinear dynamics of the steering system. This is caused by factors such as driver input, road reaction torque, and external disturbances like crosswind and road roughness, as well as the complex vehicle and suspension structure.
The integration of ANFIS and FOC offers outstanding advantages for control systems, improved efficiency and energy optimization through adaptive control, enhanced dynamic response and torque control, increased robustness to parameter variations and disturbances, and superior fault tolerance capabilities. EPS systems exhibit complex and nonlinear behaviors due to factors like friction and variable loads, which ANFIS can effectively handle. The adaptability of ANFIS is beneficial as EPS parameters vary with vehicle speed, steering angle, and environment. FOC provides precise motor torque control, crucial for a responsive steering feel. The ANFIS-FOC combination enhances EPS responsiveness, precision, and stability, maintaining desired performance even with parameter changes. This synergistic approach addresses the inherent challenges of the EPS system, improving overall driving experience.
From the above analysis, to build the ideal power assist steering characteristics, a successful approach needs to combine multiple methods to leverage their respective strengths and mitigate weaknesses. Integrating qualitative insights, empirical data, modeling, and advanced computational techniques will likely yield the best results in developing a high-performing EPS system that meets engineering standards and the expectations of the drivers. The correctness of the dynamic model and the adaptability of the controller are the core factors that determine efficiency and realistic EPS driving feel. The new contributions of this article include:
(1) This study presents in detail a method for constructing a nonlinear power steering characteristic map based on establishing the relationship between steering torque and the intensity of steering motion, by Stevens’s psychological law. From this relationship, a nonlinear assist characteristic map is developed.
(2) The paper also describes a detailed method for determining road resistance torque during vehicle turning. A novel formula is proposed that calculates this torque based on the geometry of the steering system’s kingpin and front wheels, the steering angle, and the reaction forces from the road acting on the wheels (unlike previous studies, which often adopt existing formulas without derivation, this work establishes the relationship from first principles).
(3) The construction of the EPS dynamic model combines a linear dynamic representation with nonlinear factors such as material viscosity, viscous damping, and dry friction. This hybrid modeling approach more accurately reflects the real-world behavior of the steering system under various operating conditions.
(4) A control strategy is proposed that integrates an ANFIS with the FOC method. Simulations are conducted to evaluate the adaptive performance of the designed controller under the influence of unknown random disturbance torque acting on the steering system.
(5) Finally, the study identifies three key challenges in EPS controller design that require further attention: First, the controller must compensate for deviations caused by the elasticity of steering components. Second, it must address time delay effects resulting from viscous resistance and dry friction within the system. Third, it must compensate for dynamic time lags that arise when there are rapid changes in steering frequency.
The article consists of six main sections, as outlined below: Section “Introduction” reviews published studies on methods’ for constructing power steering characteristic maps, control strategies, and dynamic modeling of EPS systems. It also highlights the novel contributions of this work. Section “EPS assist map characteristics and road resistance torque” presents the methodology for determining the ideal power steering torque and introduces a new equation for calculating road resistance torque. Section “EPS and PMSM dynamic model” develops a dynamic model of the EPS system that incorporates viscous resistance and dry friction torque and additionally constructs a dynamic model of PMSM. Section “Controller design for the EPS system” describes the design of an ANFIS controller using the FOC method for the EPS system. Section “Analysis of simulation results” conducts simulations to evaluate the constructed power steering characteristic map and assess the adaptability of the proposed controller under the influence of random disturbance torques from the road surface acting on the steering system. Section “Conclusions” provides the conclusions of the study and outlines directions for future research.
EPS assist map characteristics and road resistance torque
This section analyzes and builds formulas to determine the types of power assist steering characteristics. On that basis, build ideal power assist steering characteristics according to Stevens’ psychological law.
Assist power steering characteristic curves
Types of assist power steering characteristic curves
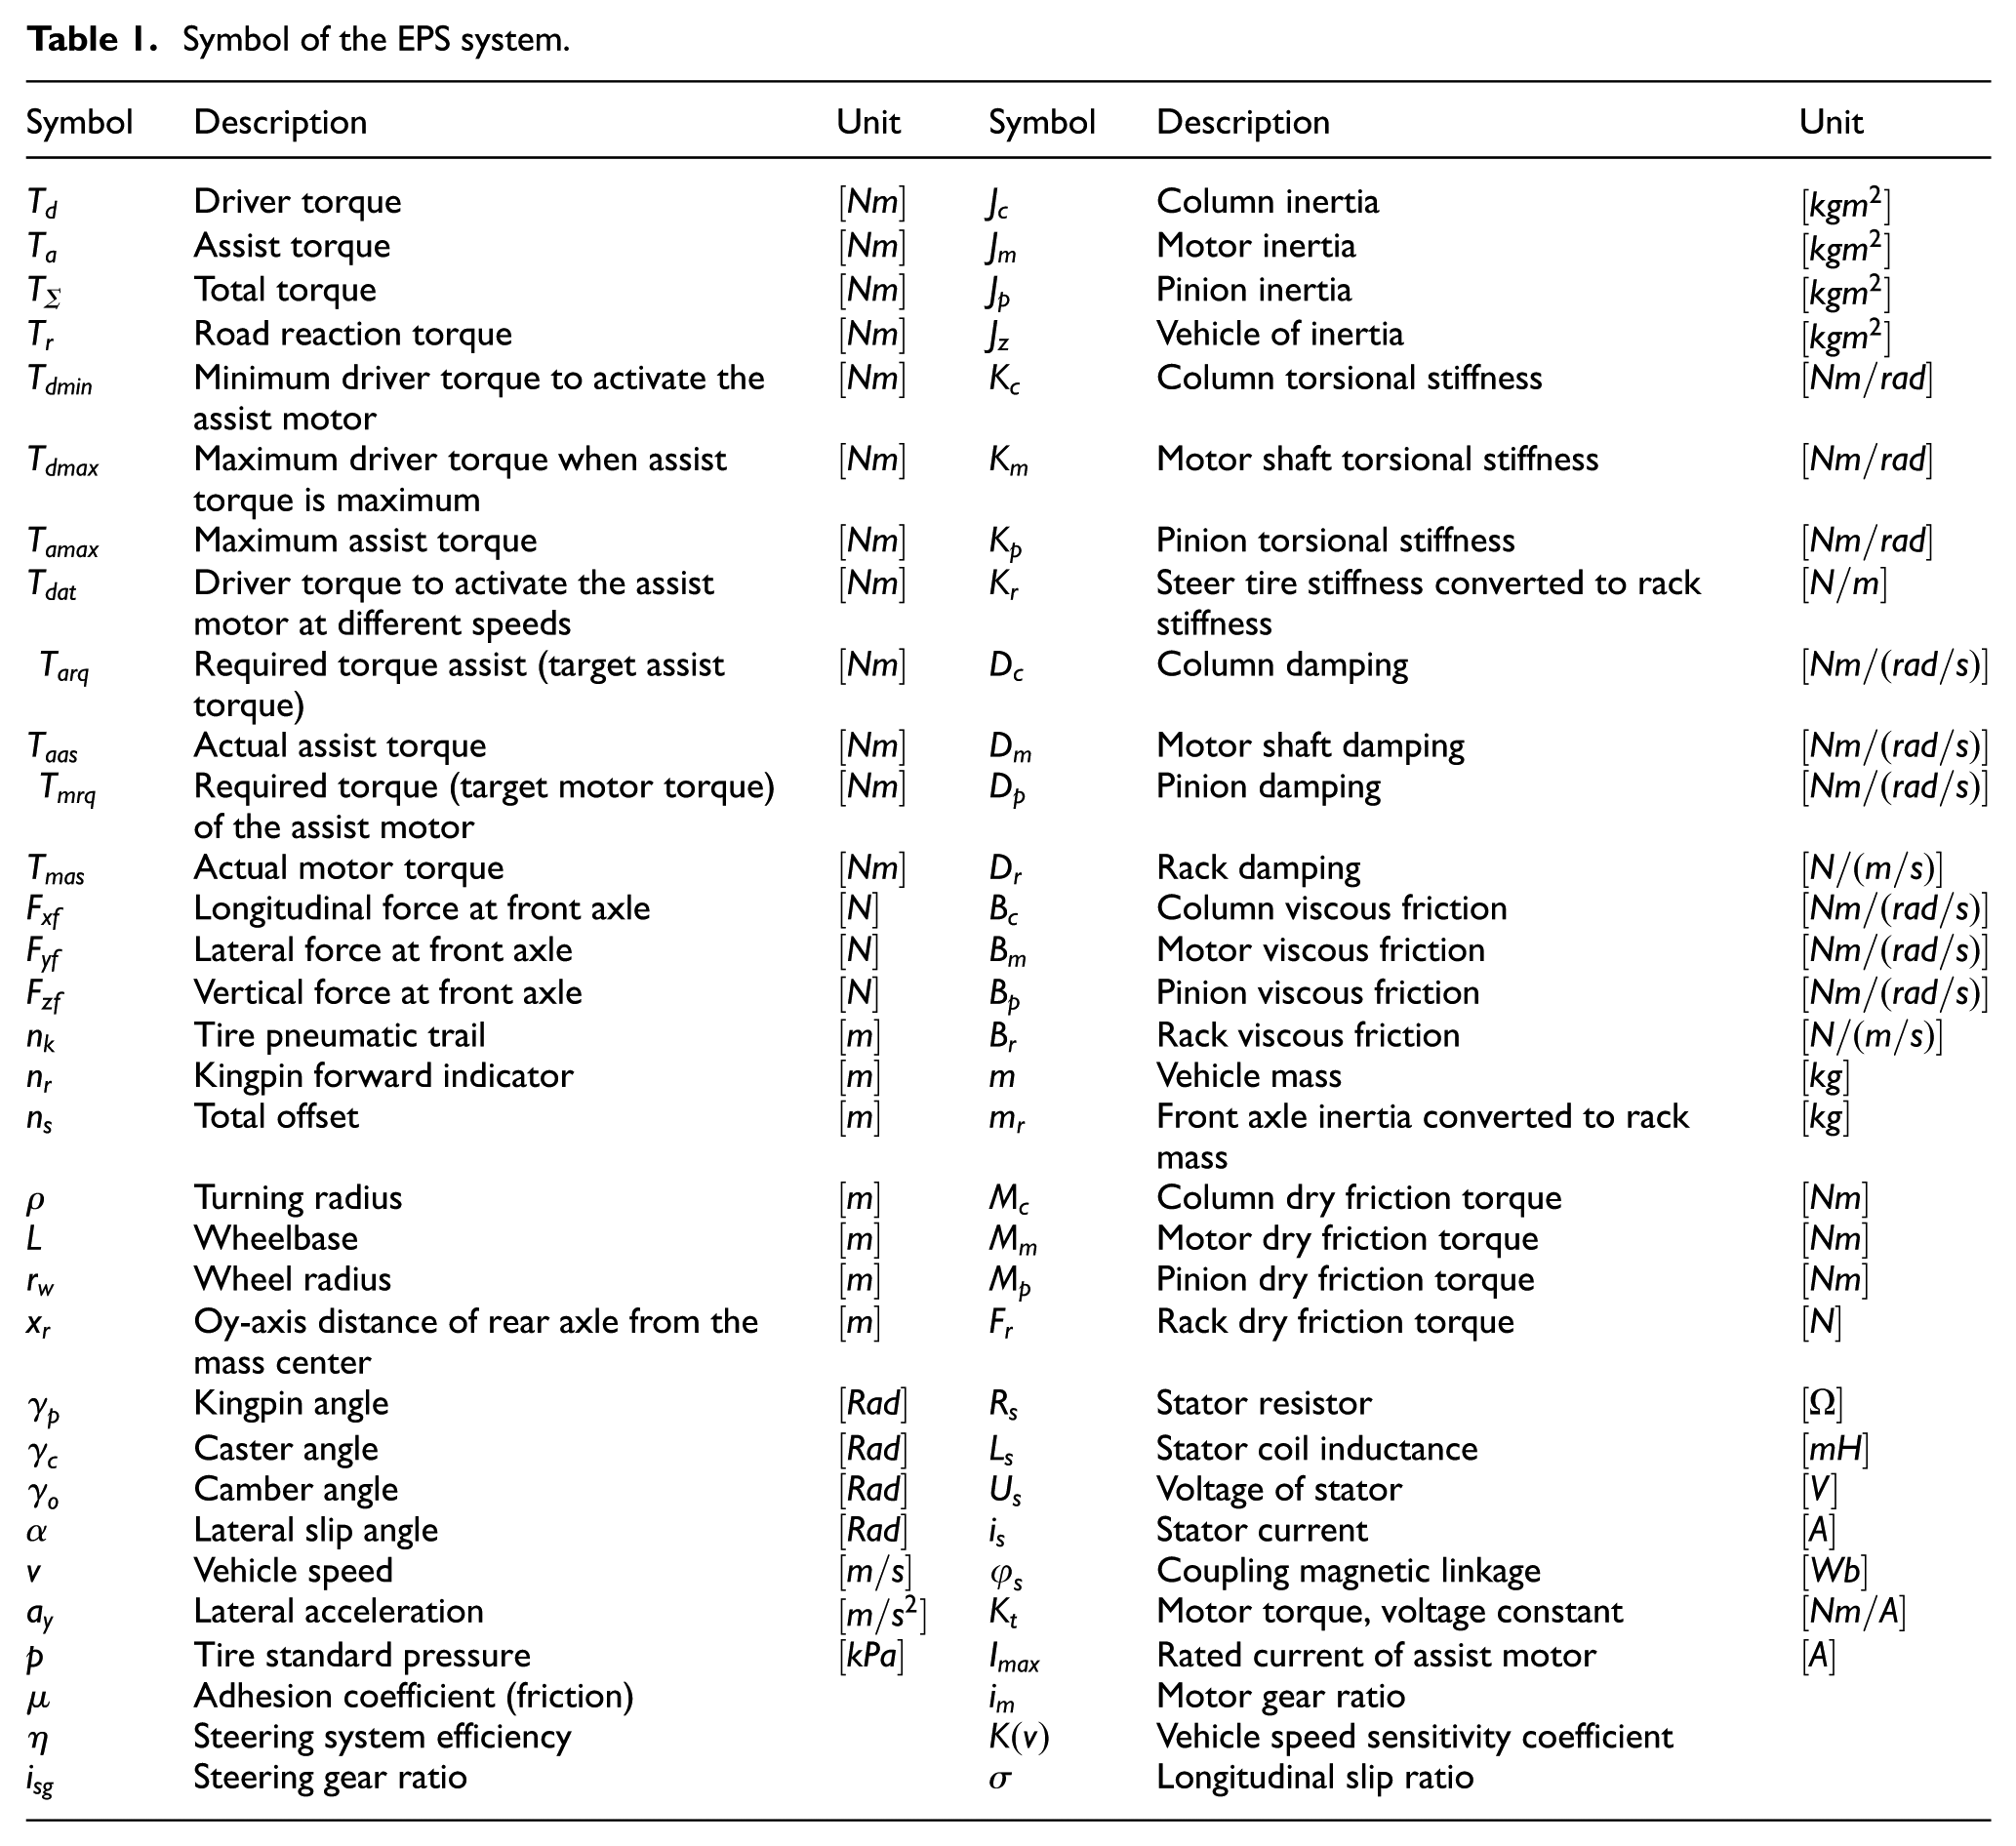
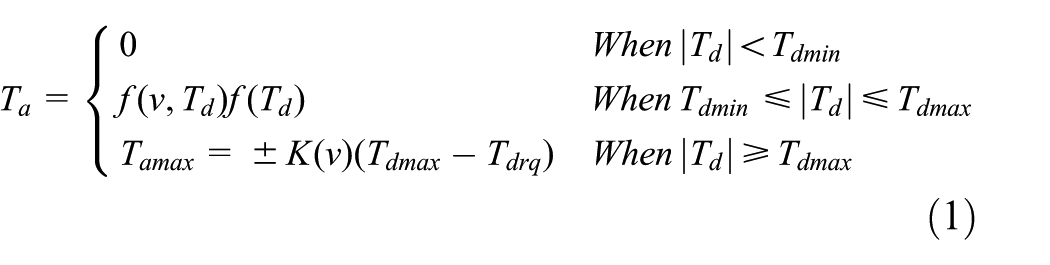
The electric power steering characteristic curve represents the relationship between input signals – the steering torque applied to the steering wheel and the vehicle speed and the output signal – the assist torque or the current supplied to the EPS motor. The symbols and parameters used in the EPS model for this study are listed in Table 1. Based on their functional forms, EPS characteristic curves can be categorized into three types, as illustrated in Figure 1: linear, multi-segment linear, and nonlinear curve types.
25
The linear assist characteristic provides a constant gain throughout the steering range, resulting in predictable system behavior but limited adaptability to varying dynamic conditions. The segmented linear approach modifies the assist gain in discrete steps based on steering load, enhancing adaptability but compromising torque smoothness. In contrast, the nonlinear assist curve employs a continuously variable gain function, offering smoother torque transitions and improved steering feel, though it requires more complex calibration and validation processes. As shown in Figure 1(a), when peak output levels are equal, the linear configuration yields the fastest torque rise, indicating superior initial responsiveness. However, as illustrated in Figure 1(b), under equivalent road feedback conditions, the linear profile generates the lowest assist torque and exhibits reduced performance beyond the torque threshold point
Symbol of the EPS system.

Three types of power assist characteristic curves: (a) the output power the same and (b) the road feel the same.
Nonlinear assist power steering characteristic curves
The basic form of Nonlinear assist power steering characteristic curves
The Nonlinear assist power steering characteristic curves assistance torque is determined in equation. 25
Car manufacturers have different methods of determining
Nonlinear assist power steering characteristic curves based on Stevens’ law
Psychophysics is governed by three foundational laws: Weber’s, Fechner’s,26,27 and Stevens’. 28 In 1953, Stevens formulated the power law, expressing that perceived sensation is proportional to a power function of the physical stimulus. 29 Experimental evidence supports the broad applicability of Stevens’ law across various perceptual domains, as shown in the following equation. 28

Where:
In automotive literature, the term steering motion intensity remains loosely defined. However, empirical findings suggest that a vehicle’s steering dynamics are closely related to its longitudinal velocity. At low speeds or during in-place turning, large changes in steering wheel angle result in minimal variations in lateral acceleration, making such changes difficult for drivers to perceive. Nevertheless, the driver readily senses changes in the steering wheel angle itself, indicating the driver’s intent. Thus, at low velocities, the steering wheel angle represents steering intensity. Conversely, at higher speeds, even small steering inputs produce noticeable changes in lateral acceleration, which becomes the dominant cue for steering intensity and intent, while perception of wheel angle diminishes.
This study proposes an idealized relationship between steering torque and motion intensity based on Stevens’ law. According to this psychophysical model, both the actual and perceived steering torque, as well as the actual and perceived motion intensity, follow a power-law relationship. An optimal steering experience occurs when perceived torque and perceived motion intensity vary linearly.25,30,31 To maintain this perceptual linearity, the physical variables steering torque and motion intensity must conform to the same power-law formulation, as expressed in the following equation 32 :

where:
The Nonlinear type of assistance torque based on Stevens’ law is determined in equation:

where:


Maximum steering torque at different speeds is determined as follows:

Maximum total torque:

When there is the largest resistance torque at different speeds and the largest steering torque at different speeds, we will calculate the largest power assist torque at different speeds. Maximum assistance torque at different speeds,


Maximum assistance torque must ensure that the assist motor does not exceed the rated current:

Transition points

Table 2 shows the coefficients in the power assist characteristic equations of our car simulation results on ADAMS software. Through the optimization algorithm determines the coefficients
Symbol of the coefficients in the power assist characteristic equations.

Road resistance torque
Road resistance torque
The road resistance torque is defined as the greater of two values: the actual steering tire torque resulting from road surface resistance, and the torque resistance estimated based on tire inflation pressure.
The torque resistance is calculated according to tire pressure shown in equation 35 :

The actual steering tire torque due to road resistance is determined by equation31,36:


where:

+ Component


+ Component

where:

Actual steer tire torque according to road resistance is defined as:

Road resistance torque

The tire model
Tires are critical yet complex components in vehicle dynamics due to their nonlinear and load-dependent behavior. Beyond supporting vehicle weight and absorbing road irregularities, tires generate longitudinal and lateral forces essential for acceleration, braking, and cornering. These forces arise from localized deformation at the tire-road interface. In straight-line motion without lateral forces, the tire rolls along the wheel plane. However, during cornering, the tire contact patch undergoes lateral slip, resulting in a deviation between the motion direction and wheel orientation. This deviation defines the sideslip angle (
Lateral force (
)
Lateral force depends on the tire lateral sideslip angle (

Where:
Longitudinal force (
)
Longitudinal force is defined by the equation 37 :

Where: σ– longitudinal slip ratio;
Therefore, integrating the mathematical model for road resistance torque with the elastic wheel dynamics model yields a comprehensive formulation that accurately characterizes road resistance torque as a function of steering system geometry (including the kingpin axis), front wheel steering angle, and tire lateral slip angle during cornering maneuvers.
EPS and PMSM dynamic model
This section presents the building dynamic models of EPS systems and electric motors. Method selection: The linear model is a simple and effective method that is easy to understand and implement but to achieve higher accuracy, it is necessary to add important nonlinear effects. This helps to describe more accurately the complex dynamics in the system without the need for complex nonlinear models or large amounts of data as in machine learning models. This method has a reasonable balance between simplicity and accuracy. Therefore, the article chooses the method of building a dynamic model for the EPS steering system by applying a linear model combined with nonlinear factors such as material viscosity, viscous resistance, and dry friction.
Assumptions when building the model:
- Consider the system as a multi-body dynamic model linked together by joint connections. The links of the mechanical model have concentrated mass located at the center of gravity.
- The parts with high stiffness such as the wheel hub, steering arm, and side push rod are considered solid. The remaining parts such as the electric motor shaft; column torsion bar; pinon, rack, and front wheel are elastic parts modeled as spring and shock absorber systems.
- Mechanical components such as stiffness, and viscous damping have linear properties. Nonlinear effects such as dry friction, and nonlinear stiffness are negligible or can be ignored.
- Linear parameters such as moment of inertia, stiffness, viscous damping coefficient … can be determined through experimental measurements or calculations on 3D simulation software.
Mathematical model of the EPS dynamic model
EPS dynamics model is shown in Figure 2; steering kingpin geometry and front wheel geometry model is shown in Figure 3. The EPS dynamic model is defined as follows:
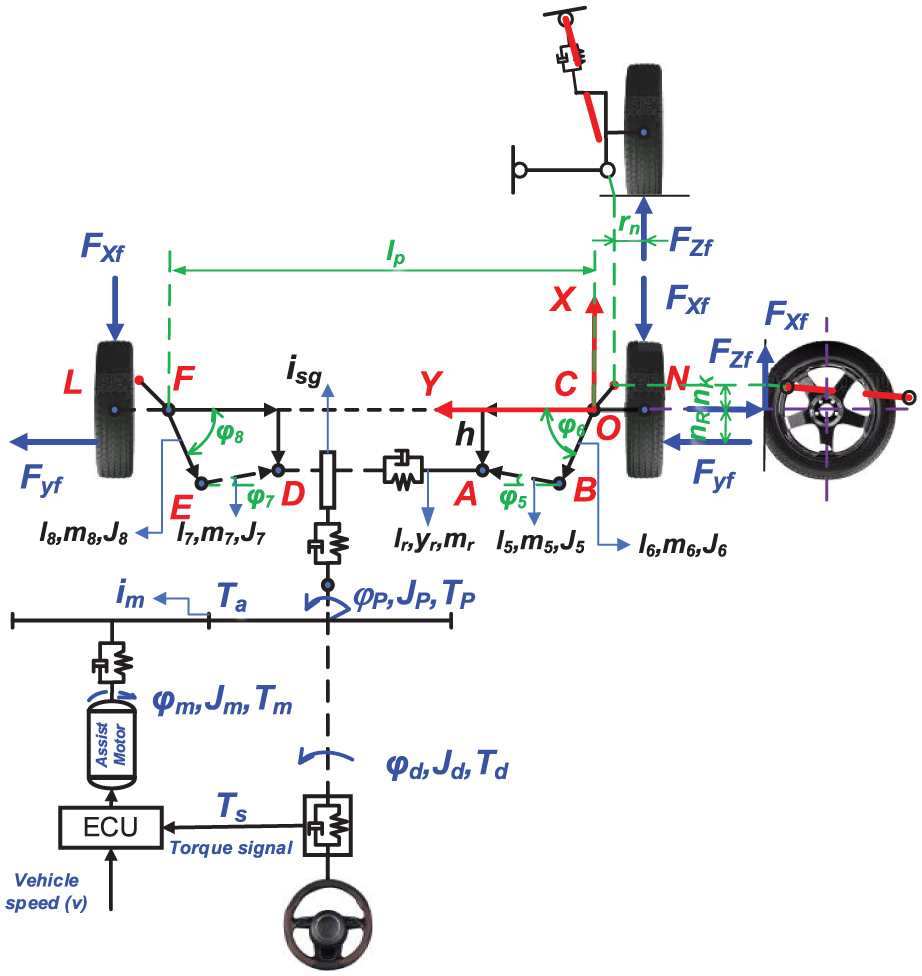
EPS dynamics model.

Kingpin and front wheel geometry.
The equation for steering wheel to steering column is defined as:

Measured torque of the torque sensor is:

The assistance section is shown in equation:

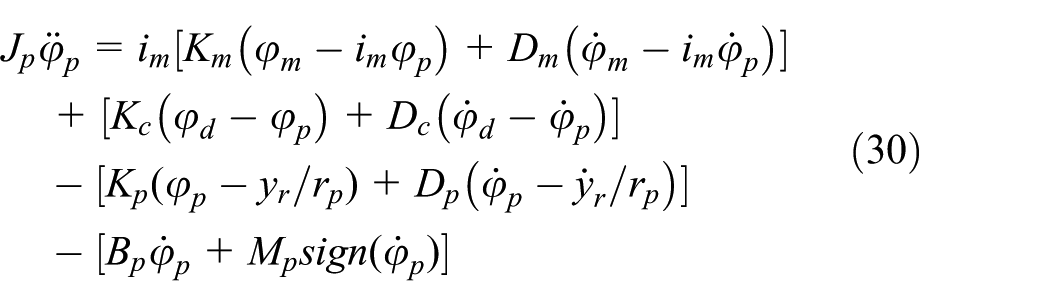
The equation in the section of the pinion is found as:
The equation in the section of rack is found as:

Mathematical model of the PMSM
The mathematical modeling of the PMSM is carried out under the following standard assumptions: magnetic saturation of the iron core and leakage flux are neglected; eddy current and hysteresis losses are disregarded; the stator current is assumed to be a balanced three-phase sinusoidal waveform; the air gap between stator and rotor is uniformly distributed; and the inductance of each stator phase is considered constant and independent of the rotor position.
Based on the above assumptions, the stator voltage vector equation is established as follows:

The voltage equation on the

The electromagnetic torque of PMSM in

The equation of motor motion is:

where:
Controller design for the EPS system
This section proposes a control strategy for the adaptive neural inference system ANFIS with the field-oriented control FOC method for EPS system.
ANFIS control strategy
The implementation of an Adaptive neuro-fuzzy inference system (ANFIS) in Electric Power Steering (EPS) systems has the potential to significantly improve system performance, including driving comfort and vehicle stability. ANFIS combines the learning capability of neural networks with the linguistic approximation ability of fuzzy logic, making it well-suited for managing the complex nonlinearities inherent in EPS systems. In this context, it is essential to carefully analyze the structure of the ANFIS model, the selection of inputs and outputs, the training process, and the design of fuzzy rules.
Selection of inputs and outputs for the ANFIS model
Input variables: The choice of input variables is critical for effective control in an EPS system. These variables should reflect the key factors influencing steering performance and allow the system to adapt to various driving conditions:
Steering angle (
Vehicle speed (
Road resistance torque (
Steering torque (
Output variable: The output of the ANFIS model is the assist steering torque (
ANFIS structure selection and training process
ANFIS architecture
The structure of the ANFIS model plays a key role in its ability to learn and approximate complex relationships. The ANFIS model consists of several layers, each with a specific function that contributes to the overall decision-making process:
Layer 1 (Fuzzification Layer): This layer is responsible for transforming the crisp input values into fuzzy sets using membership functions. The choice of membership functions (e.g. Gaussian, triangular, or trapezoidal) is crucial as it directly impacts the model’s ability to handle uncertainties and nonlinearity. The number of neurons in this layer corresponds to the number of input variables and the number of membership functions selected for each input.
Layer 2 (Rule Layer): This layer applies fuzzy IF-THEN rules to the inputs. Each neuron in this layer represents a fuzzy rule, such as “IF steering angle is large AND vehicle speed is low, THEN assist torque is high.” The number of rules depends on the number of input variables and their fuzzy sets. The design of these rules should reflect the system’s physical behavior and capture the complex relationship between inputs and outputs.
Layer 3 (Normalization Layer): This layer normalizes the output from the rule layer. It ensures that the sum of the rule outputs is equal to 1, which is necessary for maintaining the stability and consistency of the system.
Layer 4 (Defuzzification Layer): This layer calculates the crisp output (assist steering torque) by combining the normalized rule outputs with the parameters of the fuzzy sets. The parameters are adjusted during the training phase to minimize the error between the predicted and actual steering torque.
Layer 5 (Output Layer): The output of this layer is the final crisp value, which represents the control signal (e.g. torque) to be applied to the EPS motor. This is the result of the defuzzification process, combining all the rules and the input-output relationships.
Training process
The training process involves using a training set of input-output pairs collected from vehicle testing or simulation to optimize the ANFIS parameters. The key steps in training include:
Error calculation: The error between the predicted and actual assist steering torque is computed. This error is used to evaluate how well the model is performing and to guide the optimization process.
Optimization algorithm: Techniques such as Gradient Descent or Least Squares are applied to update the parameters of the membership functions and the fuzzy rules to minimize the error. This iterative process continues until the model achieves satisfactory accuracy.
Updating membership function parameters: The parameters of the membership functions (e.g. the mean and standard deviation for Gaussian functions) are adjusted during training to ensure that the fuzzy sets accurately represent the input data.
Select the input membership functions of the ANFIS controller for EPS (Layer 1 – Fuzzification Layer)
Types of membership functions advantages, disadvantages, and applications show as Table 3.
Types of membership functions.

Among the available types, triangular membership functions are the most adopted in the input layer of ANFIS controllers, especially in applications requiring fast response and limited computational resources such as EPS systems.
Triangular membership functions offer several key advantages:
- Simple structure with three control points enables fast, linear computation;
- Easy to configure and interpret, facilitating development and system tuning;
- Sufficient resolution for typical EPS inputs like steering angle and torque, particularly at low to medium speeds;
- High compatibility with real-time implementation on embedded systems.
These characteristics make triangular membership functions a practical and effective choice, ensuring efficient control while maintaining system responsiveness and interpretability.
Fuzzy rule construction and rule set design
The fuzzy rules in the ANFIS model are constructed based on expert knowledge or training data. These rules represent the inherent logic that governs the steering system’s behavior. Each rule typically follows the form:
IF (input 1 is A) AND (input 2 is B) THEN output is C.
For instance:
IF vehicle speed is low AND steering angle is large, THEN assist torque is high.
IF vehicle speed is high AND steering angle is small, THEN assist torque is low.
The rule base must cover all possible driving scenarios, including various road conditions, speed ranges, and driver inputs. It is essential to ensure that the rules are comprehensive enough to handle all possible system states.
Training and validation sets
Training set: The training set consists of a collection of input-output pairs that are used to train the ANFIS model. These pairs can be obtained through experimental data or high-fidelity simulations of the EPS system under different conditions. The training set should include a wide range of driving scenarios, such as varying speeds, steering angles, and road conditions, to ensure that the ANFIS model can generalize well to unseen conditions.
Validation set: The validation set is used to assess the generalization ability of the trained model. It is typically a separate set of input-output pairs that were not used during the training phase. The purpose of the validation set is to evaluate the model’s performance on data that it has not seen before. This helps to identify any overfitting issues and ensures that the model is not simply memorizing the training data but is capable of making accurate predictions for new, real-world scenarios.
Field oriented control method
Field oriented control also known as rotor flux-oriented control, is an advanced technique used for controlling PMSM, brushless DC motors, and induction motors. FOC operates by transforming the coordinate system from a stationary frame to a rotating frame aligned with the motor’s magnetic field. This transformation separates the control variables into two orthogonal components: the torque-producing component (
Operating principle of FOC
Step 1: Clarke and Park transformations are used to convert three-phase coordinates ( - Clarke transformation – Converting from three-phase to two-phase coordinates: This step transforms the three-phase electrical inputs (

- Park transformation – Converting to rotating reference frame: To move from the stationary (

Step 2: Independent control of torque and flux - Torque control: The torque component ( - Flux control: The flux component ( Step 3: Control strategy - ANFIS control (or other methods): A ANFIS controller is used to maintain the desired values of torque ( - Output voltage calculation: After controlling (
Step 4: Inverse Park transformation. The voltages (

Signals and feedback
The FOC system relies on various sensors for accurate motor state estimation:
- Current sensors: Measure the motor phase currents for (
- Voltage sensors: Provide feedback to estimate stator voltages.
- Rotor position sensors: Determine the rotor angle (
ANFIS controller design for the EPS system
Structure of the ANFIS-FOC for the EPS system
The control strategy diagram is shown in Figure 4. The general structure of the ANFIS-FOC control strategy for the EPS steering system includes: The “EPS MAP” module, based on the input signal of the steering torque (
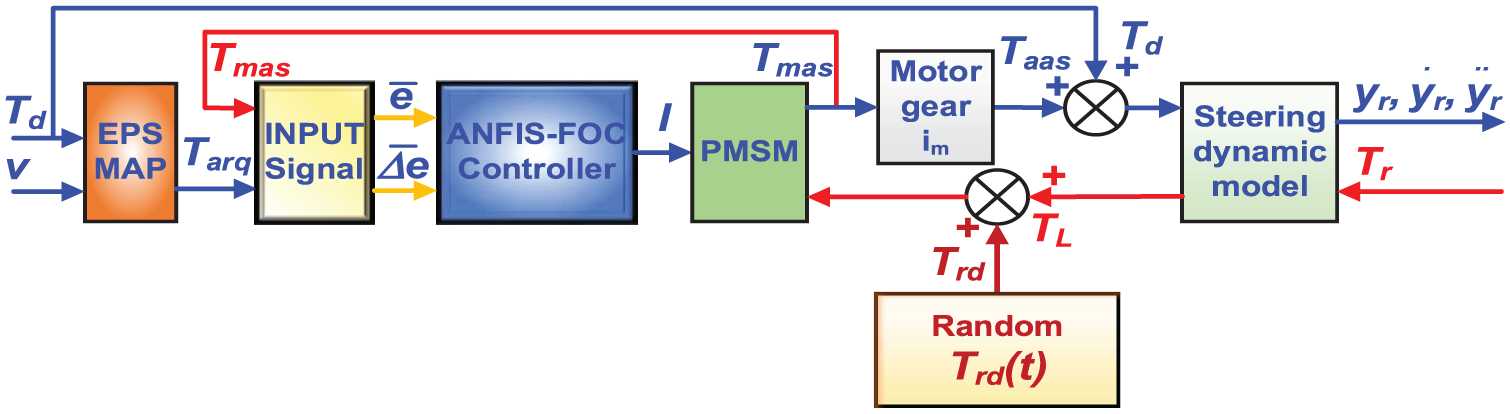
The EPS control strategy diagram.
Control signal and feedback signal
The ANFIS controller for current

To enhance system flexibility and adaptability, enabling efficient training, transfer, and automatic expansion or contraction based on the value range of the actual current signal, while also facilitating model reuse across different vehicle types and simplifying the deployment of ANFIS with input-normalizing machine learning algorithms, the input error is normalized as a percentage using the following equation:

Training and validation data acquisition
Training data is collected either from simulations using a conventional PID controller. The dataset includes input-output pairs: current error, its derivative, and the control current intensity signal. The dataset is divided into 70% for training and 30% for validation and performance evaluation.
ANFIS system structure design
The ANFIS controller for the EPS system consists of five layers: input layer, input member function layer, rule layer, output member function layer, and output layer, show as Figure 5.
The input signal is fuzzified into five triangle membership functions: negative big
If x1 is A1 (NB) and x2 is B1 (NB), then f1 = p1
If x1 is A
1
(NB) andx2 is B2 (NS), then f2 = p2
If x1 is A1 (NB) and x2 is B3 (ZO), then f3 = p3
…
If x1 is A25 (PB) and x2 is B25 (PB), then f25 = p25
where:
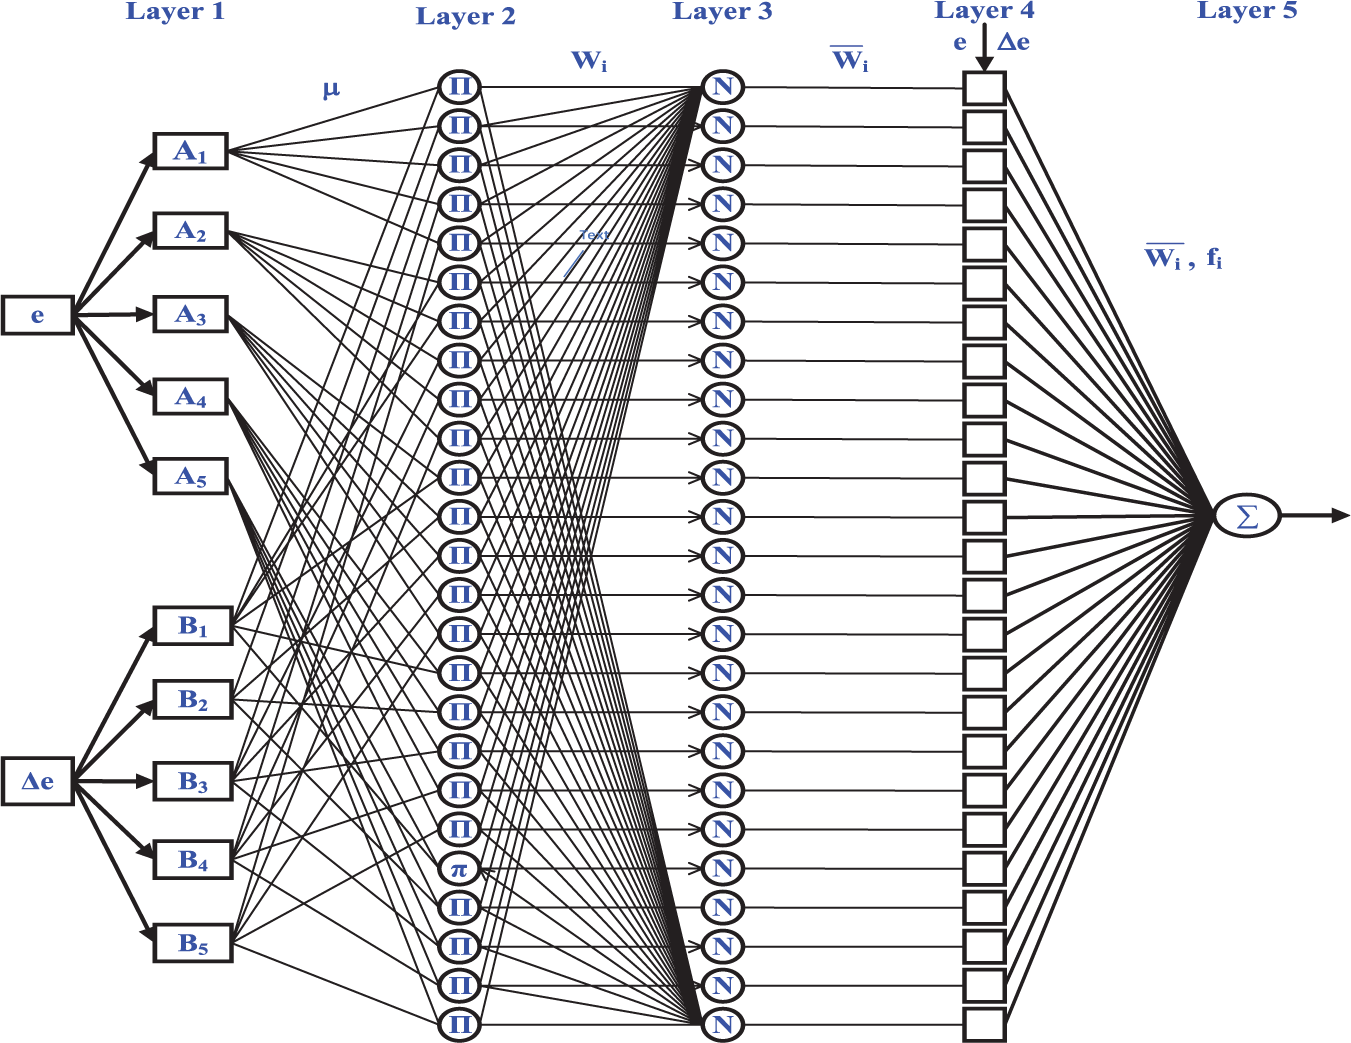
The ANFIS controller structure.
The ANFIS model consists of two inputs and one output, as shown in Figure 6.


The two-input Takagi-Sugeon fuzzy model.
The first layer 1: The fuzzy process takes place where the input signal is blurred into five triangular membership functions. For each output value of the first layer, we can quickly compute a membership function value denoted μ. The first layer 1 is calculated according to the following equations:


where i is the membership level of the dataset

Diagram of five triangular membership functions.

ANFIS fuzzy rule matrix 5 × 5.
The second layer: In the second layer, evaluate the importance of each function based on its weight. This layer processes input values from the previous layer and is an optimization function for representing datasets. The second layer is determined by using equations:


The third layer: This layer acts as a rule layer and gets input from the layer before it. Each neuron in this layer performs conditional rules matching. It calculates the activation level of each rule, with the number of layers matching the number of fuzzy rules. Each node in this category computes a weight to standardize. Nodes in layer 3 ascertain the ratio of rule activation strength to the total of all active rules. The third layer is determined by using equation:

The fourth layer: Defuzzification produces output values by applying inference rules. The node’s output is calculated by multiplying the layer 3 output value with the corresponding rule. The fourth layer is calculated by using equation:

The fifth layer: The output layer consolidates data from the fourth layer and transforms imprecise categorization outcomes into the desired value. The fifth layer is calculated by using equation:

ANFIS training
The training objective is to minimize the error between the ANFIS output and the desired control signal. Hybrid learning (a combination of backpropagation and least-squares estimation) is applied. The training dataset consists of 2000 samples collected at 100 Hz from simulated EPS system. The number of training epochs is 100.
Performance is evaluated using RMSE (Root mean squared error) measured by equation. 39

where:
Model export and Simulink integration
Once trained, the ANFIS model is exported in “.fis” format and integrated into the Simulink environment using the “Fuzzy Logic Controller” block. The integrated control model is tested under multiple scenarios to evaluate tracking performance, robustness, and adaptability. ANFIS fuzzy design for EPS controller and RMSE convergence show as Figures 9 and 10.

ANFIS fuzzy design for EPS controller.
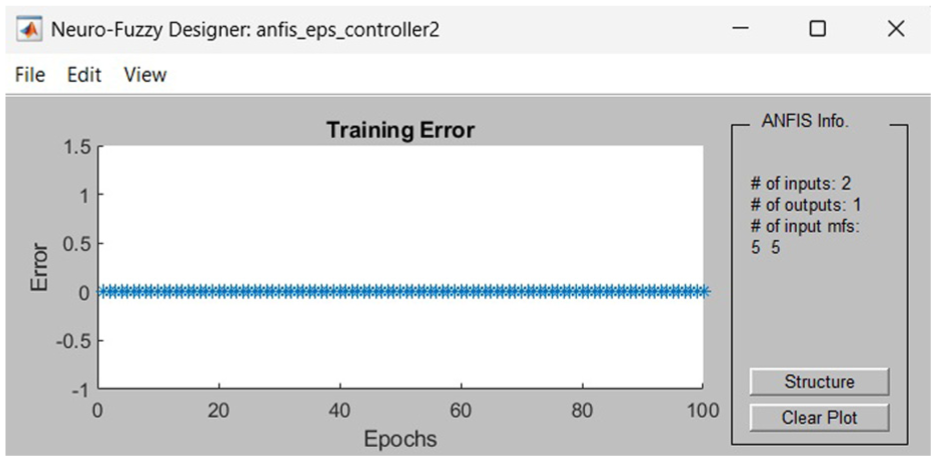
RMSE convergence.
Analysis of simulation results
This section applies the above contents to build power assist steering characteristic maps for the C-EPS steering system. Next, the application of the developed power assist steering characteristic map conducts a dynamic survey of the C-EPS system. Finally, the response capability of the ANFIS-FOC controller is analyzed and evaluated in some working scenarios of the EPS system in two cases when there is no influence of random disturbance torque and when there is an impact of random disturbance torque on the system.
Simulation results of power assists steering characteristic curve
Used the input data from Table 2. The effective steering torque is
The coefficients are obtained through simulation and optimization experiments to find the coefficient function
The coefficients in the equation describing the Nonlinear type of power assist steering characteristics based on Stevens’ law when substituting the values of


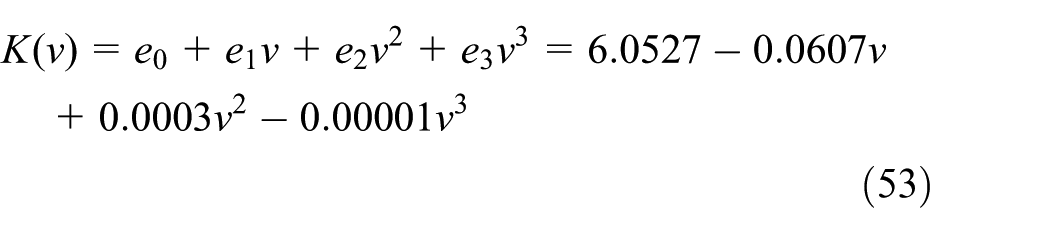

The equation describing the Nonlinear type of power assist steering characteristics based on Stevens’ law when substituting the values of

Figure 11 shows the simulation results of the Nonlinear type power assist steering characteristics based on Stevens’ law.
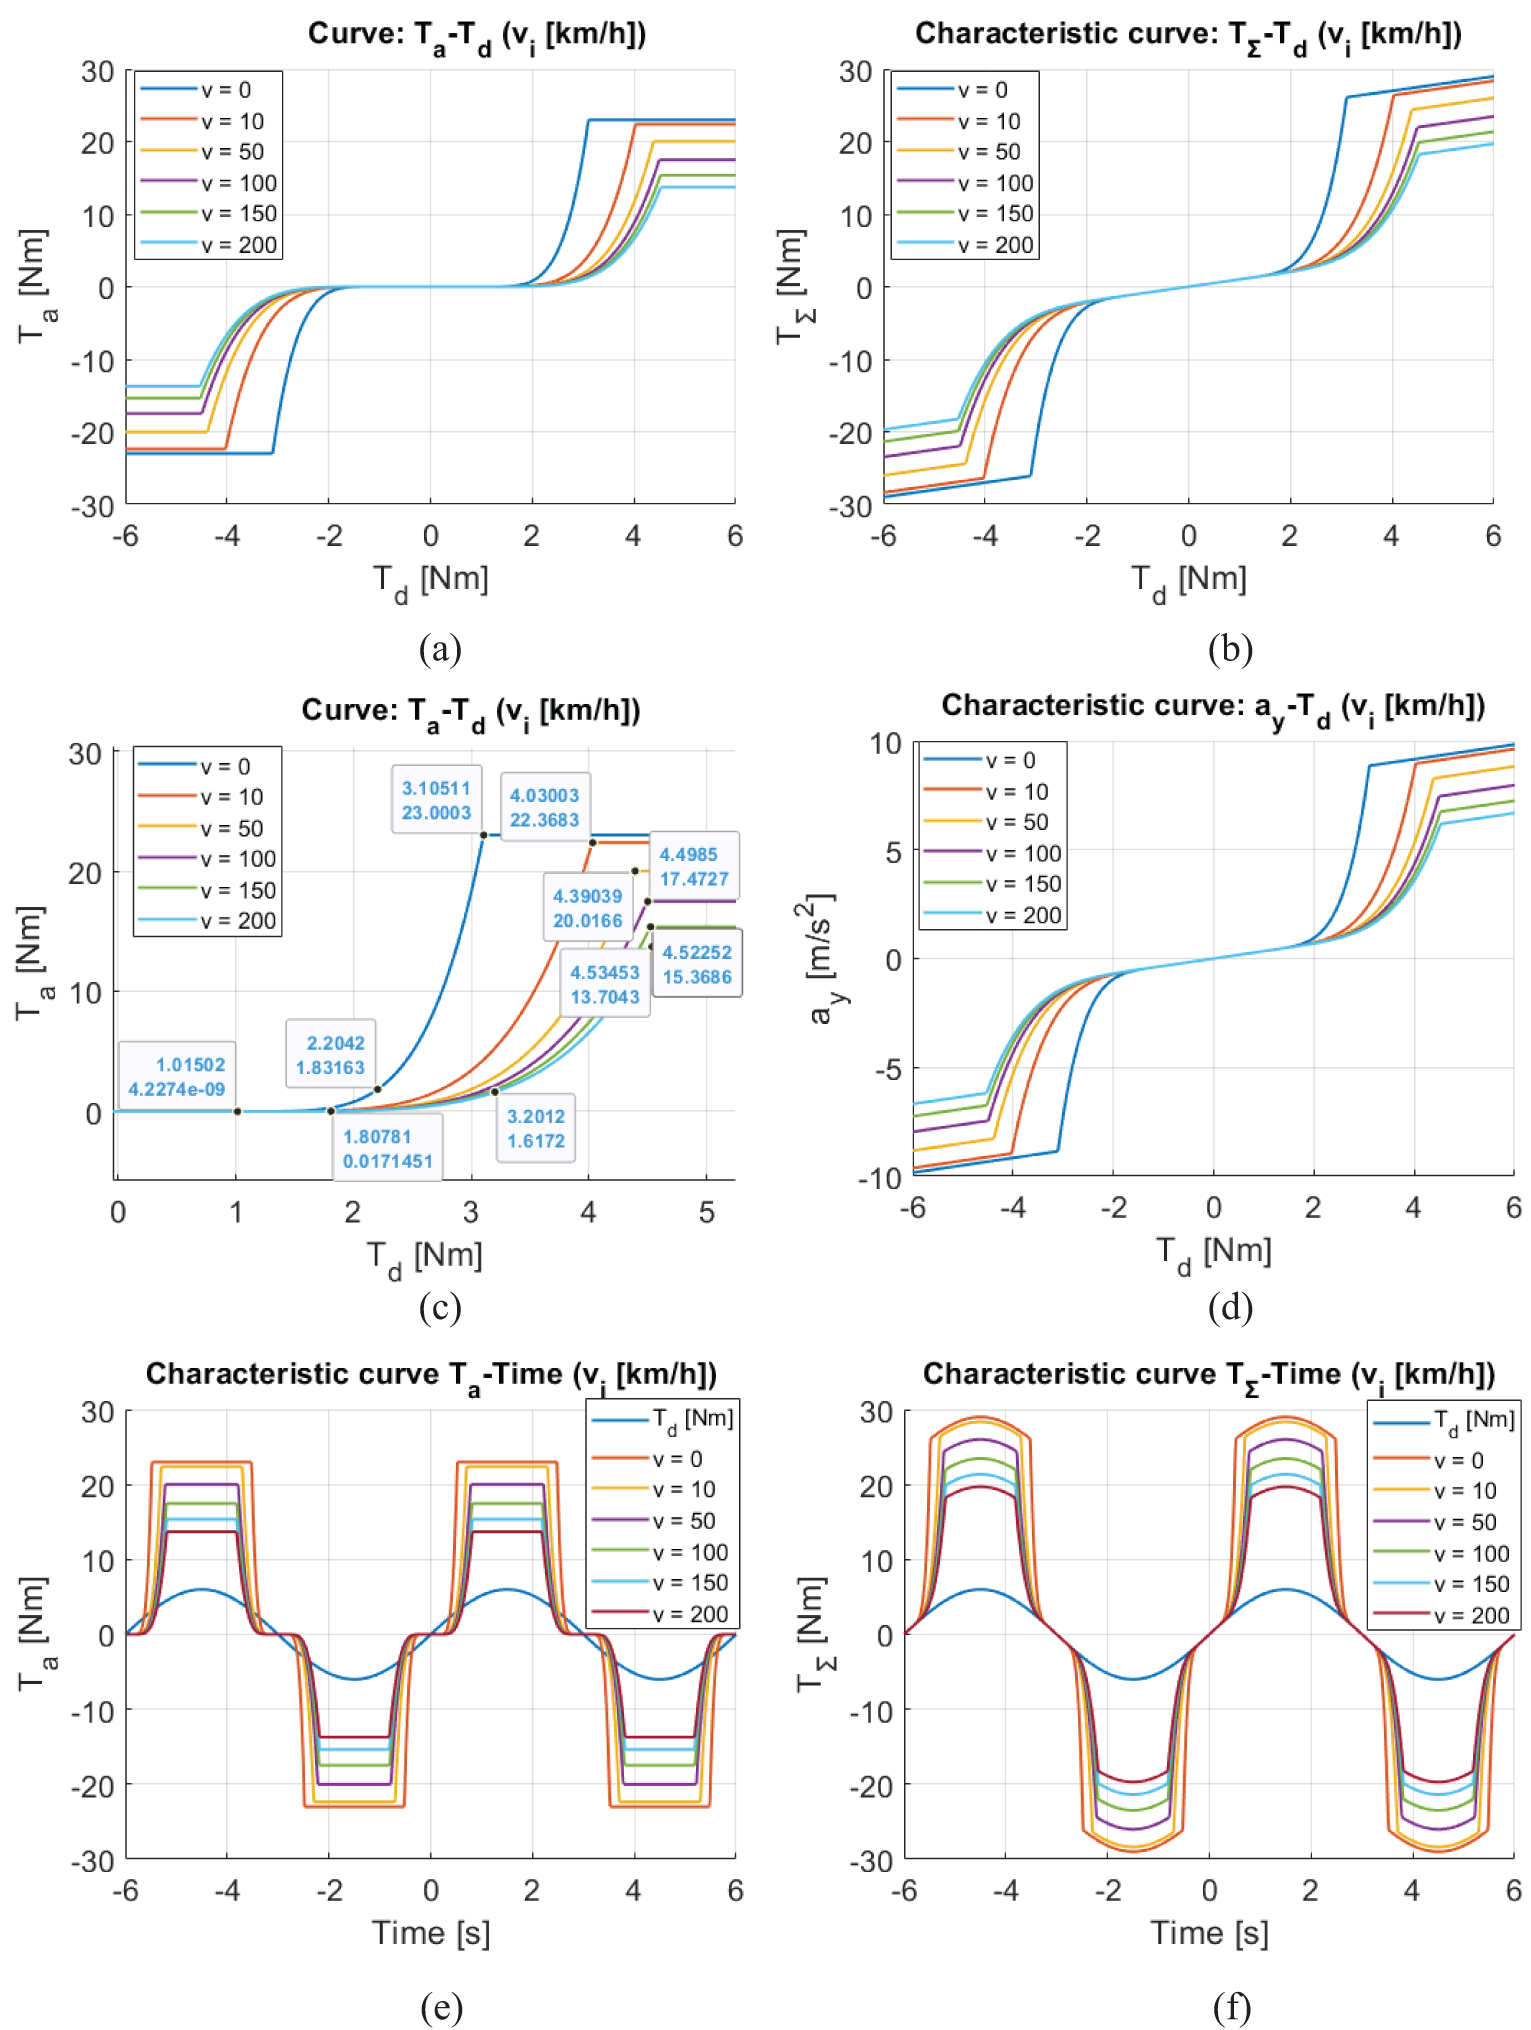
Nonlinear type power assist steering characteristics: (a) characteristic curve
Figure 11 shows the variation of
(1) From Figure 11(a) to (c), the results show that: - As the vehicle speed increases, the slope of the power steering characteristic curve decreases, and the distance between the curves becomes wider. This indicates that at higher acceleration rates, the power assist torque reduces rapidly, thereby effectively meeting the steering performance requirements at high speeds. - When the steering torque is below the minimum threshold - Once - When the steering torque exceeds the range of - Corresponding to vehicle speeds
(2) As shown in Figure 11(a) to (d), when the driver applies an increasing steering torque
(3) Figure 11(d) presents the relationship between steering torque and lateral acceleration
(4) Figure 11(e) and (f) illustrates the dynamic response of the assist torque and total torque under sinusoidal steering input. The results confirm that the implemented control logic aligns with the intended power steering behavior.
Thus, this is a type of characteristic curve that satisfies nearly all the requirements for power assist steering performance. Furthermore, with this assist characteristic, the electric motor is activated early. At different vehicle speeds, the assist torque reaches its maximum value while the driver’s steering torque is maintained within an appropriate range of
Results of determining the road resistance torque
Figures 12 to 14 illustrates three-dimensional simulation results of the variation in road resistance torque (

Road resistance torque according to front wheel angle and the lateral slip angle.
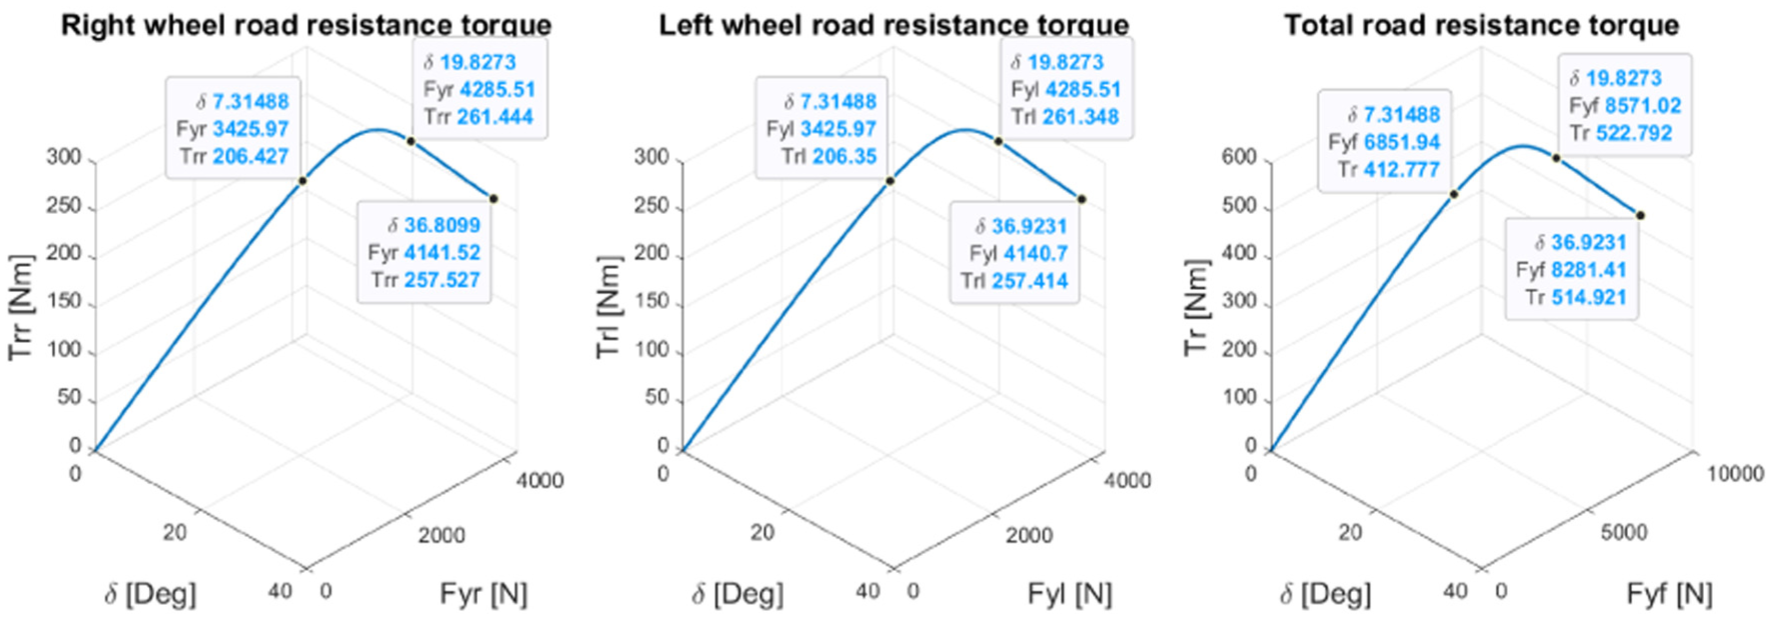
Road resistance torque according to the front wheel angle and the lateral force.

Road resistance torque according to the lateral slip angle and the lateral force.
The simulation results showed that:
(1) Relationship between steering angle and slip angle show as Figure 12: - Observation: As the steering angle ( - Evaluation: This behavior corresponds to the lateral dynamics of pneumatic tires, where both (
(2) Relationship between steering angle and lateral force show as Figure 13: - Observation: The lateral force ( - Evaluation: These results validate the hypothesis that (
(3) Relationship between slip angle and lateral force as Figure 14: - Observation: ( - Evaluation: This behavior aligns well with empirical results in tire dynamics. (
(4) Comparison of left, right, and total torques: - Symmetry: The left and right torques are symmetric, validating the model’s structural consistency. - Total Torque: The total (
(5) General assessment:
The simulation results clearly demonstrate the nonlinear and coupled relationships between road resistance torque and the variables (
- (
- Maximum lateral force and slip angle occur around (
- The correlation between (
- The simulation aligns well with physical expectations, confirming the mathematical model’s accuracy. This model provides a solid basis for EPS controller design and reliable vehicle dynamics simulation in ADAS environments.
EPS system dynamics and ANFIS controller response
To observe and evaluate the effectiveness of the controller. Normally when driving, the driver performs the steering frequency of about
The scenarios are designed to compare the response of the controller in terms of the assist torque in the case of the road resistance according to equation (56) without random disturbance torque and the case of random disturbance torque acting on the power assist motor. This random disturbance torque is assumed to be a “White noise” signal whose mathematical formula is described as:

where:
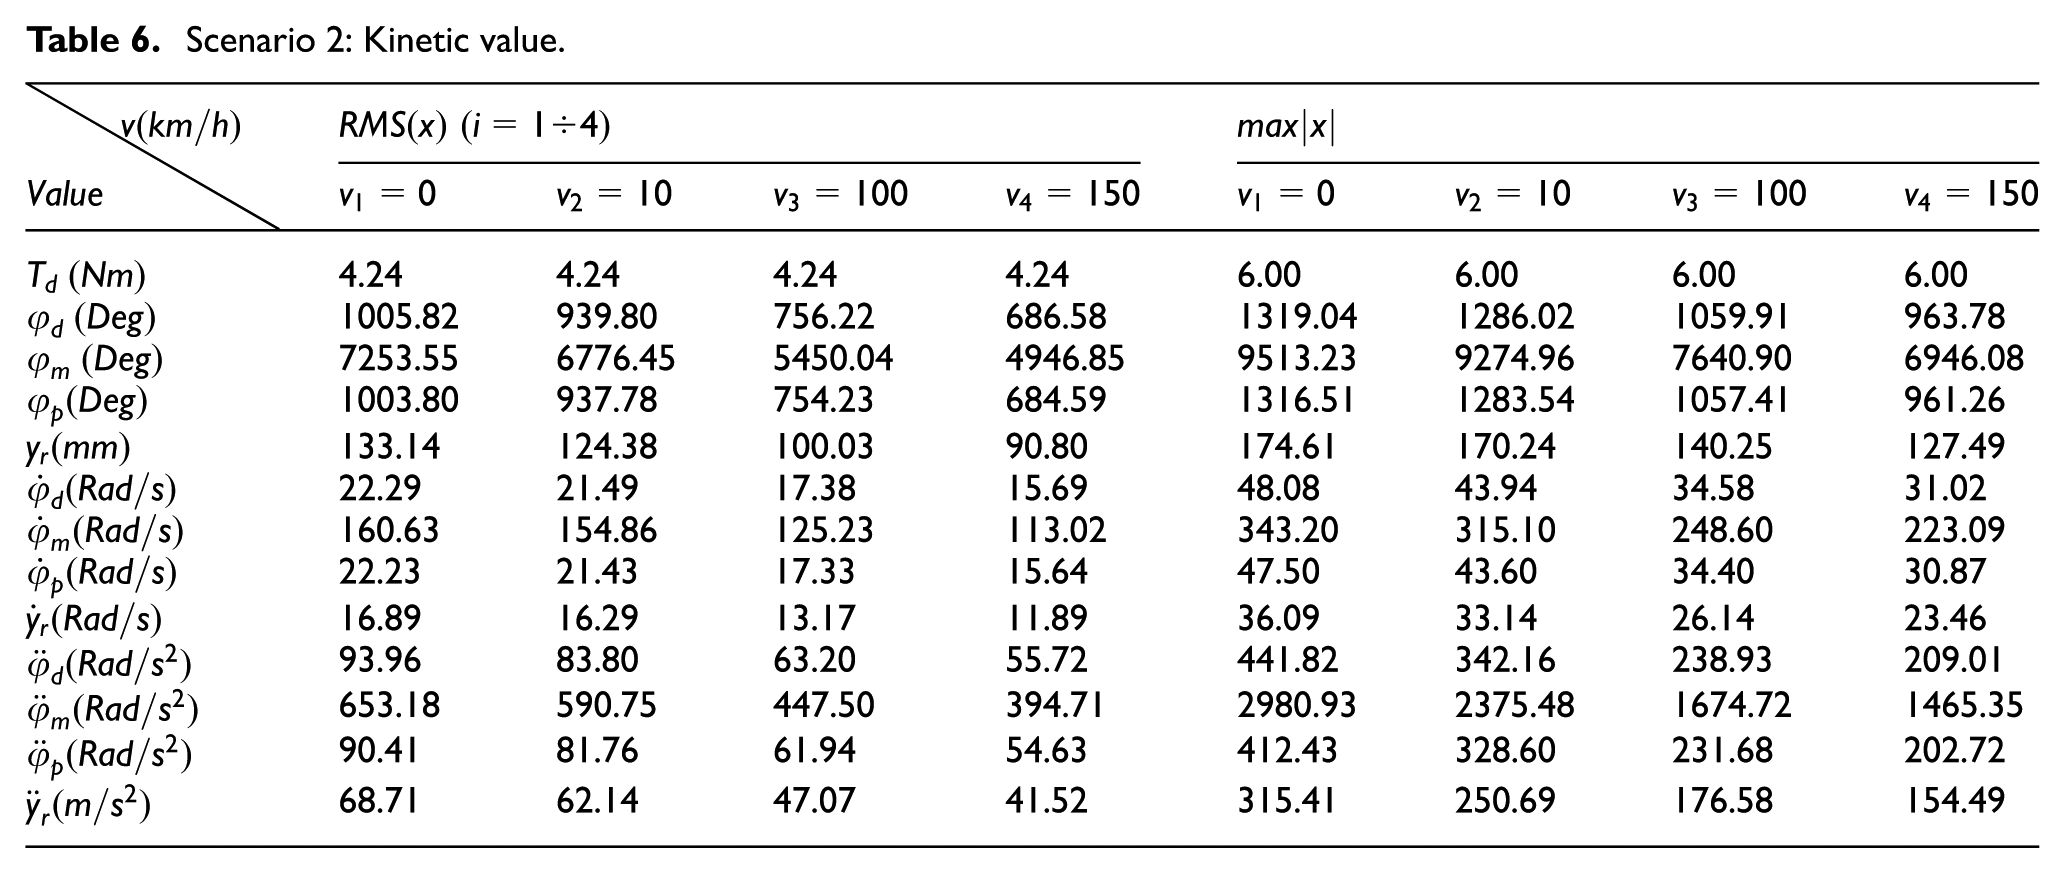
To facilitate the evaluation of simulation results, the article uses two quantities, the root mean square in equation (57) and the maximum absolute value in equation (58) of the simulated quantities, which are calculated in a steering cycle; the values of rotation angle, displacement, velocity, rotation angle acceleration, and displacement are collectively called “Kinetic values.”


Where:
Scenario 1: Td = 3.2 sin (
time) Nm; (Frequency f = 0.2 Hz)
Simulation results
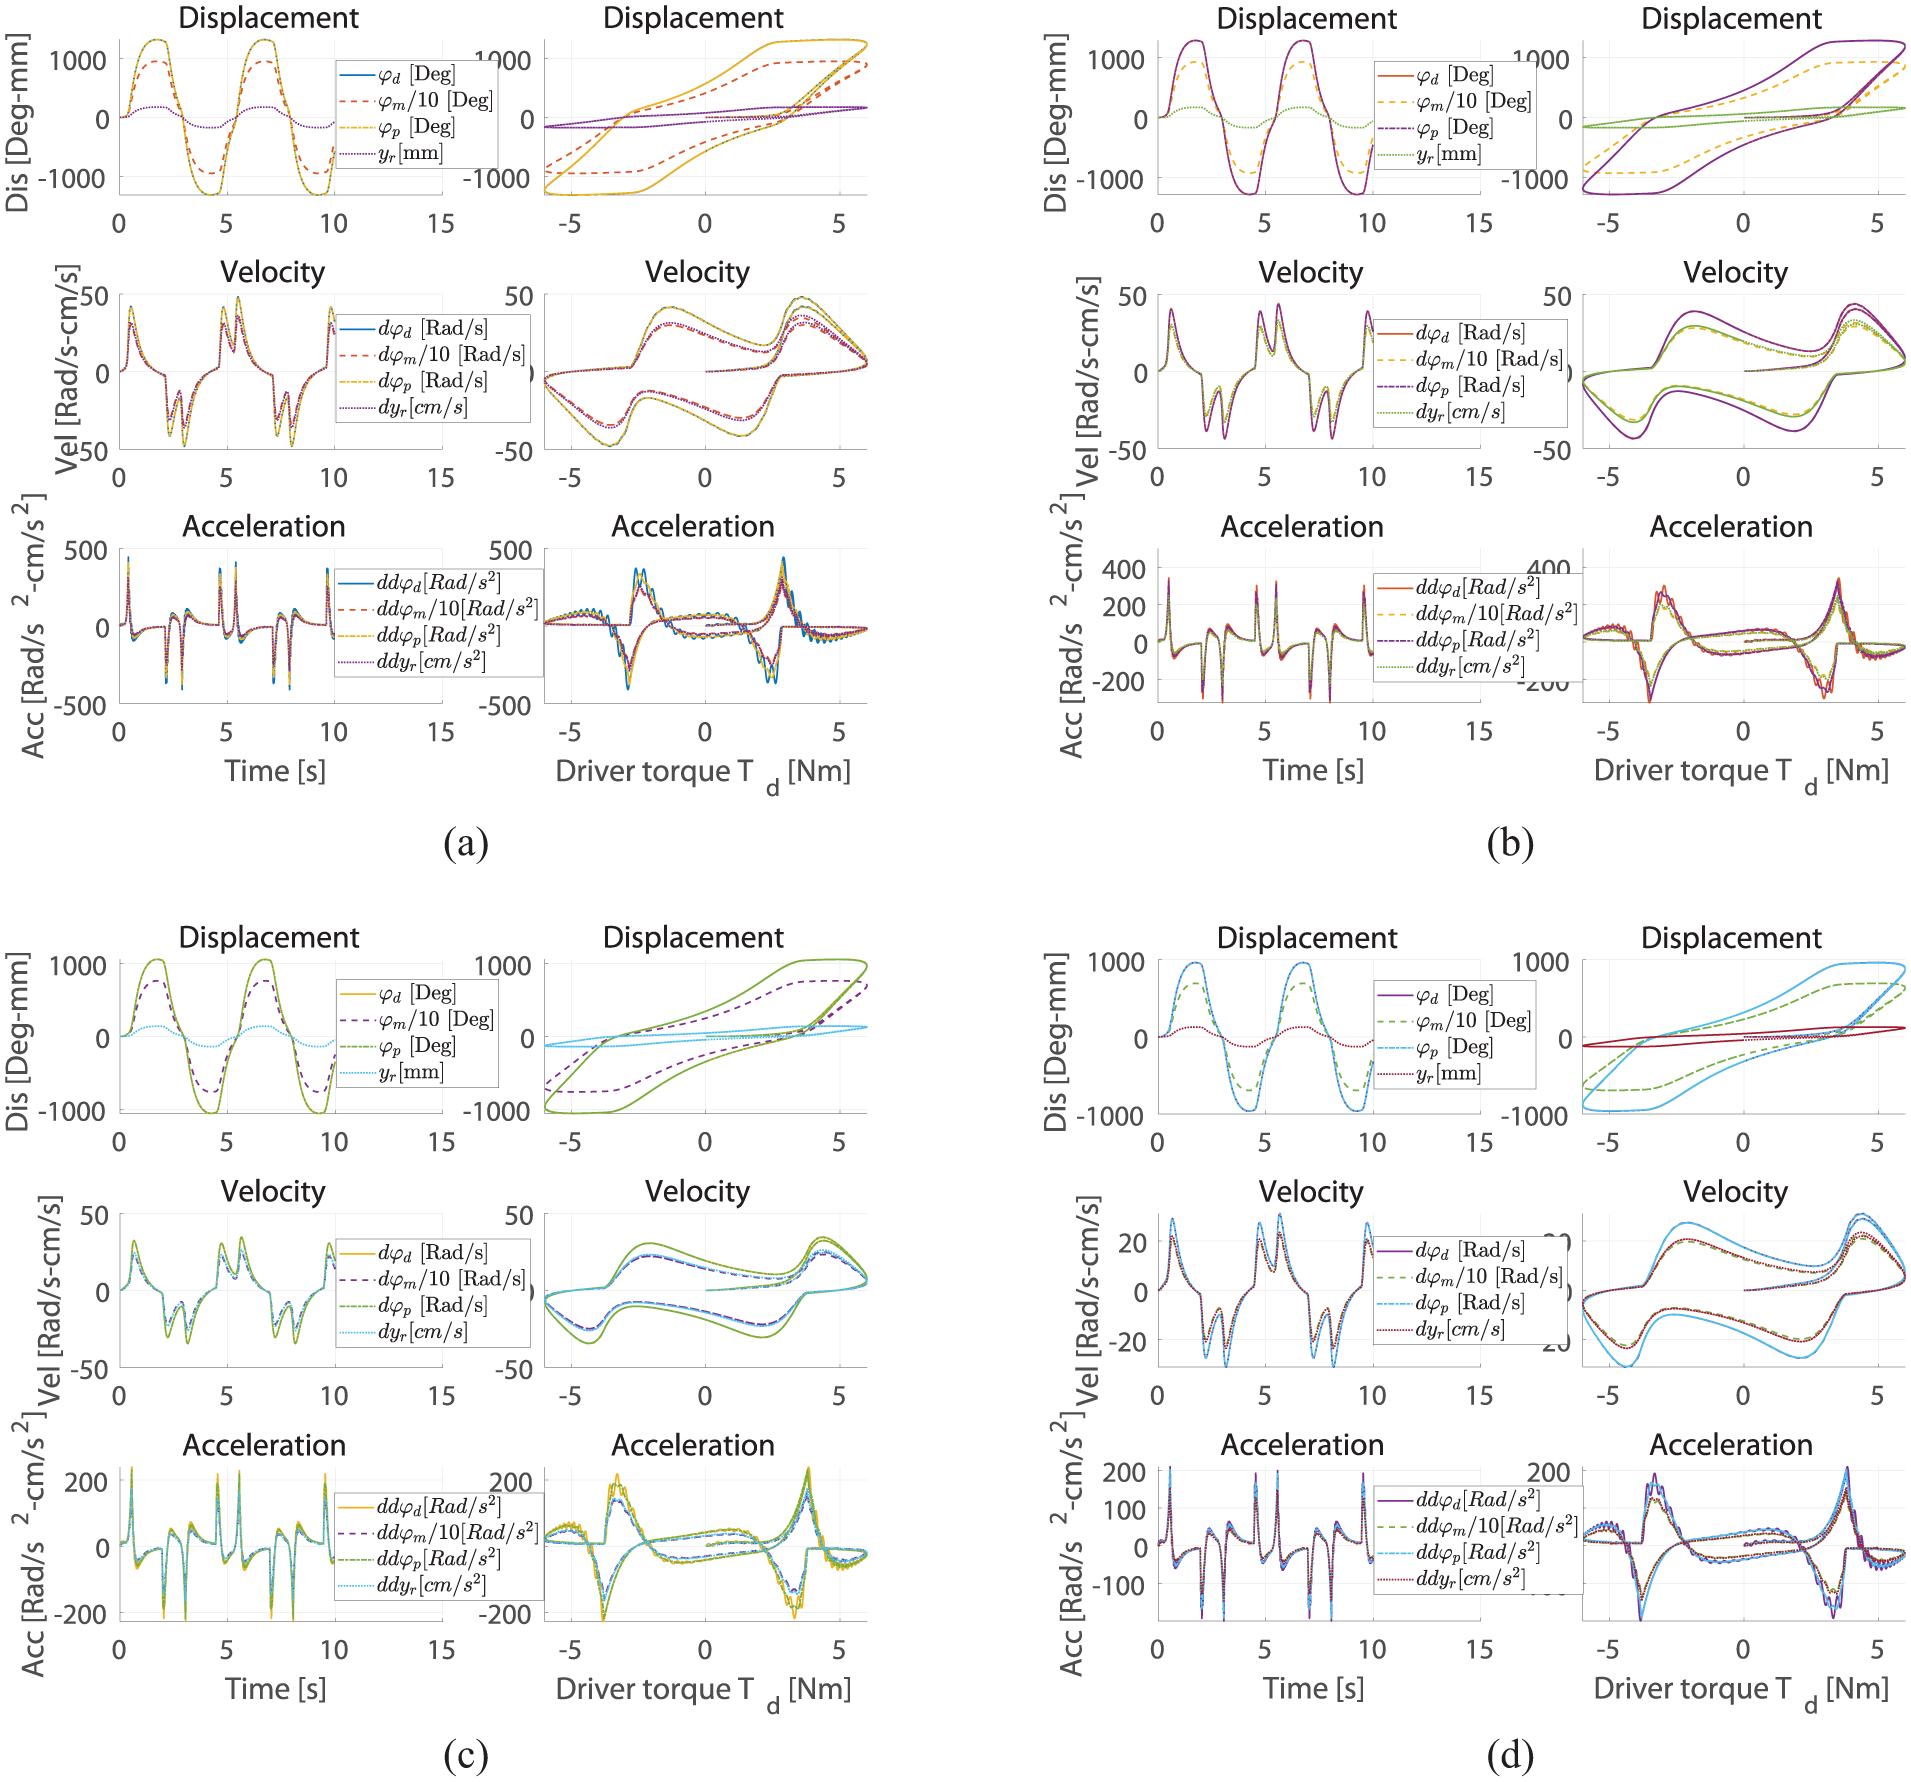
Simulation results of EPS system dynamics and the response of assist torque, the response of motor current at vehicle speeds are shown in Figures 15 to 17 and Tables 4 and 5.

Scenario 1-EPS system dynamics: (a)
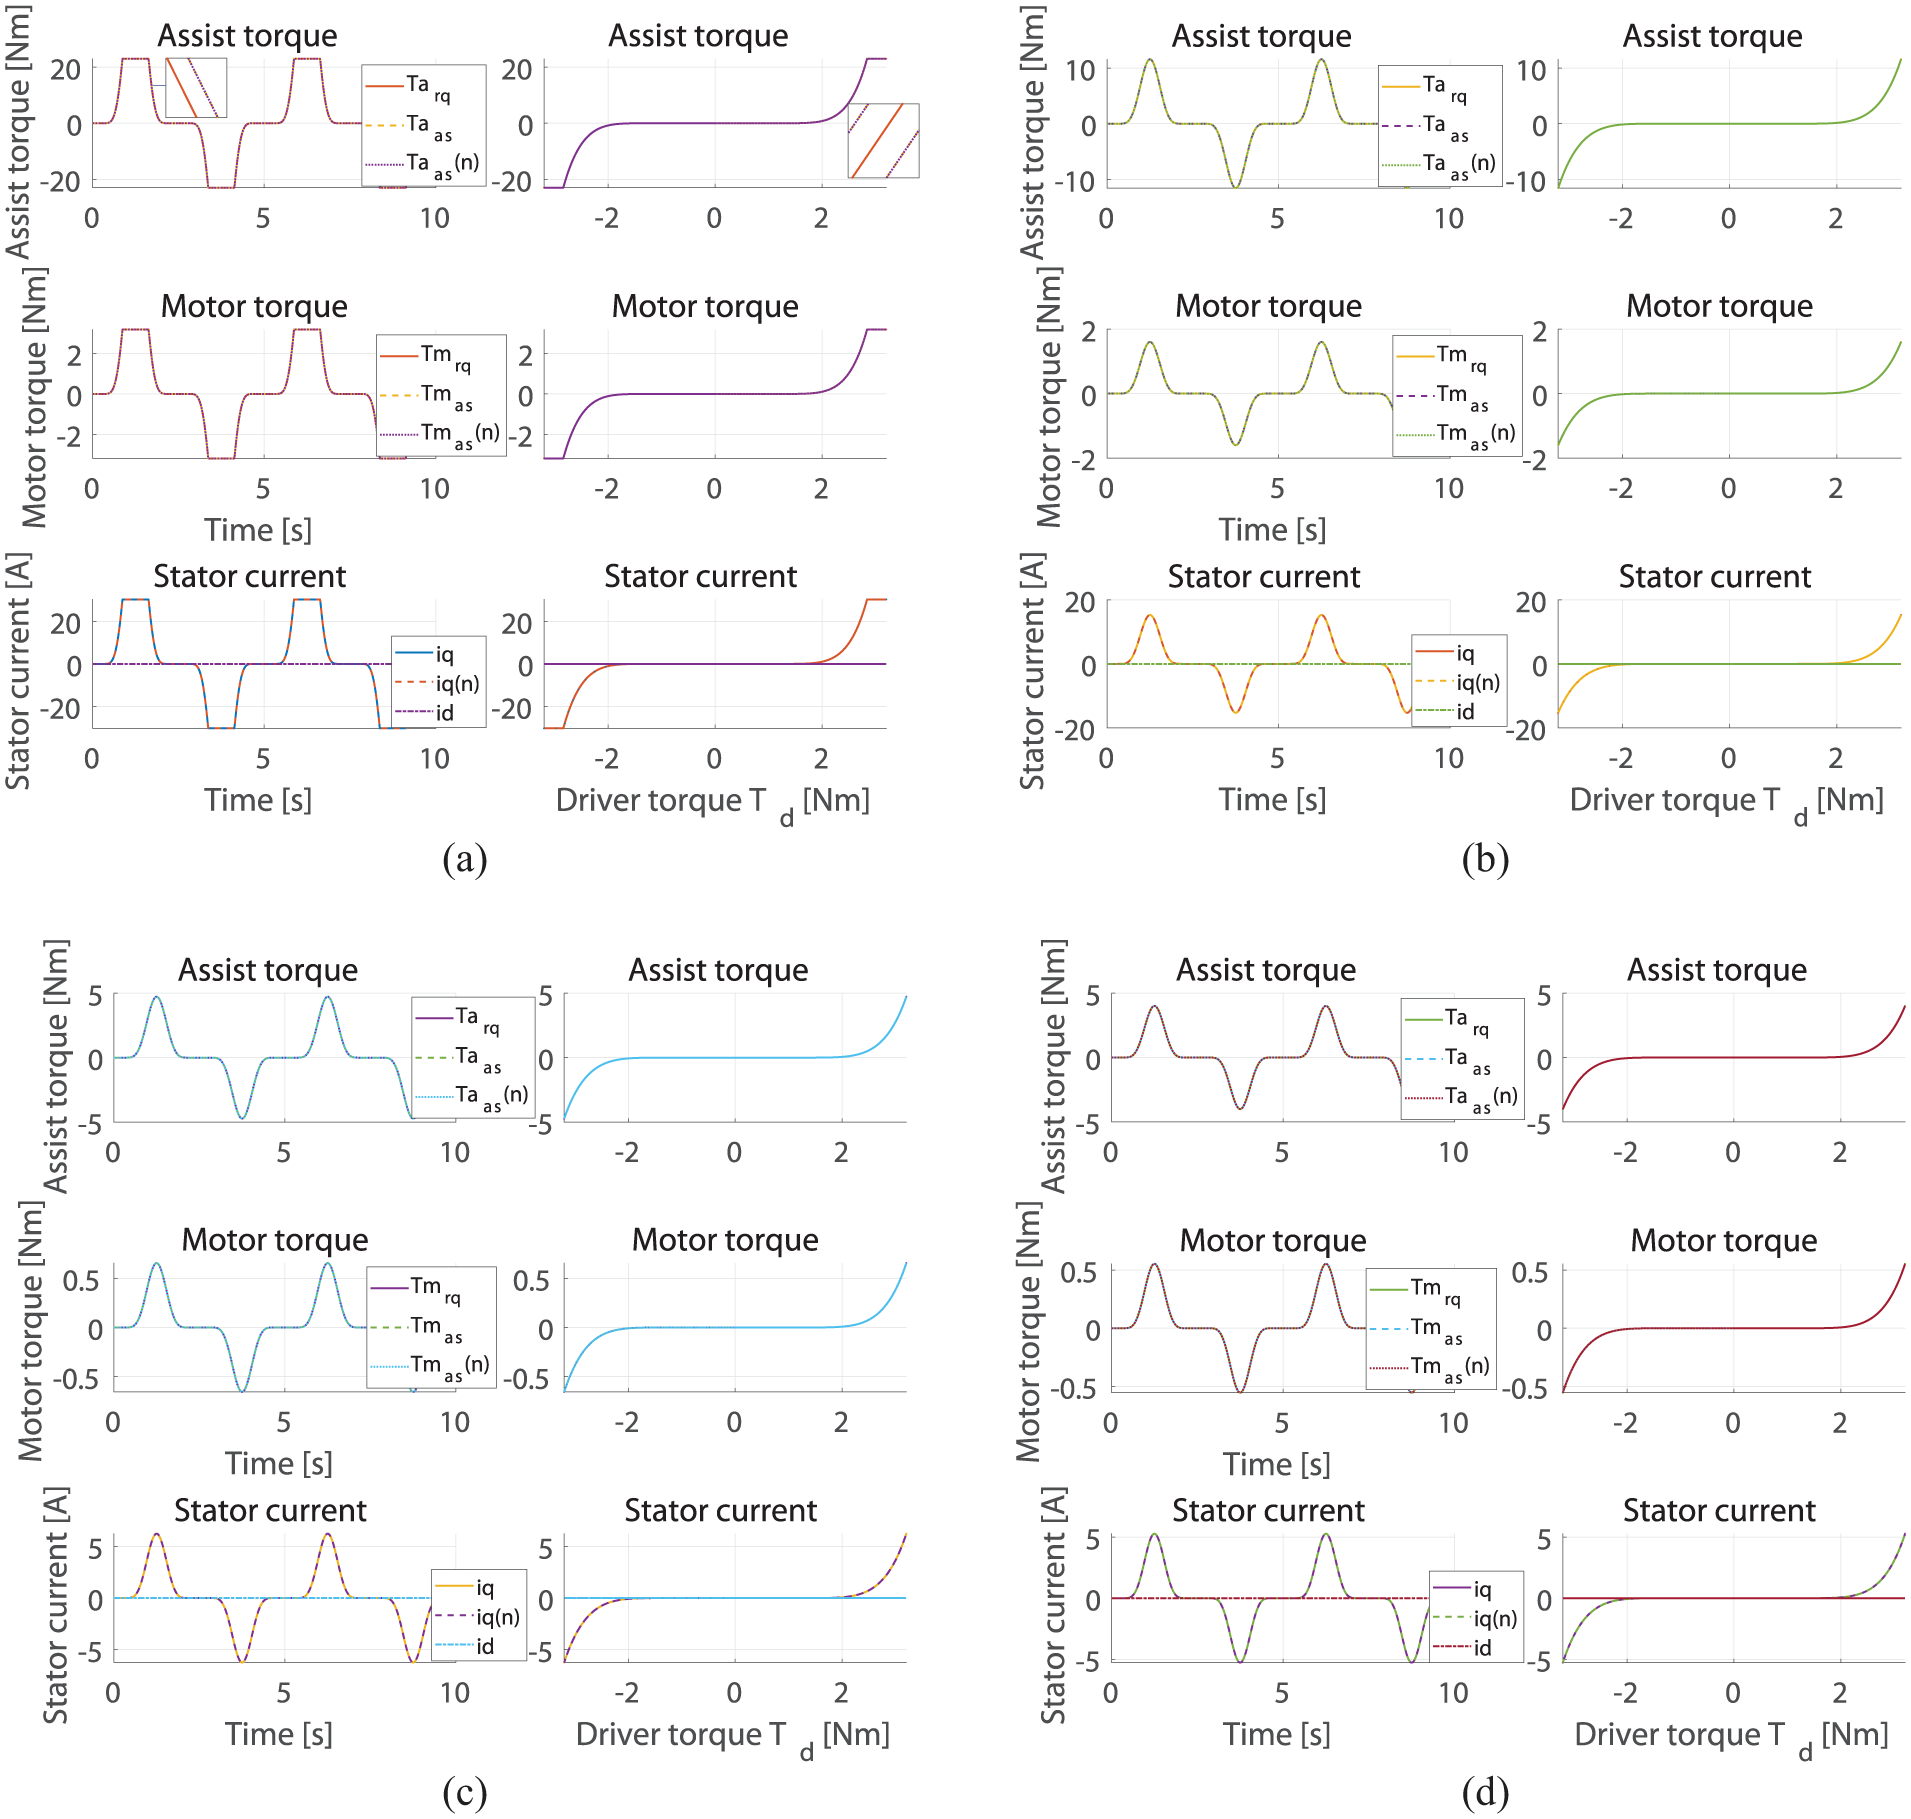
Scenario 1-Assist/Motor torque & stator current: (a)

Scenario 1-Electric motor angular velocity: (a)
Scenario 1: Kinetic value.

Scenario 1: Torque-stator current-motor speed.

It should be noticed that the symbols in these figures are defined as follows:
Analysis and evaluation of results
The EPS dynamics
The results of Figure 15 and Table 4 show that:
- The rule of variation of the steering wheel rotation angle, the electric motor rotation angle, the pinion rotation angle, and the rack displacement are consistent with the rule of the impact of the steering torque and the assist torque at all speed modes. The graphs showing the angles of rotation, the velocities, the accelerations of the steering wheel, the electric motor, the pinion, and the rack are completely similar. All of the above proves the correctness of the dynamics model and the mathematical model of the controller.
- The “Kinematic values” of the steering wheel and pinion do not completely coincide. This is due to the deformation of the steering column and pinion, however, these values are very close to each other
- From the enlarged view figure of the steering wheel rotation angle (blue curve in Figure 15) it can be seen that the “Kinematic values” between the two steering cycles have differences, this is due to the viscous resistance and dry friction in the steering system.
- There is a time lag between the torque and the “Kinematic values”: under the effect of viscous resistance and dry friction in the steering system, the kinematic cycle (
- With the same value of the steering torque
- The steering system’s kinetic cycle is the same at all vehicle speeds, so speed does not affect the system’s reaction time.
The response of the controller
(1) The response of the controller
The results of Figure 16 and Table 5 show that:
- The rule of providing current and controlling the power assist torque of the electric power steering unit according to the steering torque signal and the car speed satisfies the target requirements set for torque support according to equation (55).
- From Figure 16, the controlled assist torque
- Figure 16 shows that the control current meets the requirement of the power assist torque. Specifically, when
- Variations of current intensity value and power assist torque values are inversely proportional to car speed,
- The simulation results also show the value of
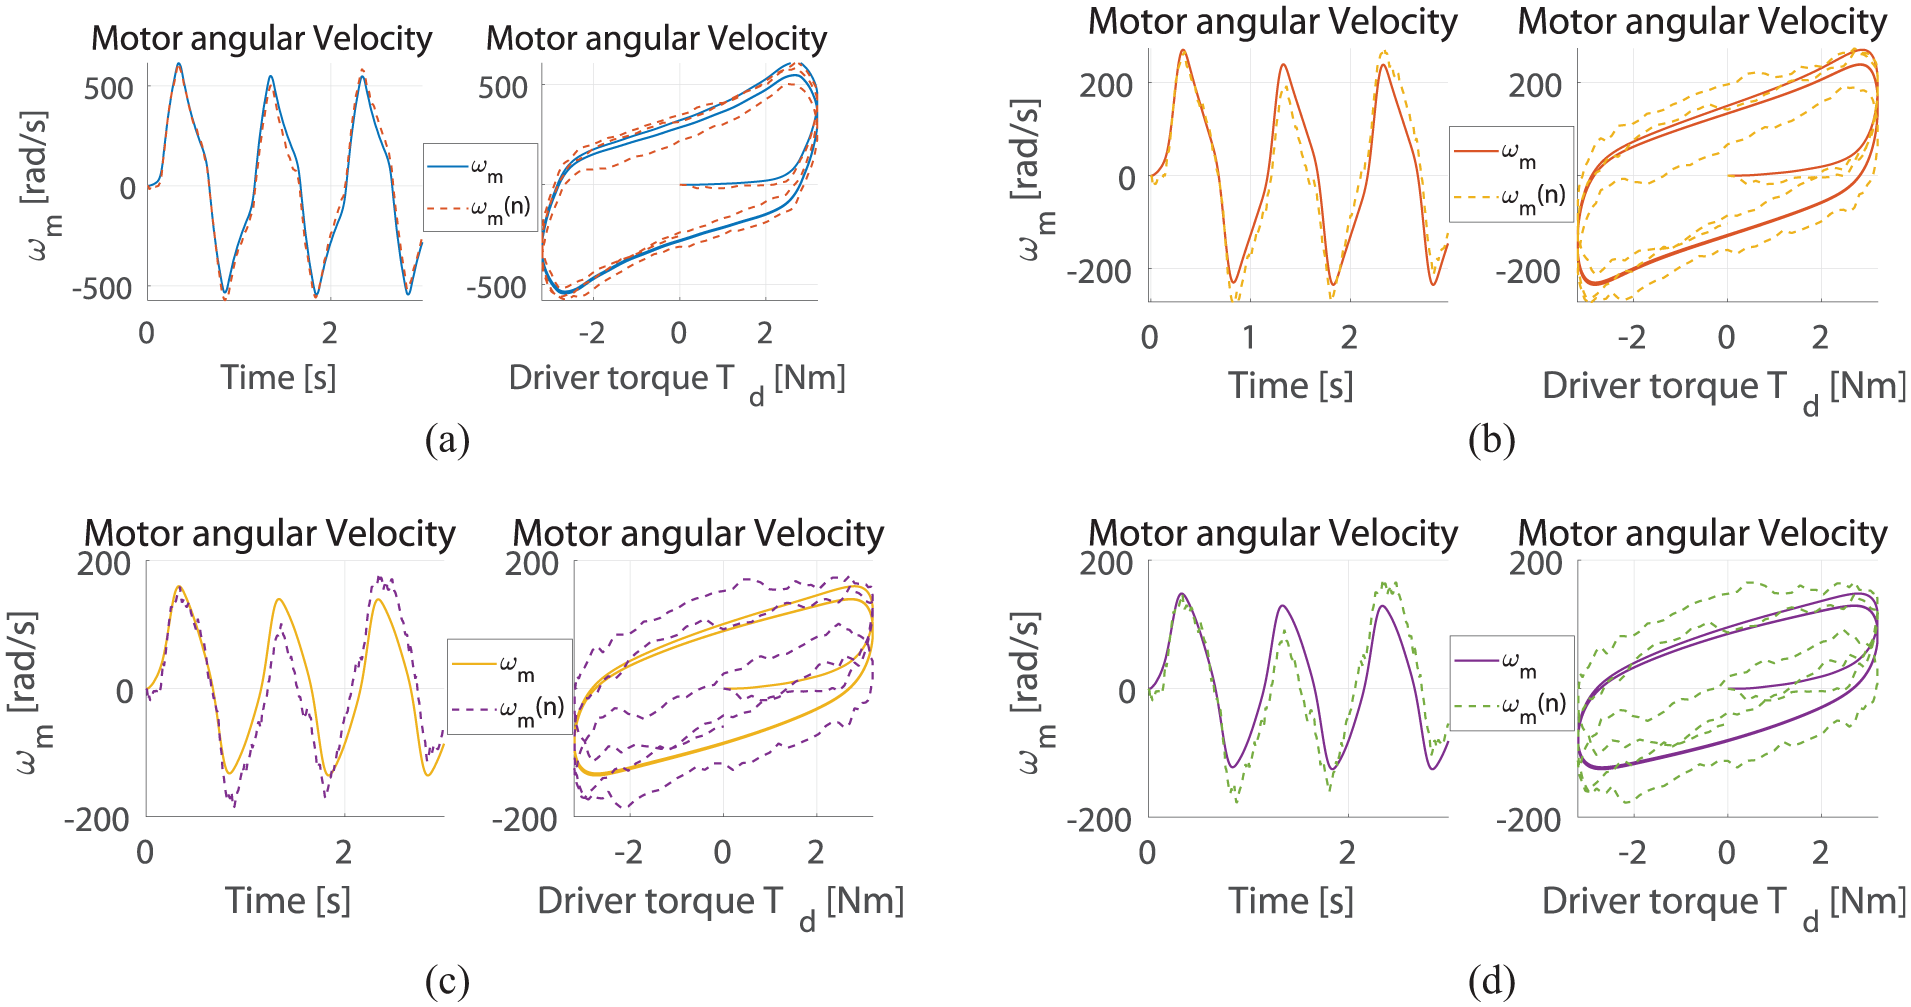
- From Figure 17, the change in engine angular velocity when there is a disturbing torque compared to when there is no disturbing torque increases significantly as the vehicle speed increases. This proves that the higher the car speeds, the greater the influence of the disturbing torque on the steering system. However, with the steering system equipped with EPS, the influence of this disturbing torque is completely overcome as demonstrated above.
(2) Efficiency of the FOC control method
Figure 16 shows that in all working modes, the FOC controller always controls the
First, FOC decouples torque and flux control, optimizing performance and simplifying the control problem. Since the torque is directly proportional to
Second, this strategy enhances energy efficiency, as maintaining
Third, FOC improves precise torque control, ensuring fast response and high accuracy, making it ideal for applications requiring high sensitivity, such as EPS systems and electric vehicles. … By maintaining a high torque-to-current ratio, FOC with
Scenario 2: Td = 6sin (
time) Nm; (Frequency f = 0.2 Hz
Simulation results
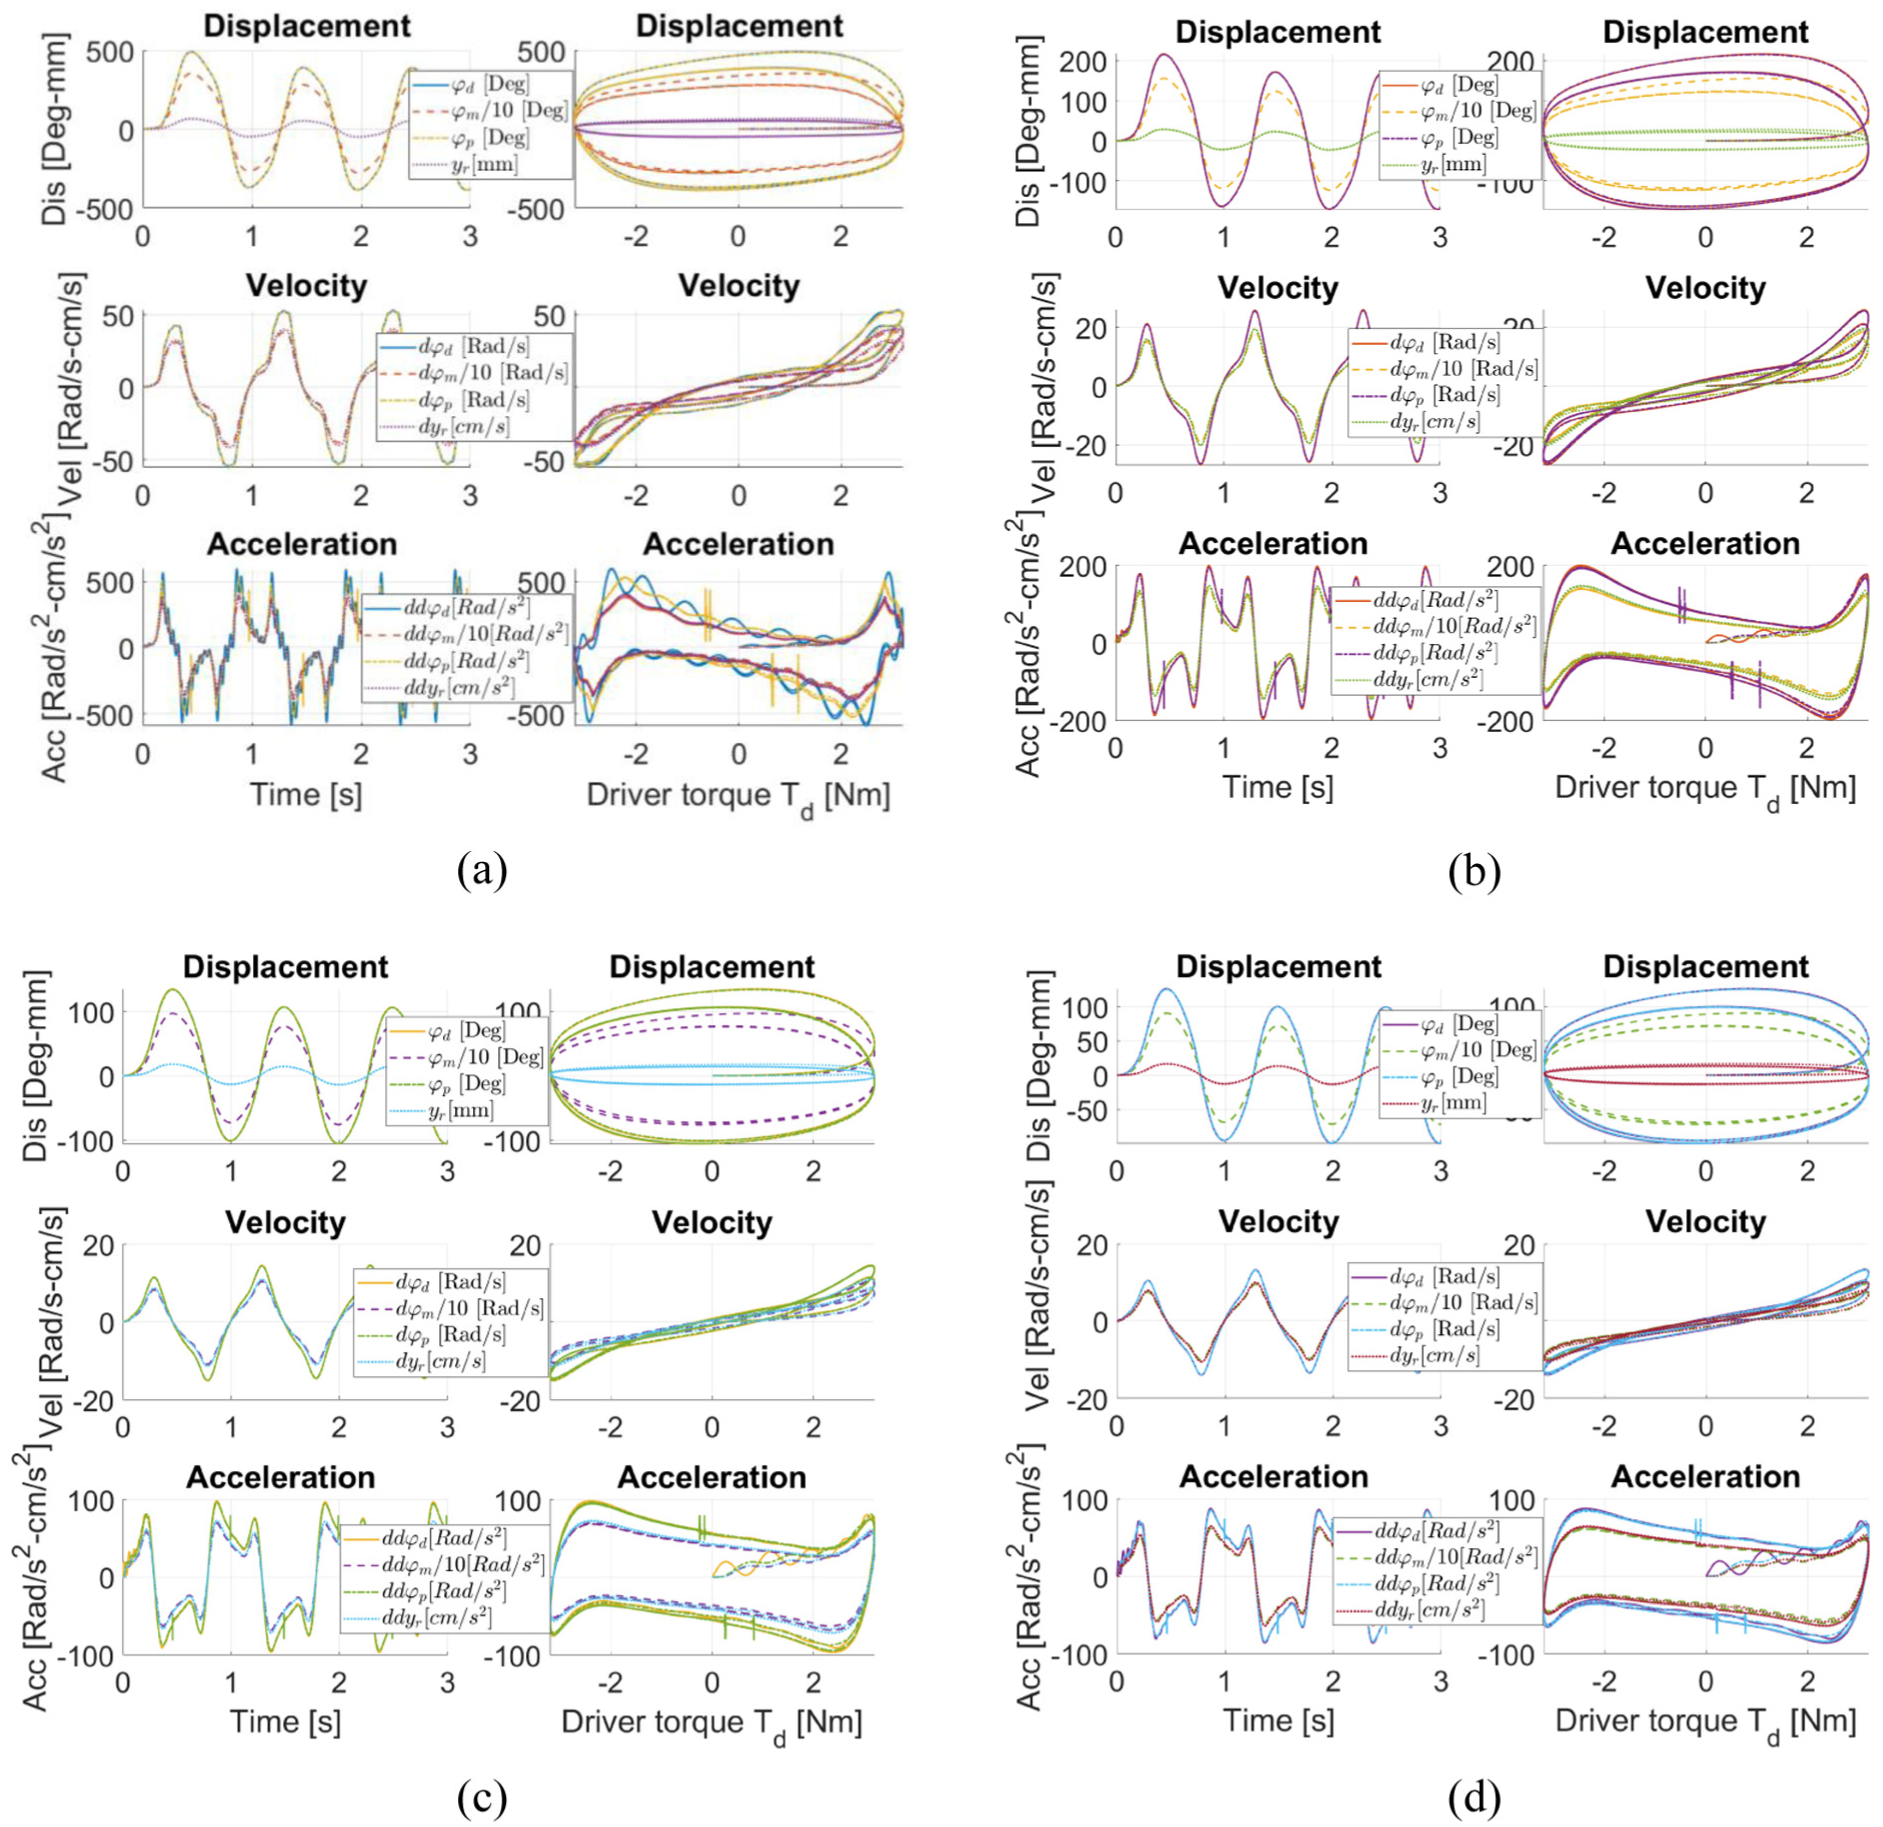
Simulation results of the EPS system dynamics and the response of assist torque, the response of motor current at vehicle speeds are as shown in Figures 18 to 20 and Tables 6 and 7.
Scenario 2-EPS system dynamics: (a)

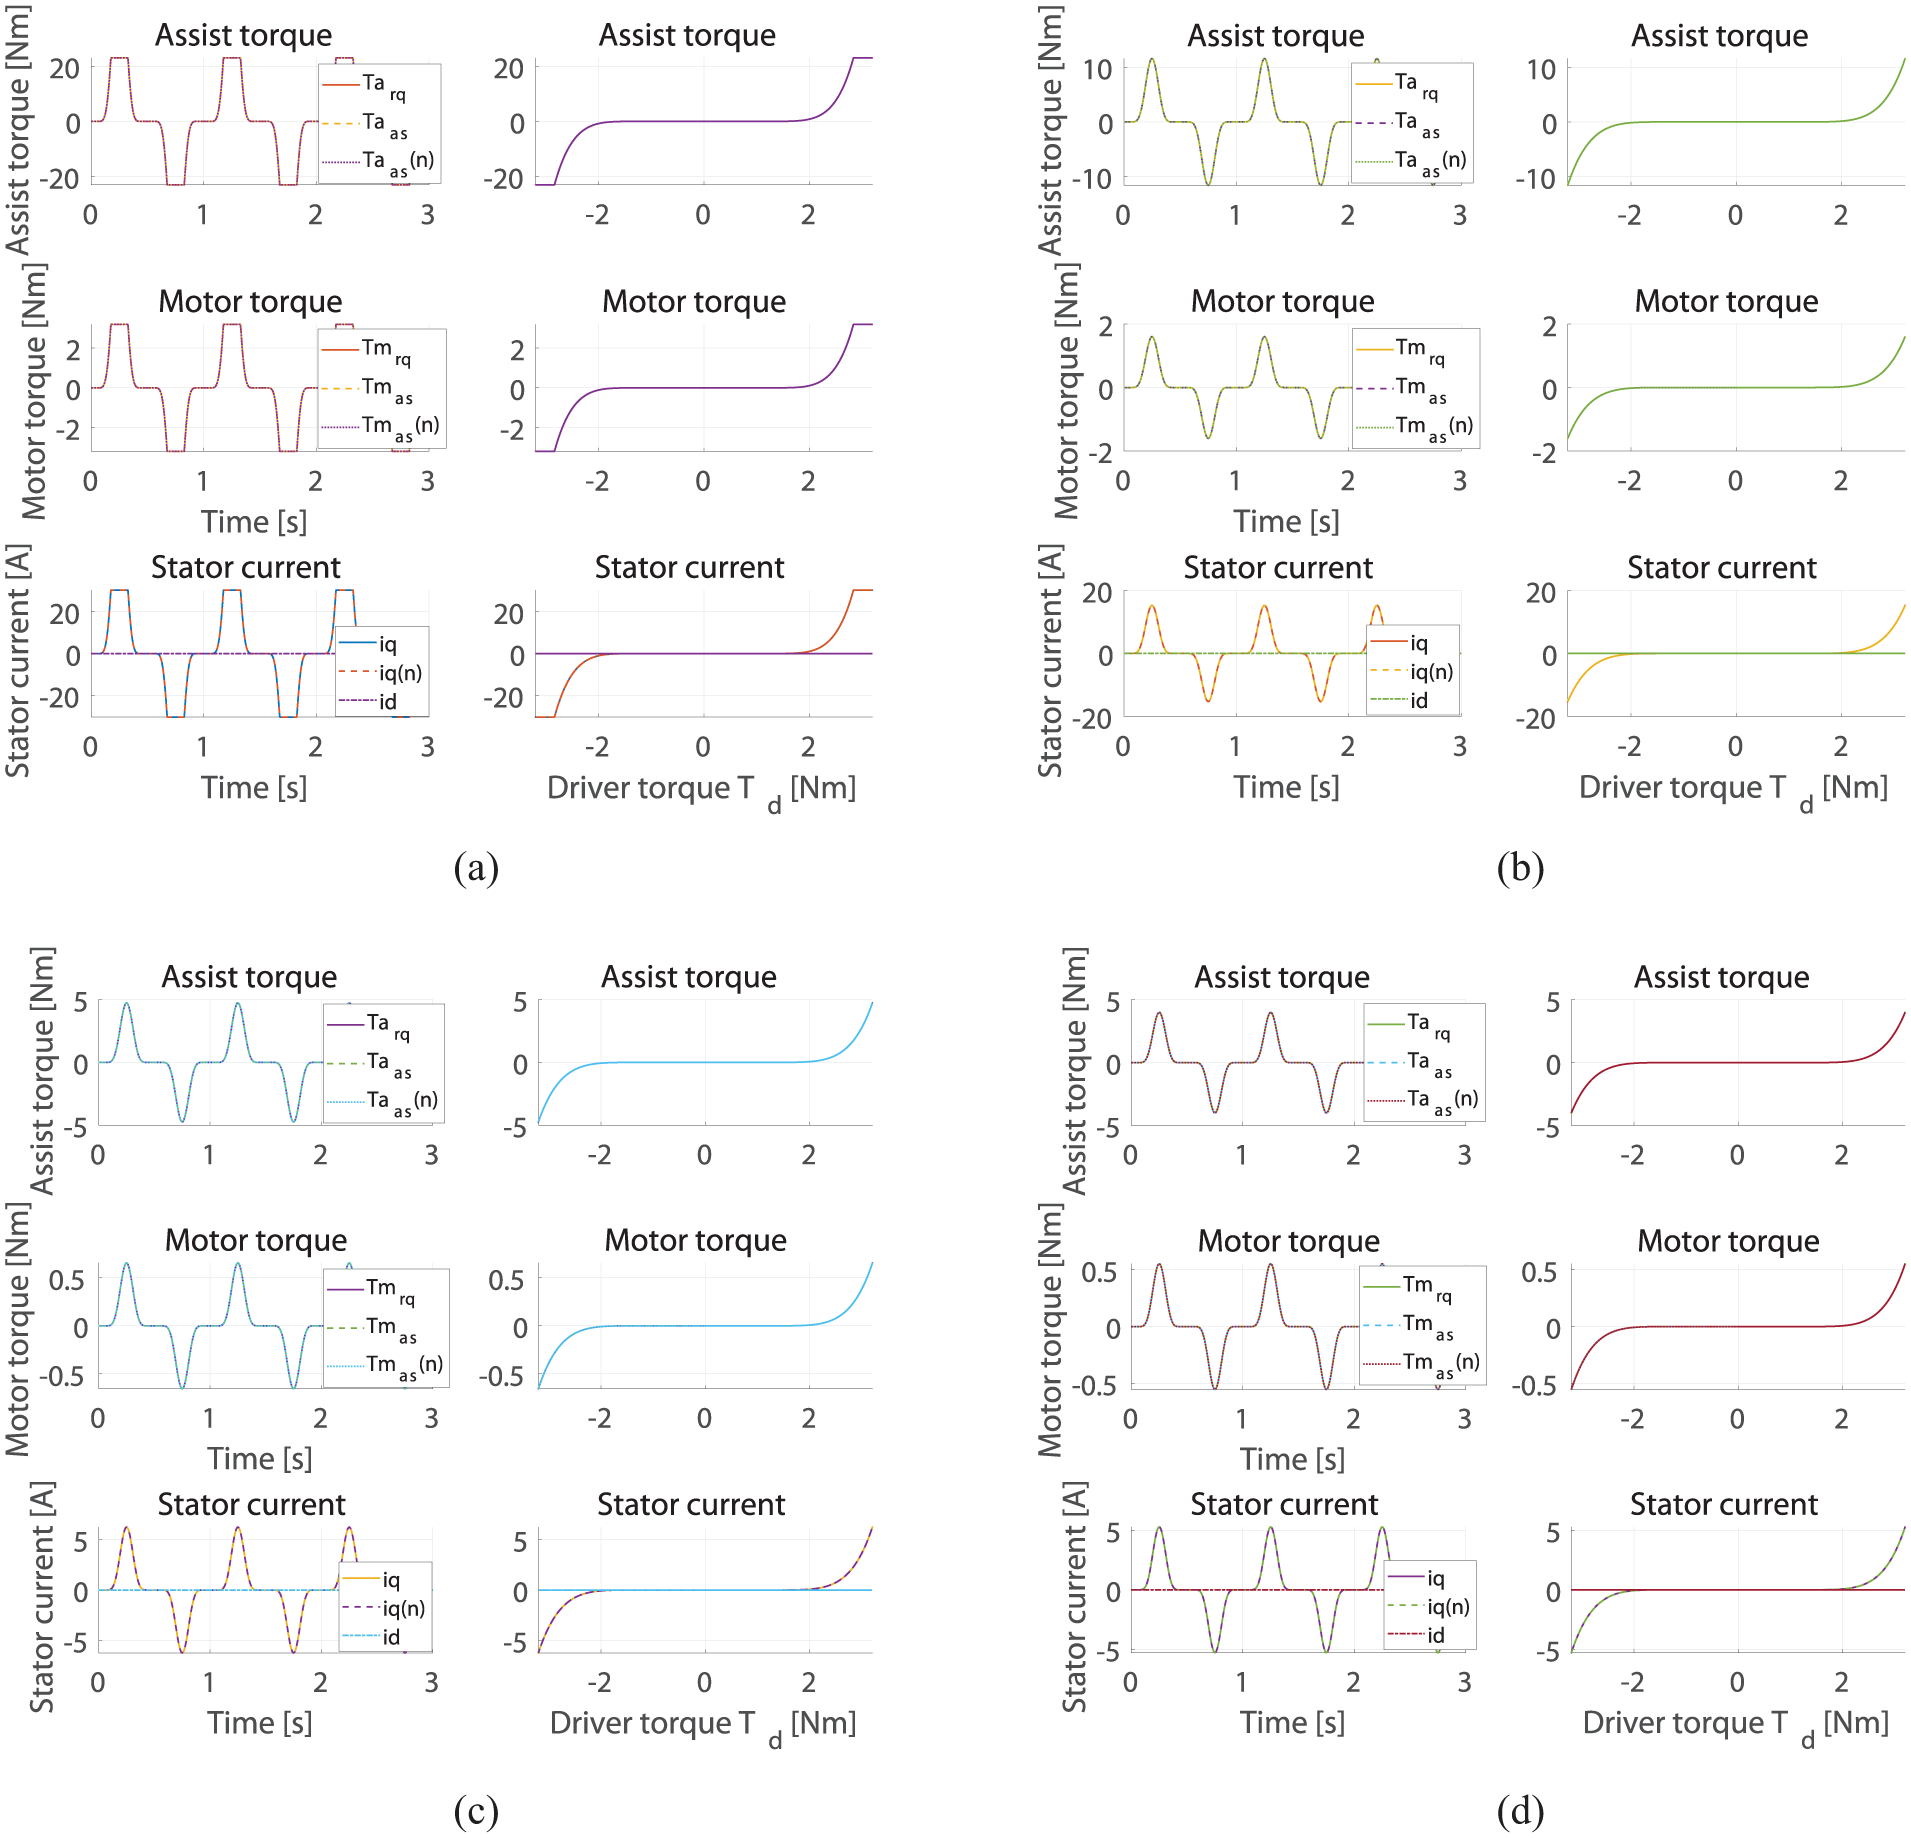
Scenario 2-Assist/Motor torque & stator current: (a)

Scenario 2- Electric motor angular velocity: (a)
Scenario 2: Kinetic value.
Case 2: Torque-stator current-motor speed.

Analysis and evaluation of results
The EPS dynamics
The results of Figure 18 and Table 6 show that:
- Scenario 3 when
- Because the maximum steering torque is larger than the steering torque when the power assist torque reaches the maximum value at all speeds
- When increasing
- The deviation between the two kinetic cycles does not change compared to Scenario 1, so the magnitude of the steering torque does not change the dynamic delay of the steering system.
- The time lag between the driving torque action cycle and the kinetic cycle of the steering system does not change compared to Scenario 1
The response of the controller
The results of Figure 20 and Table 7 show that:
- The rule for supplying current and controlling the power steering torque of the electric power steering assembly according to the steering torque signal and the car speed satisfies equation (55) similar to scenario 1.
- From Figure 19, the controlled assist torque
- Figure 19 shows that the control current meets the requirement of the power assist torque. Specifically, when
- The simulation results also show the value of
Scenario 3: Td = 3.2sin (
time) Nm; (Frequency f = 1.0 Hz
Simulation results
Simulation results of the EPS system dynamics and the response of assist torque, the response of motor current at vehicle speeds are as shown in Figures 21 to 23 and Tables 8 and 9.
Scenario 3- EPS system dynamics: (a)
Scenario 3- Assist/Motor torque & stator current: (a)
Scenario 3- Electric motor angular velocity: (a)
Scenario 3: Kinetic value.

Scenario 3: Torque-stator current-motor speed.

Analysis and evaluation of results
The EPS dynamics
The results of Figure 21 and Table 8 show that:
- The dynamics of the steering system at different steering frequencies follow the same rules as Scenario 1 and 2, which proves the accuracy of the EPS dynamic model, PMSM dynamic model, and simulation model.
- When the maximum value of the max steering torque
- When the steering frequency increases, the time lag in a steering cycle of the steering system increases significantly: The kinetic cycle
The comparison of “Kinetic values” Scenario 2/Scenario 1 and Scenario 3/Scenario 1.
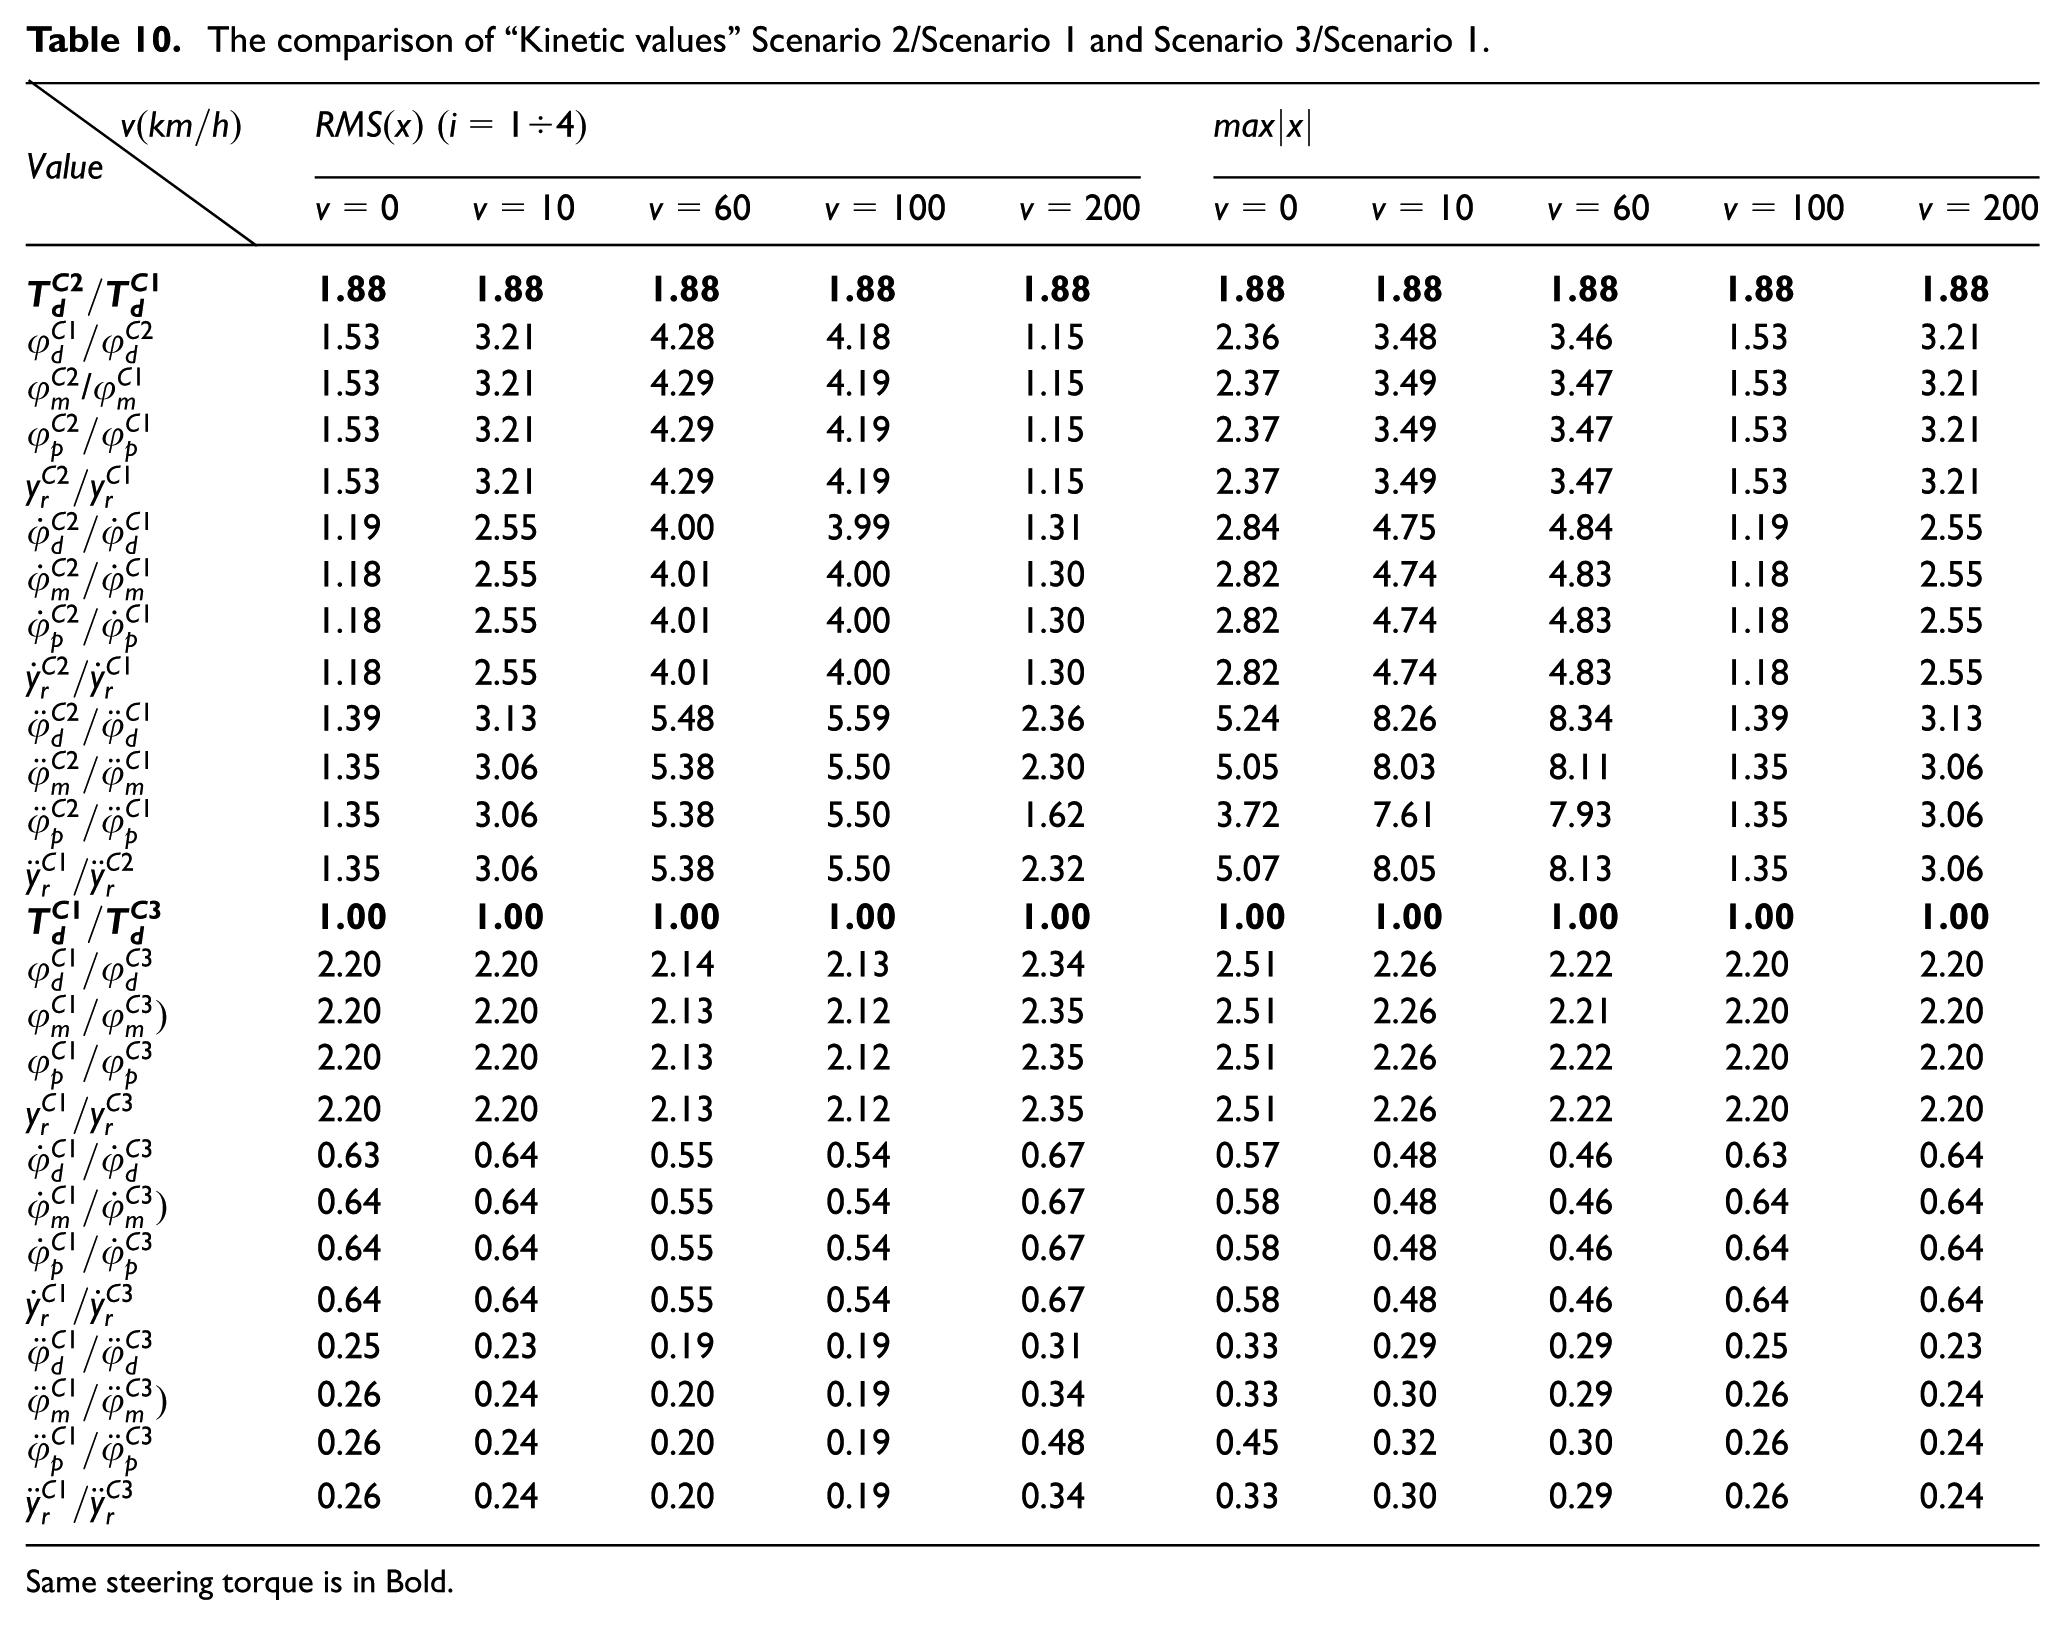
Same steering torque is in Bold.

EPS dynamics with different steering frequency and vehicle speed: (a)
The response of the controller
- From Figure 23 and Table 9, shown that the controller always meets the control current closely following the required current at all frequencies.
- When the steering frequency increases, the electric motor speed decreases to ensure that the assist torque and control current values do not change, so the assist torque value of the electric motor does not depend on the steering frequency but only depends on the steering torque and vehicle speed.
The comparison table of “Kinetic values” Scenario 2/Scenario 1 and Scenario 3/Scenario 1 are as shown in Table 10.
From the simulation results obtained in the above test cases, the following general evaluations can be drawn:
Effect of material elasticity: Due to the elasticity of the components in the steering system, a discrepancy arises between the actual steering wheel rotation angle and the angle calculated based on steering kinematics. In EPS systems, this difference can be compensated for through appropriate controller design algorithms. Therefore, the influence of material elasticity must be taken into account during the development of the power steering system to ensure accurate response.
Impact of viscous resistance and dry friction: Viscous resistance and dry friction within the steering system lead to increased power consumption and response lag. To address this issue, two approaches can be considered: First, if the controller uses steering torque as the input signal, it must incorporate compensation mechanisms for time lag, including both viscous resistance and friction. Alternatively, the controller can be designed to use the steering wheel angle as the input signal instead of steering torque, thereby minimizing the impact of these nonlinear resistive forces.
Influence of steering frequency: Steering frequency significantly affects system time lag – the higher the frequency, the greater the delay. This effect is critical and must be carefully considered in controller design to ensure a responsive and natural steering feel under dynamic driving conditions. To minimize the dynamic delay observed between steering torque and steering angle due to the Influence of steering frequency, several targeted strategies can be employed. First, enhancing the controller inputs by steering angular velocity can improve responsiveness to rapid steering maneuvers. Second, integrating a feedforward compensation loop, based on a vehicle dynamic model, enables preemptive current command generation to reduce reliance on delayed feedback. Additionally, phase-lead compensation can be applied to the current control loop to counteract phase lag induced by motor inductance and sampling delays. For further improvement, model predictive control (MPC) or hybrid ANFIS–sliding mode control structures can be adopted to optimize control signals under varying dynamic conditions. Computational latency should also be addressed by implementing the ANFIS algorithm in fixed-point arithmetic on automotive-grade ECUs. These enhancements can significantly improve control accuracy and reduce delay, particularly under high-frequency steering conditions.
To ensure the practical deployment of the ANFIS-FOC controller in embedded EPS systems, computational load and processor constraints must be addressed. Current automotive EPS systems, such as those by Bosch and Nexteer, use high-performance microcontrollers like the Infineon AURIX TC3xx or NXP S32K platforms, typically operating at 200–300 MHz, supporting control loops below 1 ms. Experimental implementation of ANFIS on an ARM Cortex-M4 (STM32F4 @168 MHz) for MPPT systems demonstrated inference times as low as 100 µs, 41 aligning with the 1 kHz control rate required in EPS applications. This confirms that ANFIS can be executed in real-time on automotive-grade ECUs. Further optimization can be achieved through fixed-point arithmetic, rule reduction via fuzzy clustering, and precomputed lookup tables. These techniques can reduce execution latency to under 200 µs, ensuring compliance with the low-latency demands of EPS systems.
Conclusions
This study presents significant scientific and practical advancements in the optimization of EPS systems. Scientifically, the integration of an ANFIS with FOC enhances the precision and adaptability of EPS control. By dynamically adjusting control parameters in real time, the proposed approach improves steering accuracy and system responsiveness. The development of a comprehensive dynamic model, incorporating nonlinear factors such as material elasticity, viscous resistance, and dry friction, increases the fidelity of EPS simulations. Moreover, the refined modeling of road resistance torque, which considers key geometric and force-related parameters, contributes to a more realistic representation of steering behavior and advances EPS control system design.
From an applied engineering standpoint, the proposed methodology substantially improves both driving comfort and vehicle stability. Enhancing torque tracking accuracy and system responsiveness to road-induced disturbances, it enables improved steering feedback and reduced driver effort across diverse operating conditions. The identification of critical limitations in conventional EPS controllers, particularly dynamic delays attributed to system elasticity, friction, and frequency, lays the groundwork for further refinement of steering dynamics. These contributions provide valuable guidance for the optimization of EPS architecture, including energy-efficient control and real-time performance enhancement. Such advancements are particularly relevant given the increasing integration of EPS systems in autonomous and electric vehicles. 42
Potential risks and future research directions: Despite its demonstrated effectiveness, the proposed approach faces several challenges. The reliance on ANFIS for adaptive control introduces computational complexity, which may limit real-time implementation in embedded EPS systems with constrained processing capabilities. Although the FOC method enhances motor torque control, it remains sensitive to parameter variations, necessitating precise tuning to ensure stability. Additionally, external disturbances such as changes in road adhesion, sudden vehicle load shifts, or temperature-induced variations in motor performance may affect the robustness of the control system. The accuracy of fuzzy inference also depends on the optimal calibration of rule sets, which may be influenced by variations in vehicle dynamics and driver behavior in real-world conditions. The delay problem at high driving frequency also needs to be overcome.
To address these limitations, future research will focus on: Optimizing computational efficiency by developing lightweight, AI-based control algorithms that maintain adaptability while reducing processing demands. Incorporating online learning techniques into the ANFIS framework to improve real-time adaptability under dynamic road and vehicle conditions. To reduce dynamic delay between steering torque and angle at high frequencies, control strategies include incorporating steering rate input, applying feedforward compensation, using phase-lead correction, and adopting advanced methods such as model predictive control or hybrid ANFIS-sliding mode control to enhance responsiveness. Conducting experimental validation through real-world vehicle testing to refine the model and ensure practical applicability. Exploring hybrid control strategies that integrate data-driven methods with robust analytical models to further enhance EPS responsiveness, energy efficiency, and stability across diverse driving environments.
Footnotes
Handling Editor: Chenhui Liang
Author contributions
Conceptualization, N.H.Q., V.V.T., and O.S.; methodology, N.H.Q. and V.V.T.; software, N.H.Q. and V.V.T; validation, N.H.Q., O.S; formal analysis, N.H.Q. and V.V.T.; investigation, O.S; resources, N.H.Q.; data curation, V.T.V.; writing-original draft preparation, N.H.Q., V.V.T.; writing – review and editing, V.T.V., O.S.; visualization, V.T.V.; supervision, O.S.; project administration, N.H.Q., V.V.T., and O.S; funding acquisition, N.H.Q. All authors have read and agreed to the published version of the manuscript.
Funding
The authors disclosed receipt of the following financial support for the research, authorship, and/or publication of this article: This research is funded by the University of Transport and Communications (UTC) under grant number T2025-CK-007.
Declaration of conflicting interests
The authors declared no potential conflicts of interest with respect to the research, authorship, and/or publication of this article.
Data availability statement
In this paper, the research results are novel and not previously published. The approach, research methods, research results and analysis, and evaluation are all directly conducted by the authors.