
Abstract
Herein, an adaptive convolutional neural network (CNN)-based principal component analysis (PCA) algorithm for the detection of manufacturing data is proposed. The mentioned algorithm adaptively selects a suitable classification scheme (a CNN-based scheme or PCA-based support vector machine scheme) on the basis of various types of inputs to detect manufacturing data. Insufficient image signals usually lead to poor performance or failure in visual inspection tasks. For example, feature extraction might fail in vision-based detection methods when no image signals are detected in a manufacturing process. Vision-based inspection is challenging in manufacturing processes. The proposed algorithm can be employed to detect image signals and to obtain manufacturing data when image features cannot be extracted. In an experimental investigation, this algorithm successfully classified manufacturing data on the basis of different inputs and outperformed existing methods for detecting and classifying such data. In summary, the proposed algorithm utilizes a CNN to recognize image signals and employs PCA-based support vector machine scheme for processing measurement data inputs. This adaptive algorithm is capable of learning from limited image signals or features, enhancing data interpretability and increasing the amount of feature information for detecting manufacturing data.
Keywords
Introduction
Visual inspection represents a nondestructive technique that is frequently used in manufacturing or production processes. This technique involves using digital image data to detect defects in manufactured products. However, when insufficient image data are captured and insufficient image features are extracted, the aforementioned technique cannot quickly and consistently identify defects, which can lead to production failure. CNN-based methods are commonly employed in image classification and computer vision applications. Nevertheless, these methods, which process input data through a filter to generate a feature map, may fail to extract significant information from visual inputs if the image signals captured are inadequate. A new approach has been developed to address the issue of CNNs struggling with visual inspection tasks due to inadequate image features by selecting an appropriate feature extraction method to enhance informative features. This algorithm can perform PCA-based data extraction when image signals are lacking. PCA is a powerful tool for feature analysis that improves data interpretability while preserving the most information. Various PCA techniques for data extraction have been studied.1–4 When combining CNN and PCA, determining the optimal number of components to retain is a complex yet essential task. For instance, Abdul-al et al. 5 utilized a combination of CNN, PCA, and sequential neural networks to improve multi-modal facial recognition, with PCA playing a vital role in enhancing accuracy and efficiency. Similarly, You et al. 6 applied PCA to investigate hyperspectral microscope imaging (HMI), where PCA was instrumental in developing a key CNN-based HMI model. In comparison to these techniques, our CNN-based PCA algorithm is designed to adaptively choose an appropriate feature extraction method for detecting manufacturing data when visual inspections do not yield image features. This adaptive learning strategy aims to improve the informativeness and interpretability of the identified manufacturing data in image classification. In this approach, we developed a weight-based scree test (WST) scheme and integrated it with a support vector machine (SVM) algorithm. 7 By combining a CNN with the PCA/WST-based SVM method, we can effectively identify image signals within manufacturing data. This technique allows for training and learning with image signals, enhancing the interpretability of the manufacturing data and the features derived from it. The adaptive learning feature extraction method is well-suited for visual inspection and measurement data in manufacturing. In this study, we applied the proposed algorithm to detect images of eyeglasses and data from supercapacitor manufacturing.
We have structured the remainder of the current article as follows. We provide in Section “Related work” an overview of relevant previous research. In Section “Proposed method,” we describe the proposed CNN-based PCA method for the detection of manufacturing data. We present in Section “Experimental results and discussion” the results obtained with this method and existing machine learning methods for the detection of manufacturing data. Finally, we provide in Section “Conclusions” our study’s derived conclusions.
Related work
CNN-based techniques have been investigated for the identification of objects in manufacturing processes. 8 For example, for describing complex three-dimensional (3D) geomodels, Liu and Durlofsky 9 developed a parameterization method based on deep learning. In their method, a CNN is used to process the low-dimensional PCA features of a geomodel. A 3D geomodel created using the aforementioned parameterization method exhibited consistent geological features with those exhibited by reference models generated using object-based methods. Zhou et al. 10 compressed deep CNNs for object detection by using a progressive PCA method; they reduced the numbers of kernels and channels required for object detection. Wang et al. 11 presented a frame selection approach grounded on PCA for a CNN model; this model could be employed for classifying sow postural behaviors in videos. Videos of sows were used in the training and validation of long short-term memory and CNN models. Kotra et al. 12 used a CNN model with handcrafted image features extracted using the scattered wavelet transform to classify dermoscopic images; they registered high accuracy in the classification of skin lesions. Several studies have been proposed to combine a CNN model with the SVM algorithm to improve image classification.13–16 Xiao et al. 17 developed an improved mask region-based CNN for the purpose of segmenting cow top-view images and used an SVM classifier to identify individual cows. Katoch et al. 18 extracted speeded up robust features from images and then classified these features by using a CNN model with the SVM algorithm. Huang and Bais 19 combined CNN models with different algorithms for soil classification and found that the CNN model with the SVM algorithm achieved the highest accuracy.
The aforementioned discussion indicates that researchers have combined CNN models with feature extraction or classification algorithms to improve image processing and classification. However, in the detection of manufacturing data, these approaches might fail to extract features and exhibit poor performance when insufficient image signals are captured. To solve this problem, we developed an adaptive CNN-based algorithm and combined it with a PCA-based SVM classifier. This integrated algorithm can identify different types of input image data in manufacturing data detection. Moreover, it can increase the interpretability of manufacturing data when insufficient image signals are detected. The proposed integrated algorithm can adaptively select a suitable method grounded on CNN or PCA/SVM algorithms to increase the feature information quantity when insufficient images signals are captured.
Proposed method
We herein provide a description of our proposed adaptive CNN-based PCA algorithm.
Adaptive CNN-based PCA algorithm
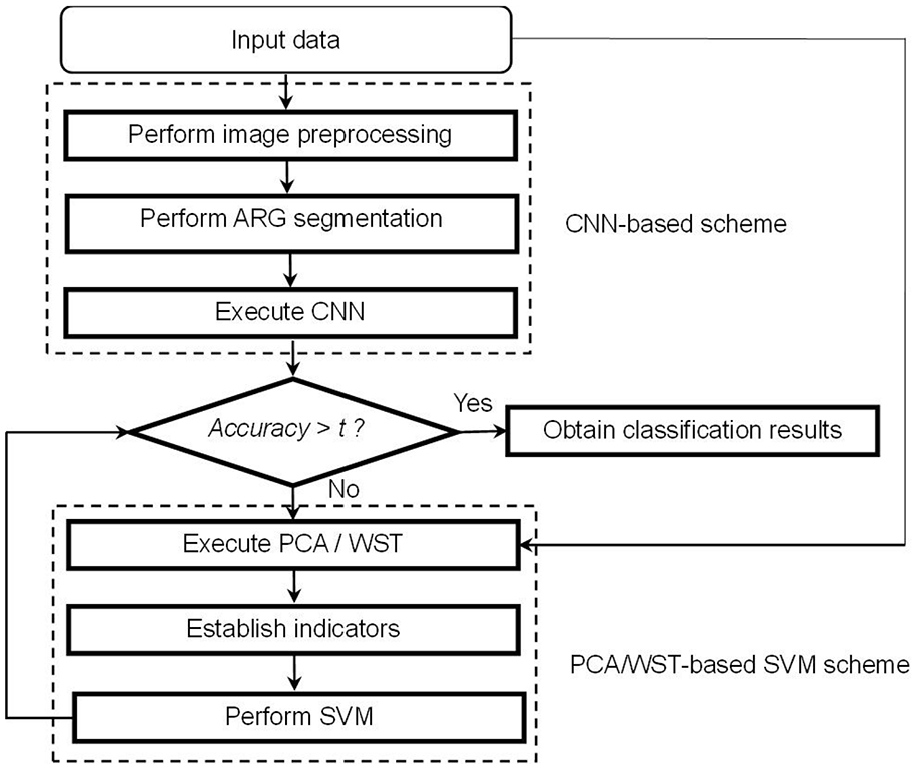
The proposed CNN-based PCA algorithm adaptively selects a suitable scheme (a CNN-based scheme or a PCA-based SVM scheme) to detect different types of input data. The framework of this algorithm is depicted in Figure 1, and the steps of the algorithm are presented in the following text.

Proposed adaptive CNN-based PCA algorithm.
Steps of the proposed algorithm
Assume that 1024 samples of manufacturing data are obtained. A total of 512 random samples are used to train the proposed algorithm, with the remaining samples being used to evaluate the algorithm’s accuracy. In the proposed algorithm, a CNN conducts image preprocessing and adaptive region-growing (ARG) segmentation to classify input images. If insufficient image signals are present in the manufacturing data, a PCA-based scheme is employed to increase the interpretability of the data. The steps of the proposed algorithm are as follows:
Step 1: Determine whether the manufacturing data contain image signals. If image signals are present, convert such signals into an image that has a size of 1024 × 768 pixels and has a grayscale depth of 8 bits (image preprocessing); otherwise, execute Step 6.
Step 2: Conduct ARG segmentation 20 by clustering adjacent pixels in growth areas, starting from a predefined set of initial seeds.
Step 3: Implement a CNN by using all obtained segmented images as the input.
Step 4: Determine the classification accuracy for all input images.

where NC and N denote the number of correctly classified test images and the total number of test images (512 in this study), respectively. Perform Step 5 and set k = 0 provided that the derived accuracy does not exceed a predefined threshold t; otherwise, repeat Steps 1–4.
Step 5: Code the image pixels (PIS).
21
The term

with li denoting the image pixels’ith intensity column vector. This vector is expressed as follows:

with n denoting the image’s number of pixels.
Step 6: Execute PCA-based feature extraction. The matrix P is composed of the data on n process variables (columns) for m image samples (rows). This matrix is expressed as follows:

where pi is the ith sample column vector. This vector is given as follows:

We can derive p, after the execution of eigenvalue decomposition, as follows:

where pe and pr are the projection vectors of p onto the principal component and residual subspaces, respectively. We can express pr as:

where

Step 7: Implement a WST scheme,
22
with

When 0.5 <
A weight

where the threshold values Ti in (10) are set sequentially as follows; {Ti} = {0.01, 0.02, 0.03, …, 0.99}, with i = 0, 1, 2, …, 98.
Subsequently, we can derive the new eigenvalues

and

The scree test scheme
When
Step 8: Implement PCA-based SVM classification. The indicator S is employed to identify features, and this indicator is defined as follows:

In this study, 1024 data samples were collected, of which 512 random samples were used for training the SVM model in each run, and the remaining 512 samples were used for model testing. We set C (a user-specified positive parameter) as 27 and the radial basis function kernel parameter (γ) as 2−9 for data detection because high accuracy was achieved with these settings. 23 The SVM model can process S, following which Step 4 is executed, with k being set as 1. In Step 4, if the accuracy exceeds the threshold t, classification results are obtained (if the algorithm is terminated); otherwise, Step 7 is executed.
Architecture of the CNN used in the proposed algorithm
Figure 2 illustrates the architecture of the CNN adopted in the proposed algorithm. This CNN contains two convolution layers, with each of them being succeeded by a max pooling layer. The second max pooling layer is followed by a flatten layer, which flattens two-dimensional features into a one-dimensional array. This one-dimensional array is subsequently transferred to a fully connected layer with 1024 neurons. The output array is composed of m neurons, with m denoting a class’s total sample number. The dropout layers of the adopted CNN randomly discard nodes to reduce the overfitting and generalization error during training. The training procedure is described as follows. First, segmented images that have been resized to 64 × 64 pixels are input to the adopted CNN. Second, to maintain the input image pixels, the first convolutional layer uses 32 filters with a 3 × 3 kernel to conduct zero padding to create 32 channels with a size of 64 × 64 pixels. Within this layer, the rectified linear unit (ReLU) activation function is employed for removing negative values from the output of the convolution. Third, the output of the convolution is passed through a 2 × 2 max pooling layer to select elements with distinguished features. Fourth, the 32 channels created through zero padding are then transferred to the second convolutional layer composed of 64 filters with a 3 × 3 kernel. This layer produces 64 channels with a size of 32 × 32 pixels from the aforementioned channels by padding the input pixels. The ReLU activation function is employed within the second convolutional layer. Fifth, a 2 × 2 max pooling operation is performed on the convolved output to obtain 64 channels with a size of 16 × 16. Sixth, these channels are input to a flatten layer to flatten two-dimensional features into a one-dimensional array. The dropout rate used in the flattening process is 0.25. Seventh, the obtained one-dimensional feature array is transferred to a 1024 neuron – containing fully connected layer. The ReLU activation function is used in this layer. Eighth, the feature array is subjected to a dropout process that is executed through setting the dropout rate to 0.25. This array is then transferred to a fully connected layer containing m neurons, with m denoting a class’s total sample number. A sigmoid activation function (hyperbolic function) is employed in this layer.
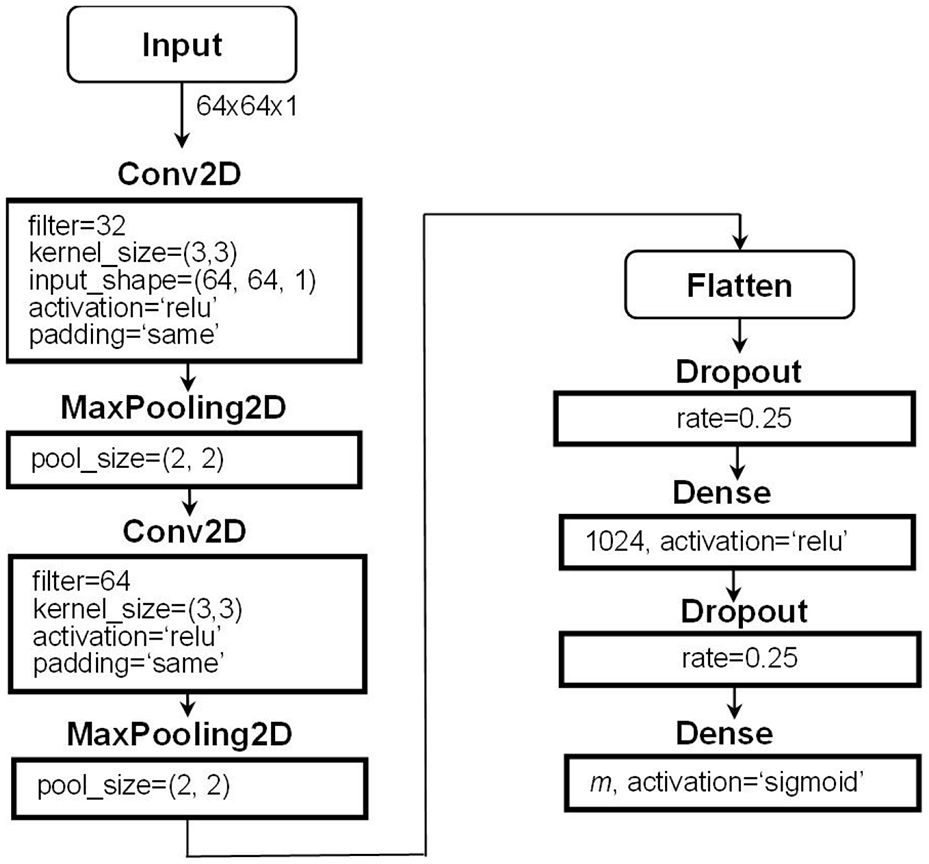
Architecture of the CNN employed in the proposed algorithm.
Dynamic CNN-based PCA algorithm
Figure 3 displays a flowchart of the proposed CNN-based PCA algorithm. This algorithm conducts image preprocessing, ARG segmentation, CNN-based processing, and PCA/WST to dynamically select appropriate data detection schemes. A PCA/WST-based SVM scheme is used to select features to increase the interpretability of input data when insufficient image signals are detected.
Flowchart of the proposed CNN-based PCA algorithm.
The proposed algorithmic framework contains a CNN and a PCA/WST-based SVM classifier. This SVM classifier uses the hold-out procedure to select the values of C and γ. In this study, C and γ were set as 29 and 2−3, respectively, to achieve high testing accuracy.
We herein detail a system based on the proposed algorithm for detecting manufacturing data (Figure 4).
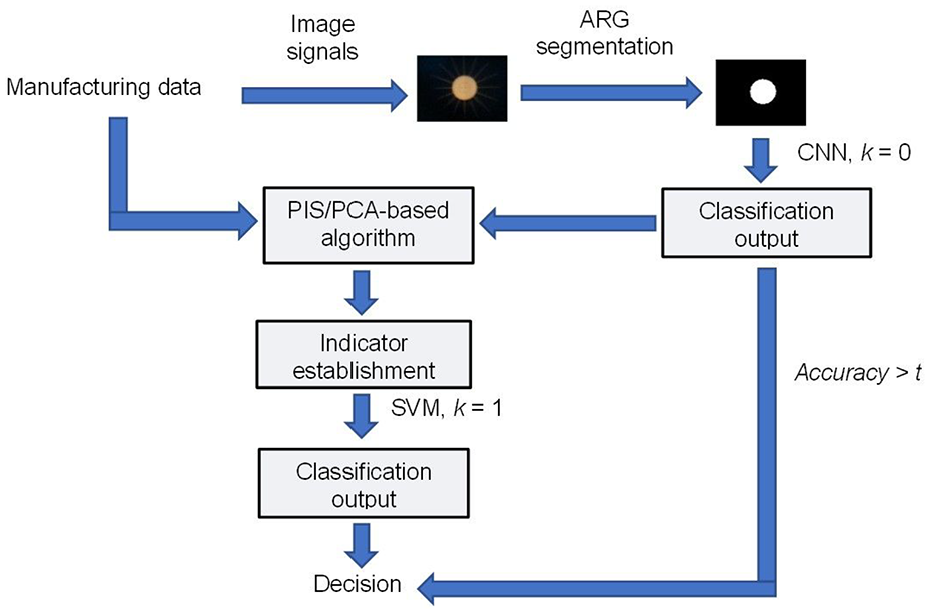
Schematic of a system based on the proposed algorithm for detecting manufacturing data.
The steps of the proposed algorithm are outlined subsequently:
Step 1: Input manufacturing data.
Step 2: If the input data contain image signals, convert these signals into an image that has a size of 1024 × 768 pixels and has a grayscale depth of 8 bits.
Step 3: Conduct ARG segmentation.
Step 4: Input 64 × 64-pixel segmented images into the CNN, and classify these images by using the CNN.
Step 5: Determine the classification accuracy.
If the accuracy is higher than t (14), terminate the process; otherwise, code the image pixels (PIS), and execute Step 6.

where the threshold values Ti in (14) are set sequentially as follows; {Ti} = {0.84, 0.81, 0.82, …, 0.99}, with i = 0, 1, 2, …, 15.
Step 6: Conduct PCA-based feature extraction and implement the WST scheme if insufficient image signals are detected.
Step 7: Establish indicators in accordance with the residual subspace of the PCA features.
Step 8: Classify the indicators by using the SVM classifier, and execute Step 5. Proceed to Step 6 for WST implementation if the determined accuracy is not greater than t.
Experimental results and discussion
To assess the proposed algorithm’s performance, experiments were conducted using visual inspection and measurement data. For visual inspection, 21 an eyeglass with unknown features was fixed to the support frame of a telescope. The eyeglass orientation was determined using a target panel; this panel was affixed to a platform. The light incident on the platform’s surface illuminated the target panel; in addition, a 10.67-m distance was maintained between the telescope and the target panel. The proposed algorithm was used to identify the eyeglass in telescope images captured by a digital camera. The sample classes employed in the process of visual inspection are presented in Table 1. The proposed algorithm was also applied to detect measurement data in supercapacitor manufacturing.
Sample classes in visual inspection.

A life test was conducted for the supercapacitor samples (Table 2) used in this study. For each supercapacitor, we measured the equivalent series resistance (ESR (mΩ)) and capacitance (Cap (F)) at room temperature. The supercapacitor was then charged to 2.7 V under a constant current. This voltage was maintained for 336 h at 65°C. Subsequently, the supercapacitor was allowed to discharge to 0.1 V at room temperature. Finally, the aforementioned steps were repeated.
Sample classes in supercapacitor manufacturing (ESR is the equivalent series resistance).

Execution of proposed algorithm for adaptive detection of manufacturing data
The proposed algorithm was used in a visual inspection task. The performance of the proposed model in detecting each sample class was tested using 512 images. Figure 5 displays a segmented image obtained through ARG segmentation that was used as input for the CNN. In addition, the classification results obtained for the visual data through the proposed algorithm are listed in Table 3. This algorithm achieved an accuracy of 95% for the classification of visual data.
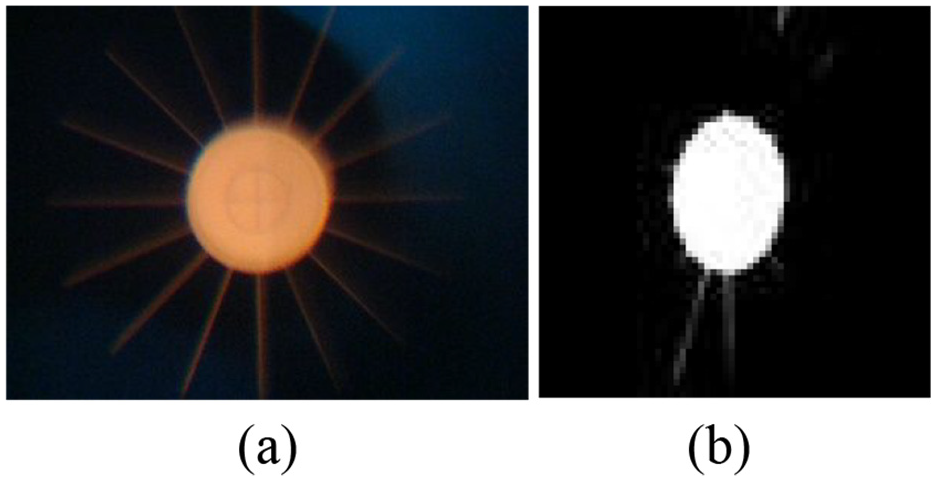
(a) Example of a class B eyeglass image and (b) the image corresponding to (a) that was input to the CNN.
Classification results obtained with the proposed algorithm in a visual inspection task (T (rows): true values, P (columns): predicted values).

The detection of measurement data in supercapacitor manufacturing was used in the proposed algorithm. Each class in the supercapacitor life tests comprised 256 samples, of which 128 randomly selected samples and the remaining samples were employed for training and testing, respectively. In Table 4, the classification results obtained with the proposed algorithm in the detection of measurement data are presented. This algorithm identified measurement data inputs and implemented the PCA/WST-based SVM scheme. It achieved a classification accuracy of 95% for detecting class {E, F, G}, and the equivalent indicators were {1.7805, 1.9301, 1.9356} (eigenvalues >1). Furthermore, the proposed detection system was applied to the identification in industry. The detection system applies image preprocessing, ARG segmentation, and CNN for image identification (CNN-based scheme), and employs the PCA/WST-based SVM scheme to increase the interpretability of the input data while identifying insufficient image signals (Figure 3). Table 5 lists the classes of test samples used in the application. The performance of the detection system in identifying each sample class was tested using 128 wrench images for visual inspection and 128 supercapacitor samples for data detection. The detection system exhibited an accuracy rate of about 95% in the application (Table 6).
Classification results obtained with the proposed algorithm in the detection of measurement data related to supercapacitor manufacturing (T (rows): true values, P (columns): predicted values).

Classes of visual inspection and measurement data used in the identification.

Accuracy rates (%) obtained using the schemes for the identification.

Developed system for the detection of manufacturing data
Figure 6 illustrates the segmentation result obtained for a blurred image through ARG segmentation and the corresponding segmented image input to the CNN. When the accuracy was less than or equal to t (t = 0.9), the pixels (PIS) of the blurred segmented image were coded, and PCA/WST-based feature extraction was conducted to establish indicators, which were then classified by the SVM algorithm (Figure 3). The proposed algorithm’s classification performance was compared with a CNN-based algorithm’s performance. The proposed algorithm’s classification results derived for the blurred images of class {A, B, C} are presented in Table 7. For these images, the proposed algorithm and CNN-based algorithm exhibited accuracy values of 93% and 89%, respectively. Thus, the proposed algorithm outperformed the CNN-based algorithm for blurred images of class {A, B, C}, with the corresponding indicators obtained with the proposed algorithm being {1.5393, 1.4028, 1.4798} (eigenvalues >1). The proposed algorithm exhibited high classification performance because it can adaptively implement the PCA/WST-based SVM method if the accuracy rate is less than or equal to t. In addition to the classification of manufacturing samples (eyeglass images), the proposed algorithm was tested in a general classification. Table 8 presents the general samples used in the classification. The existing feature-based methods (discrete wavelet transform (DWT-based) and moment invariants (INV-based) 23 ) combined with SVM classification were also tested in the classification. The classification accuracy rates of the DWT-based method, the INV-based method and the proposed algorithm were further compared, and Figure 7 depicts the comparison results. The proposed algorithm produced more precise outcomes compared to other algorithms in the classification. The performance of the algorithms was evaluated using a time cost function O(log n), which indicates an algorithm’s execution time required for binary search tree operations and bounds the logarithm time for all n-sized inputs in the big-O notation. The average O(log n) values (μs) for the three classes obtained using the DWT-based method, the INV-based method, and the proposed algorithm were 33, 39, and 32, respectively. The proposed algorithm demonstrated greater efficiency compared to other algorithms in the classification task.

(a) Example of a blurred class B eyeglass image and (b) the image corresponding to (a) that was input to the CNN.
Classification results obtained with the proposed algorithm for blurred images (T (rows): true values, P (columns): predicted values).

Classes of the general samples used in the classification.


Comparison of the classification accuracy rates (%) for the proposed algorithm, the DWT-based method, and the INV-based method.
The proposed algorithm was also used in hybrid distinct/blurred visual inspection. For this hybrid inspection task, each class comprised 512 samples, of which 256 random images and the rest of the 256 images were employed for training and testing, respectively. The classification performances of the proposed algorithm in the aforementioned task were compared with that of PCA- and CNN-based learning algorithms. The procedure for testing these three algorithms is summarized as follows: First, the 512 hybrid image samples for each class were input into the algorithm. Second, the samples were subjected to ARG segmentation, following which the segmented samples were processed. Finally, after the segmented images were processed, they were classified using the algorithm. The PCA-based algorithm performed pixel coding and executed the PCA/WST-based SVM method, the CNN-based algorithm used a CNN for learning, and the proposed algorithm used a CNN-based learning method with a PCA/WST-based SVM method. Figure 8 depicts the O(log n) values (μs) and classification accuracy rates (%) obtained using the aforementioned three algorithms. The classification accuracy rates achieved with the PCA-based algorithm, CNN-based algorithm, and proposed algorithm were 91%, 90%, and 94%, respectively. The O(log n) value of the proposed algorithm was between those of the CNN- and PCA-based algorithms because the proposed algorithm can adaptively employ a suitable classification scheme. Nevertheless, the O(log n) value of the proposed algorithm was <40 μs, which is acceptable; thus, this algorithm outperformed the CNN and PCA-based algorithms in the hybrid visual inspection task.

Values of O(log n) and classification accuracy for a PCA-based algorithm, a CNN-based algorithm, and the proposed algorithm in a hybrid visual inspection task.
Conclusions
An adaptive CNN-based PCA algorithm is proposed in this paper to detect manufacturing data. This adaptive algorithm can learn from insufficient image signals or features to increase the interpretability of data and the quantity of feature information for the detection of manufacturing data. It can identify image signals and measurement data inputs by using a CNN and PCA/WST-based SVM, respectively. The proposed algorithm achieved a classification accuracy of 95% in a visual inspection task. In hybrid distinct/blurred visual inspection, the proposed algorithm can adaptively employ a suitable classification scheme (a CNN-based scheme or PCA/WST-based SVM scheme) to achieve high classification accuracy. Thus, in a hybrid distinct/blurred visual inspection task conducted herein, the proposed algorithm outperformed a CNN-based algorithm and PCA-based algorithm. For practical application, the detection system can employ the CNN-based scheme and PCA/WST-based SVM scheme for identifying image signals and measurement data inputs, respectively.
Footnotes
Handling Editor: Sharmili Pandian
Declaration of conflicting interests
The author declared no potential conflicts of interest with respect to the research, authorship and/or publication of this article.
Funding
The author disclosed receipt of the following financial support for the research, authorship, and/or publication of this article: This work was supported in part from National Kaohsiung University of Science and Technology.