
Abstract
Composites consisting of two or more different macroscopic structures are becoming increasingly popular. This study investigates the long-term effects of single lap-joined GFRP and CFRP specimens on the material after exposure to seawater. Seven-ply GFRP and eight-ply CFRP composite materials were used under dry (without immersion in sea water) conditions and by hand lay-up method. Both GFRP and CFRP samples were 0/90 oriented twill braided. In September, sea water at 23.5°C temperature in Izmir province (Selçuk/Pamucak) region was kept in different containers for 1 month (30 days), 2 months (60 days), and 3 months (90 days) separately for GFRP and CFRP composites. They were cut for single lap joints according to ASTM D5868-01. Axial impact tests and moisture retention percentages were performed. Three-point bending tests were then performed in accordance with ASTM D790. Moisture retention rates (%), axial impact tests, and three point bending test specimens were kept in seawater with 3.3%–3.7% salinity for 1, 2, and 3 months. As a result of the three-point bending tests, it was observed that the Young modulus of the GFRP single lap joints decreased by 5.94%, 8.90%, and 12.98%, respectively, compared to the dry joints held for 1, 2, and 3 months. It was observed that the Young modulus of the CFRP single lap joints decreased by 1.28%, 3.39%, and 3.74%, respectively, compared to the dry joints held for 1, 2, and 3 months.
Keywords
Introduction
Composite materials consist of two or more components that do not dissolve in each other. These components are called the reinforcement phase and matrix. The most important reason why it is known in the maritime sector is that it can solve the corrosion problems that occur in steel, aluminium, and wood. In addition, composite materials with superior properties such as high tensile strength, low thermal expansion, and high strength-to-weight ratio have begun to replace traditional materials. The first commercial composite aircraft fuselage was built in 1946. Weight reduction is of great importance especially in large commercial ships. This situation led to the emergence of many new methods such as casting and compression moulding. In the early 1950s, production methods such as filament winding, extrusion drawing, and vacuum casting were developed. In the 1960s, the shipbuilding industry became the largest consumer of composite materials. In the maritime sector, components such as shafts, pipes, fenders, channels, flumes, and hulls are manufactured from composite materials. They are also used in propellers, bearings, hatch covers, exhaust pipes, superstructures, radar domes, sonar domes, and railings of all types of ships, valves, and other underwater structures. Composite materials are exposed to harsh environmental effects (moisture absorption, temperature changes, and UV radiation) in the marine environment and their properties change over time.1–3
The properties of composite materials depend on the fibres that are placed or pressed into the matrix during the production of the composite material. These provide both high strength and flexibility by improving the mechanical properties.4,5 Composite materials are used in various marine applications such as superstructures, recreational vehicles, and commercial ships. 6 In marine applications, the mechanical properties of composite materials are affected by seawater absorption, ambient temperature, pH factor, ultraviolet radiation and pressure. 7 In this case, the composite material is damaged both physically (deformation and swelling of the matrix) and chemically (hydrolysis of the matrix and fibre loss). The use of composite materials in marine applications significantly affects the durability and longevity of marine structures. Recently, glue bonding method has been widely used to reduce the weight and production time of ships. Composite structures can be joined with mechanically fixed joints or adhesives. Single-layer bonding has many advantages over other traditional bonding techniques, such as cost, high durability, and buffering capacity. Bonded joints are widely used due to their efficiency, production cost, testing, maintenance, and easier control of load-carrying capacity compared to other joints. 8 For marine applications, it is very important to know how the adhesive properties change with immersion time and how immersion in seawater affects the properties of the bonded composite assembly. 9 Researchers conducted a study to test the properties of bonded joints with single-ply adhesives. Song et al. studied the effects of various material and geometric properties on the strength of single-ply joints and found that the strength varies significantly depending on the thickness of the joint section and the type of bending. 10 They state that the thickness of the joint lines should be selected between 0.1 and 3 mm. 11 Wu et al. numerically investigated how the adhesive and interface properties affect the static behaviour of simply bonded composite joints. The finite element model was developed using a bond zone model representing the composite-binder interface and a continuum damage model for the binder. The sensitivity of the model to the material parameters was also investigated using Taguchi analysis. They claim that this method can be used by engineers to determine the deterioration status of interconnecting joints. 12 Zou et al. investigated CFRP/Al single lap adhesive joints with varied CFRP orientations. They observed a significant reduction in bonded area strength, accompanied by crack formation within the adhesive layer. 13 Dehaghani et al. assessed the shear strength of single-lap adhesive joints composed of CFRP materials. Their findings revealed that samples treated with sandpaper exhibited the highest shear strength, whereas acetone-cleaned samples demonstrated the lowest.14,15 Kim et al. studied the impact of damage and strength on single lap bonded composite joints based on different bonding techniques. Their results highlighted that the fracture process and strength of the samples were influenced by the bonding method utilized. 16 Key factors contributing to the degradation of adhesives and joints include moisture, solutions, and temperature. Diffusion into adhesives can alter their thermophysical, mechanical, and chemical properties. 17 Nevertheless, there is limited comparative data on the seawater resistance of GFRP and CFRP composites assembled using single lap joints.
Materials and methods
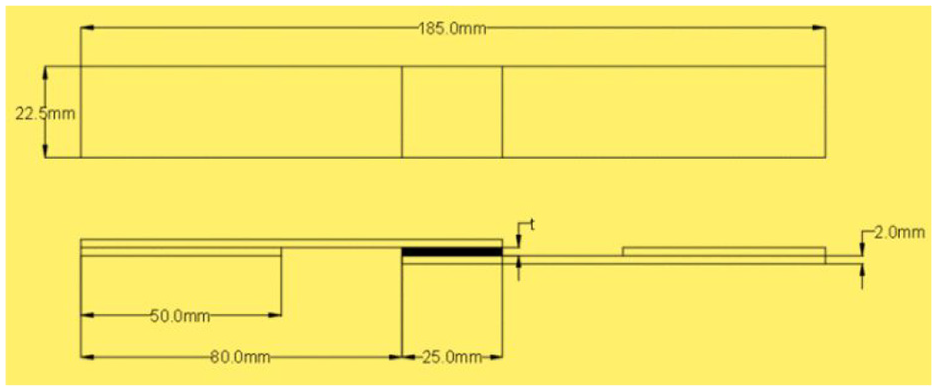
For the formation of a laminate layer of 2 mm, taking into account the volume and density ratio in GFRP and CFRP composite materials seven-layer 0/90 orientation, 390 g/m2 density twill GFRP and eight-layer 0/90 orientation, 245 g/m2 density twill CFRP composite plates were manufactured Fibermak Engineering by the company. F-RES 21 epoxy and F-Hard 22 hardener were used as resin materials. Drump type prepreg production machine was used for prepregs. Fibre type carbon fibre 3k weft fibre and fibre type 390 gr glass fibre weft fibre were selected.
Then, the prepregs on which the resin system consisting of epoxy and hardener mixture was applied by hand lay-up method were kept for a day, and after the resin gelled, composite material was manufactured by hot press method. It was then cured at 120°C under 8–10 bar pressure for 1 h. The dimensions of both GFRP and CFRP composite plates after production are 500 mm × 500 mm and the measured thickness is 2 mm. Specimens were cut from 7-ply GFRP and 8-ply CFRP composite plates with orientations of 0/90 and twill weave using a CNC router as shown in Figure 1.
Formation of specimens from GFRP and CFRP.
Seven-layer woven 390 g/m2 twill GFRP, eight-layer 245 g/m2 twill CFRP composite plates in 0/90 orientation, and fibre reinforced polymer (FRP) were cut to the required dimensions according to the standard test method for single lap adhesive joints (ASTM D5868-01) as shown in Figure 1.
Before bonding the GFRP and CFRP specimens, the end of the part for each bond was marked to 25 mm with a caliper as shown in Figure 1. Samples were prepared by joining with adhesively bonding technique. The adherend surfaces were solvent cleaned.
Loctite Hysol-9466, a two-component epoxy adhesive curing at room temperature, was used for the bonding process. The resin and hardener are present in a 2:1 mixing ratio in the application gun used.
Studies in the literature have found that a thickness range of 0.1–0.3 mm is sufficient to achieve better bond strength of the adhesive, while thicker adhesive above 0.6 mm will reduce the bond strength. This is because a thinner adhesive layer can fully utilize the adhesive resistance. 18
Loctite Hysol-9466 adhesive was applied to the upper region of the first bonded specimen and the other specimen was placed. Then, the overlapping areas of the specimens bonded with adhesive were pressed together.
The optimum thickness of the adhesive layer was chosen as 0.2 mm and a constant pressure of 0.1 MPa was applied to the specimens. All specimens were then individually measured with a digital caliper to check that the adhesive thickness was evenly distributed over the entire bonding area. Single lap bonded joint was obtained by using Loctite Hysol-9466 curing epoxy adhesive.
In order to obtain the full strength performance of the joints, the experiments were carried out after the adhesive was fully cured by leaving it for 7 days as specified in the data sheet.
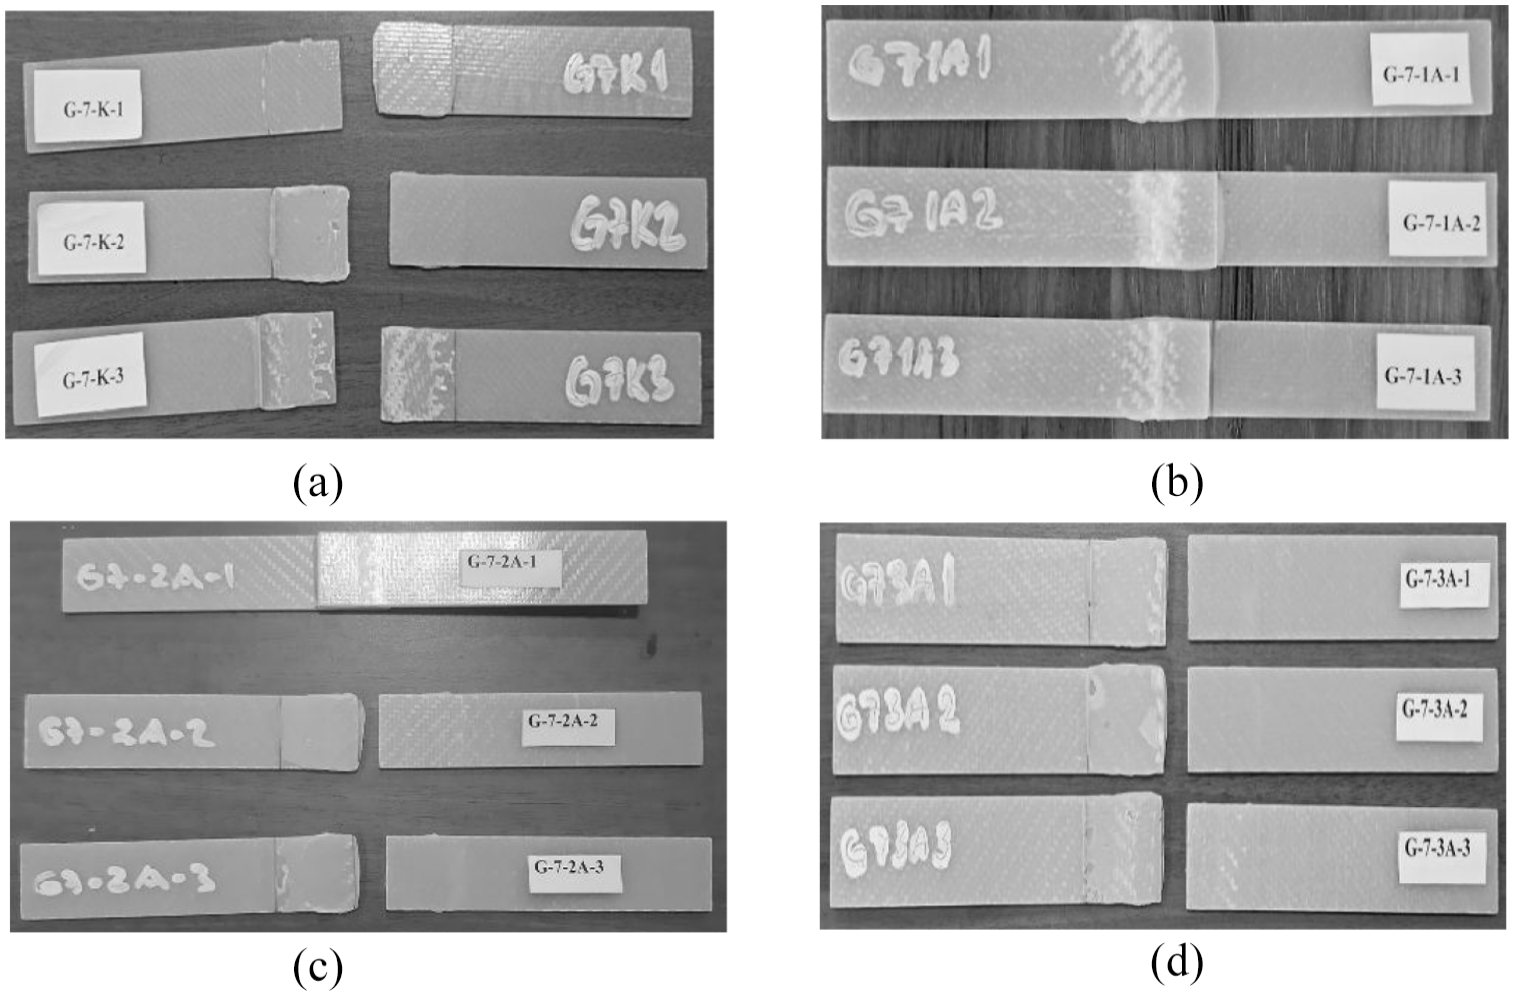
The specimens were coded as indicated in Table 1 to avoid confusion during preparation. G-7-K-1 coded specimen means G is a 7-ply specimen made of glass fibre reinforced polymer (GFRP) and K is the number 1 specimen tested in dry environment. Specimen coded C-8-K-1 stands for specimen number 1 made of C carbon fibre reinforced polymer (CFRP) with 8 plies and tested in K dry environment (a) shows coded samples of CFRP and (b) GFRP specimens (Figure 2).
Code generation for CFRP and GFRP samples.


CFRP (a) and GFRP (b) coded specimen samples.
Before the GFRP and CFRP specimens were placed in seawater, a single lap adhesive joint design was created and then the specimens were prepared for storage in a container. The prepared specimens were divided into four groups as dry, 1, 2, and 3 months in seawater.
The samples were first prepared for dry environment, then for 1 month seawater environment with a salinity (dezilation) percentage of 3.3%–3.7% and seawater temperature of 23.5°C, then for 2 months seawater environment and finally for 3 months seawater environment. The seawater used for each sample was kept at the same salinity and constant temperature and the experiments were carried out.
Measurement of seawater moisture retention rates of GFRP and CFRP composites
Three specimens from each group were used for GFRP and CFRP specimens formed with a single lap bonded connection. For moisture retention rate, the weight of each GFRP and CFRP sample group was measured at intervals of 1, 2, and 3 months after soaking in seawater, calculated by comparing with the initial weight and graphs were drawn according to the data obtained. Daihan Biomedical analytical balance with a precision of 0.1 mg was used for weight measurement.
Tensile axial impacts (Charpy-Izod) tests
The impact response of composite materials is important for understanding impact formation and the influence of material properties on impact response. With the tensile axial impact test device, the amount of energy absorbed in the fracture of the test piece at high speeds is measured. 19
In Figure 3(a), the sample is placed in the setup. The hammer is then raised to a certain height (a), that is, potential energy is imparted. The hammer is then released from its current position. Part of the total energy of the hammer is absorbed by the sample, while the rest is converted into potential energy, provided that it is raised again by a certain amount (b).

Axial ımpacts: (a) schematic view, (b) impact test device with the specimen installed, and (c) specimen subjected to impact.
The difference between the potential energy of the hammer at the initial position and the potential energy at the final position will give the fracture energy of the specimen. This amount of energy refers to the fracture resistance of the material and is usually expressed in Joules (J). 20
fracture energy;

α: hammer release angle (°)
β: angle of rise after impact (°)
R: pendulum arm (m)
m: mass of the hammer (kg)
g: gravitational acceleration (m/s2)
Wa: potential energy of the hammer before release (m)
Wb: after the sample is broken the potential energy of the hammer rising to a height (m).
Tensile axial impact (Charpy-Izod) experiments (ASTM D256) were performed by releasing a pendulum length 48 cm long and hammer release angle 45° angled pendulum rod from a predetermined starting position and applying impact at 30 J energy level.
This refractive energy value calculated from the difference can be read from the scale at the top of Figure 3(b).
A total of 24 specimens were prepared, 12 for both GFRP and CFRP with single lap bonded joints. Firstly, three specimens for each GFRP and CFRP were left in dry environment. Then, three specimens of each material were kept in seawater for 1 month, the other three specimens for 2 months, and the last three specimens for 3 months.
Three point bending test
Based on the results obtained by three-point bending test, it is aimed to evaluate the effects of adhesive, connection type, and different composite materials used. The aim is to know the damage that will start at the joint and adhesive interface and to better understand at which stage the changes in the mechanical properties of the composite material will occur due to the effect of sea water.
The three-point bending test was carried out in Shimadzu AG-100 with a loading capacity of 100 kN by selecting a load of 5 kN and a speed of 1 mm/min by attaching the appropriate bending tip apparatus to the tensile tester. Before starting the test, load, test speed, and specimen size data were entered into the programme and calculations were made automatical. All specimens were tested separately for both seawater and dry conditions and the force-displacement (deflection) graphs were plotted using the computer programme. Three-point bending test According to ASTM D790, a force is applied to the centre of a flat test piece, usually of circular or rectangular cross-section, freely resting on two supports, without changing direction.
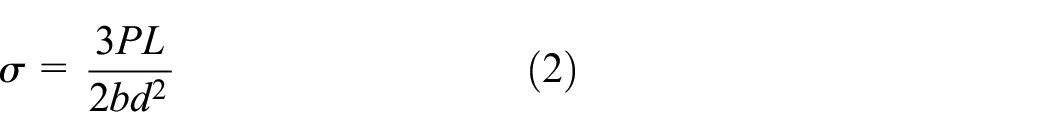
The calculation of the maximum bending stress for each load value is as follows is made with the formula.
Where;
σ: Stress at the beam surface at centre point (N/mm2)
P: Force at any point of the load-deflection curve (N)
L: Distance between two supports (mm)
b: Width of the beam (mm)
d: Height of the beam (mm)
It was made by applying the following formula, which is used for the determination of flexural strength in a bonded joint. However, to measure the flexural strength of the bonded joint, the following formula can be used for an unbonded specimen:

Where σE (MPa) is the flexural strength, P (N) is the maximum applied load, s (mm) is the distance between the supports, t (mm) is the thickness of the specimen, and w (mm) is the width of the specimen.
Accordingly, the three-point bending test was carried out on a Shimadzu AG-100 with a loading capacity of 100 kN by attaching the appropriate bending tip apparatus to the tensile testing machine and selecting a load of 5 kN and a speed of 1 mm/min. Here, smooth GFRP and CFRP single lap bonded joints with a bond thickness of 0.2 mm were subjected to flexural tests according to ASTM D790. This test produces tensile stress on the convex side and compressive stress on the concave side. This creates a shear stress zone along the centre boundary. To minimize this for single lap bonded joints and to ensure that the left and right sides of the specimen sit at the same level on the test apparatus, the specimens were centred by adjusting the spacing between the bearings (Figure 4).
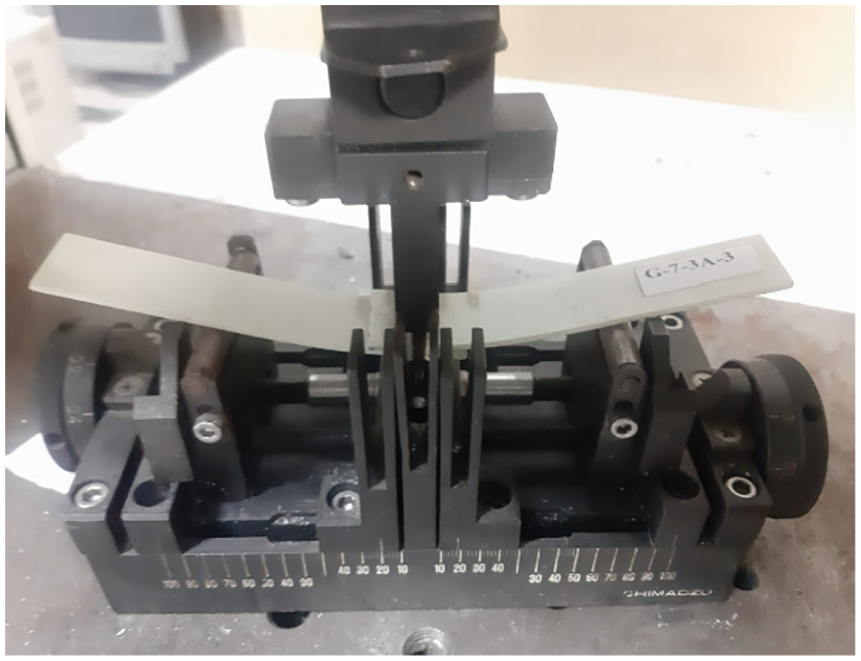
Positioning of the sample in the three-point bending testing machine.
The experiment was carried out with a total of 24 samples, 12 of which were GFRP samples and 12 of which were CFRP samples.
Results
The surfaces of the CFRP and GFRP specimens were wiped with moisture absorbent paper before weight measurement and the weight measurement process did not exceed 20 min to avoid the influence of the external environment on the experimental results. Moisture retention rates were calculated using the following equation (Tables 2 and 3).

Here; mk: weight in dry state (g), my: weight in wet state (g); M: moisture retention in percent.
Moisture retention rate (%) of GFRP samples stored in dry environment and seawater for 1, 2, and 3 months.

Moisture retention rate (%) of CFRP samples stored in dry environment and seawater for 1, 2, and 3 months.

The results of seawater absorption measurements by comparing the moisture retention rates (%) of GFRP specimens kept in seawater for 1, 2, and 3 months with the samples left in dry environment are given in Table 2. All GFRP specimens soaked in seawater for 1, 2, and 3 months at a seawater temperature of 23.5°C were compared with the specimens left in dry environment (G-K-1, G-K-2, and G-K-3). The average moisture retention rate (%) of the samples kept in seawater for 1 month (G-7-1A-1, G-7-1A-2, and G-7-1A-3) was 0.66. The specimens (G-7-2A-1, G-7-2A-2, and G-7-2A-3) that were preserved in seawater for 2 months had an average moisture retention rate (%) of 3.43. Ultimately, 4.16 was determined to be the average moisture retention rate (%) of the samples (G-7-3A-1, G-7-3A-2, and G-7-3A-3) that were held in seawater for 3 months. Figure 5(a) shows the moisture retention rate graph of the GFRP samples.

Dry environment, first-second-third. Moisture retention rate of months GFRP (a), CFRP (b).
Table 3 presents the findings of measurements of seawater absorption by contrasting the moisture retention rates (%) of CFRP samples stored in seawater for 1, 2, and 3 months with those of samples preserved in a dry environment. The CFRP samples C-8-K-1, C-8-K-2, and C-8-K-3 were compared to the samples left in a dry environment after being stored in seawater for 1, 2, and 3 months at a temperature of 23.5°C. The samples (C-8-1A-1, C-8-1A-2, and C-8-1A-3) that were stored in saltwater with an average temperature of 23.5°C for a month had moisture retention rates (%) of 0.57. The samples (C-8-2A-1, C-8-2A-2, and C-8-2A-3) that were preserved in seawater for 2 months had an average moisture retention rate (%) of 0.86. Finally, the average moisture retention rate (%) of the specimens kept in seawater for 3 months (C-8-3A-1, C-8-3A-2, C-8-3A-3) was calculated as 0.87 and the moisture retention rate graph of CFRP specimens is given in Figure 5(b).
When the graphs in Figure 5(a) and (b) of both samples are analysed, it is seen that there is an increase in the percentage of moisture retention as the seawater retention time increases. The most significant increase occurred in the second month and reached a certain saturation. From the third month onwards, the increase progressed more slowly.
As known in composite materials, this implies that seawater molecules are more soluble in GFRP than in CFRP, which means that the failure modes and ageing behaviour of the bonded composite joint depend on this. 21
If Fickian theory is used here, which provides a better understanding of the role of composite structures on the moisture diffusion mechanism.
Figure 5(b) shows the comparison of the time-dependent mass change in GFRP and CFRP composite samples. Here, the water absorption rate increased in GFRP specimens, while the water absorption rate decreased in CFRP specimens.
This can be attributed to the use of different composite materials. However, towards the end of the 3-month ageing period, the mass change started to increase in GFRP joints and decrease in CFRP joints.
In Fick’s first law, there is a change in the diffusion coefficient or concentration gradient in certain situations. In Fick’s second law, in cases where the diffusion coefficient changes over time or the medium is different, changes may be required. Fick’s second law of diffusion explains this phenomenon.
The assumed moisture uptake, D, for composite materials from Fick’s second diffusion law is shown in equation (5) and the theoretical mass change, M, due to immersion of composite materials in water is shown in equation (6). Where, M1 and M2 are the moisture contents of the composite material at times t1 and t2 respectively, h is the composite thickness, L is the composite length, w is the composite width, t is the time, and M∞ is the maximum change in mass. 22


In general, the graph predicts the mass increase with moisture uptake to maximum change (M∞) and after that the change in mass will occur.
In other words, this situation in sea water can be explained as follows. As various salt components accumulate on the surface of the composite material, moisture uptake slows down. This law states that the square root linearly increases the mass of moisture absorption over time and then gradually slows down until saturation is reached. 23
Both GFRP and CFRP have the same fibre content and the same thickness in the joints. The moisture content curves for both composites increased rapidly after 1 month (30 days) of immersion in seawater. However, the mass change curves for the GFRP and CFRP connection specimens show the same increase profile at 2 months (60 days), while the mass gain is higher for the GFRP single lap connection specimens. At the end of 3 months (90 days), the GFRP single lap joint specimens continued to show an increasing trend over time, while the CFRP single lap joint specimens showed a downward decreasing behaviour. While GFRP composites react chemically with water, CFRP composites are known to have less moisture absorption and are more resistant to the corrosive effects of water. 24 Another reason for this can be considered as a result of the GFRP interphase absorbing more moisture than the CFRP interphase.
When both GFRP and CFRP single lap joint specimens were analysed here, the moisture absorption in the time-dependent mass change curve in Figure 5(b) showed Fickian behaviour only in the initial stages of diffusion. Before reaching the saturation level, the mass increase due to moisture absorption increased proportionally.
None of the specimens bonded with both GFRP and CFRP single lap joint reached a constant saturation level even after 3 months (90 days). Both of these different joints were found to show a non-Fickian graph of moisture uptake. However, the mass increase in the GFRP connection compared to the CFRP connection continued. Swelling and plasticization of the matrix increased by allowing more moisture diffusion.
However, since the immersion temperature here is only room temperature, the diffusion coefficient (D) cannot be calculated. As a result, the diffusion coefficient at room temperature can also be used as the permeability index. 10
Tensile axial impacts (Charpy-Izod) tests
GFRP specimens subjected to tensile axial impact (Charpy-Izod) test
GFRP subjected to tensile axial impact (Charpy-Izod) test is shown in Figure 6 in dry environment (not exposed to seawater) (a), then exposed to seawater for 1 month (b), 2 months (c), and 3 months (d).
GFRP dry environment (a), first month (b), second month (c), and third month (d) specimens (tensile axial impact (Charpy-Izod)).
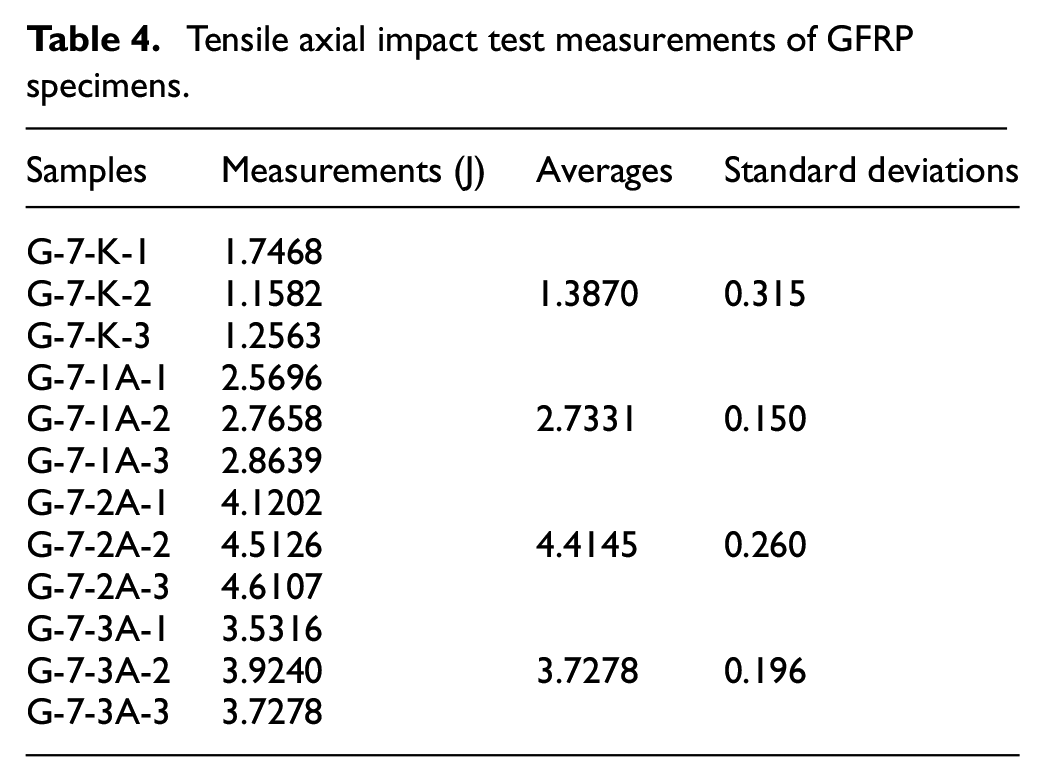
Table 4 shows the absorbed energy measurements of GFRP specimens from the data obtained with 30 J impact effect. The average of GFRP dry environment specimens (G-7-K-1, G-7-K-2, and G-7-K-3) subjected to tensile axial impact test is 1.39 J. The average of the specimens kept in seawater for 1 month (G-7-1A-1, G-7-1A-2, and G-7-1A-3) is 2.73 J. The average of the samples kept in seawater for 2 months (G-7-2A-1, G-7-2A-2, and G-7-2A-3) is 4.42 J. The average of the samples kept in seawater for 3 months (G-7-3A-1, G-7-3A-2, and G-7-3A-3) was calculated as 3.73 J and the graph of the absorbed energy measurements is given in Figure 7. In GFRP composite specimens formed with single lap bonded connection, the amount of absorbed energy increased as the seawater soaking time increased and the highest increase was detected at the second month. Fracture toughness, a measure of the energy required for crack growth and fracture, is an indicator of energy absorption. 25
Tensile axial impact test measurements of GFRP specimens.

Absorbed energy amount graph of GFRP samples stored in dry and seawater for 1, 2, and 3 months.
GFRP composite joints fractured at the bond line in dry and seawater for 1, 2, and 3 months. However, the specimens at 2 months showed less impact resistance and fractured faster.
The tensile axial impact test was calculated by taking the average values of three specimens for GFRP dry and seawater conditions for 1, 2, and 3 months.
CFRP specimens subjected to tensile axial impact (Charpy-Izod) test
CFRP dry environment specimens subjected to tensile axial impact test are shown in Figure 8(a), specimens kept in seawater for 1 month are shown in (b), specimens kept in seawater for 2 months are shown in (c), and specimens kept in seawater for 3 months are shown in (d).

CFRP dry environment (a), first month (b), second month (c), and third month (d) specimens (tensile axial impact (Charpy-Izod)).
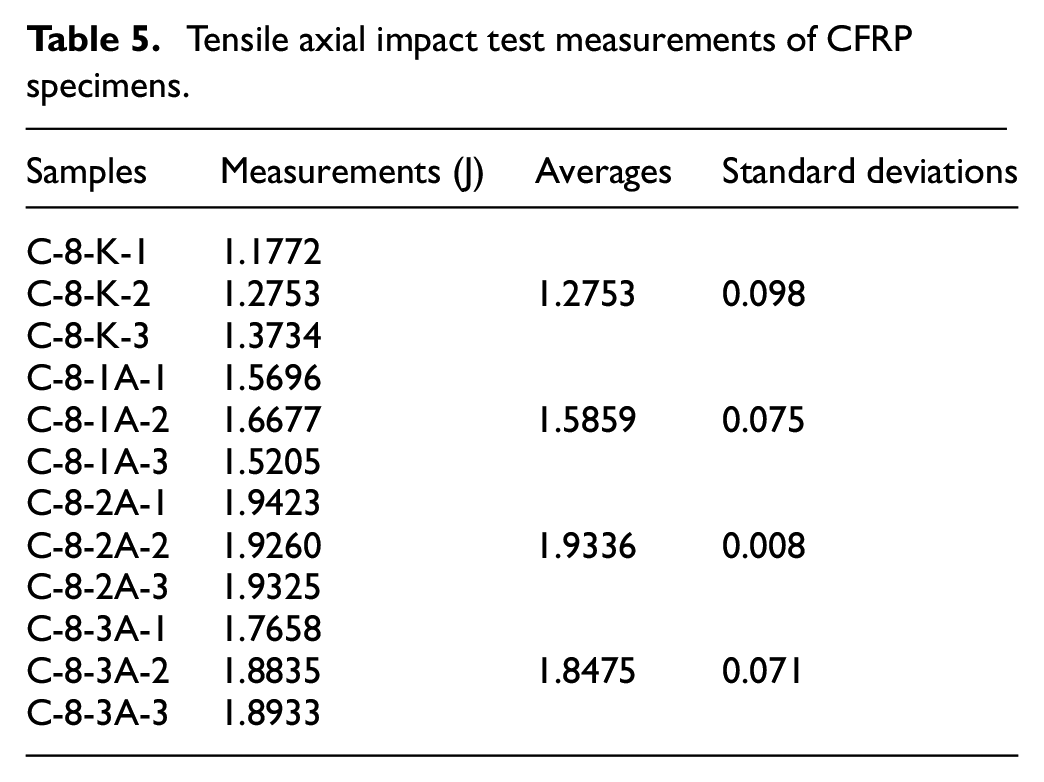
Table 5 shows the absorbed energy measurements of the CFRP specimens from the data obtained with 30 J impact effect. The average of GFRP dry environment specimens (C-7-K-1, C-7-K-2, and C-7-K-3) subjected to tensile axial impact test is 1.28 J. The average of the specimens kept in seawater for 1 month (C-7-1A-1, C-7-1A-2, and C-7-1A-3) is 1.59 J. The average of the samples kept in seawater for 2 months (C-7-2A-1, C-7-2A-2, and C-7-2A-3) is 1.93 J. The average of the samples kept in seawater for 3 months (C-7-3A-1, C-7-3A-2, and C-7-3A-3) was calculated as 1.85 J and the graph of the absorbed energy measurements is given in Figure 9(a). Three specimens for the CFRP dry environment and 1, 2, and 3 months in seawater were used to obtain the average values for the tensile axial impact test. Three specimens for the CFRP dry environment and 1, 2, and 3 months in seawater were used to obtain the average values for the tensile axial impact test.
Tensile axial impact test measurements of CFRP specimens.
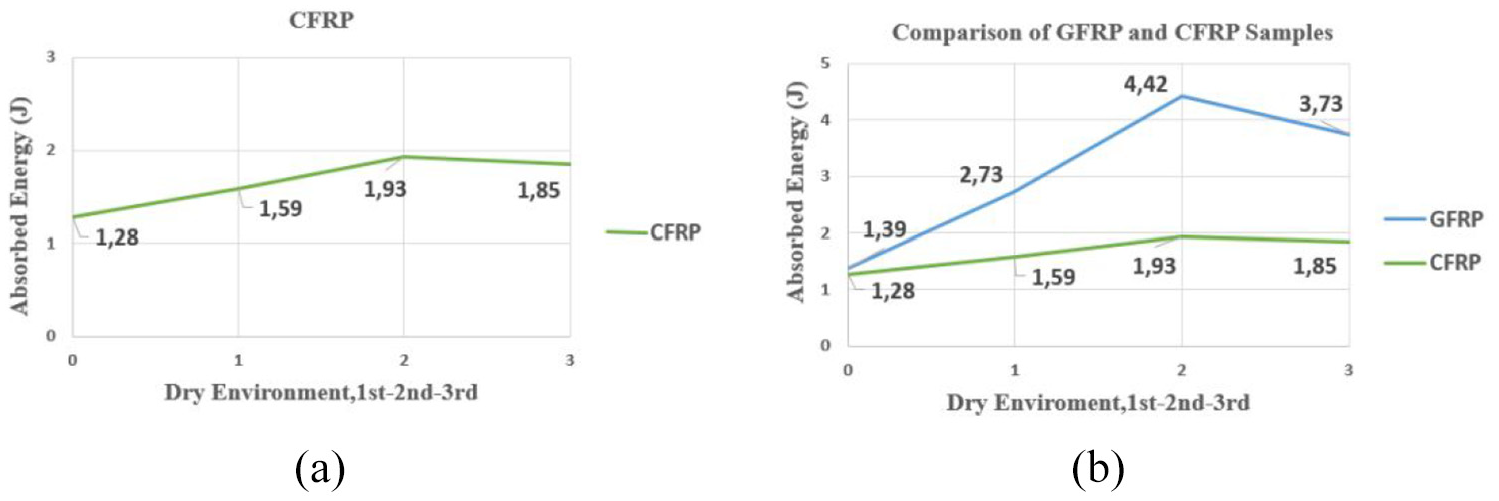
Absorbed energy amount graph of CFRP samples stored in dry and seawater for 1, 2, and 3 months (a). Comparing the absorbed energy of composite samples made of GFRP and CFRP (b).
As in the GFRP composite specimens formed with a single lap joint, the amount of energy absorbed increased as the seawater retention time increased in the CFRP composite specimens, and the highest increase was detected at the second month. However, the energy absorption is less here compared to GFRP specimens.
CFRP composite joints fractured at the bond line in dry and seawater for 1, 2, and 3 months. However, the specimens at 2 months showed less impact resistance and fractured faster.
Figure 9(b) then presents a comparison of the tensile axial impact test results for CFRP and GFRP composite specimens with a single lap bonded connection. The results showed that there was the highest increase in the amount of energy absorbed in the second month, while there was a decrease in the amount of energy absorbed in the third month, as seen in GFRP Figure 7 and CFRP Figure 9(a).
GFRP specimens have damage where the adhesive layer remains on both surfaces of the adherends and the interface bond between the adhesive layer and the substrate surfaces comes together, as shown in Figure 6.
CFRP specimens, on the other hand, have damage where the adhesive layer remains on both surfaces of the adherends as shown in Figure 8.
For all GFRP and CFRP specimens under 30 J impact energy level, some of the bonding joints were instantaneously separated by the impact, while other bonding joints were not separated. From the data obtained here, the amount of energy absorbed was measured. The energy absorbed during the impact test can be used as a measure of the impact resistance (strength) and toughness of the material. 26
SEM analyses of GFRP and CFRP specimens after tensile axial impact (Charpy-Izod) test
SEM images of CFRP and GFRP composite specimens were compared in terms of the amount of absorbed energy (Figure 10).
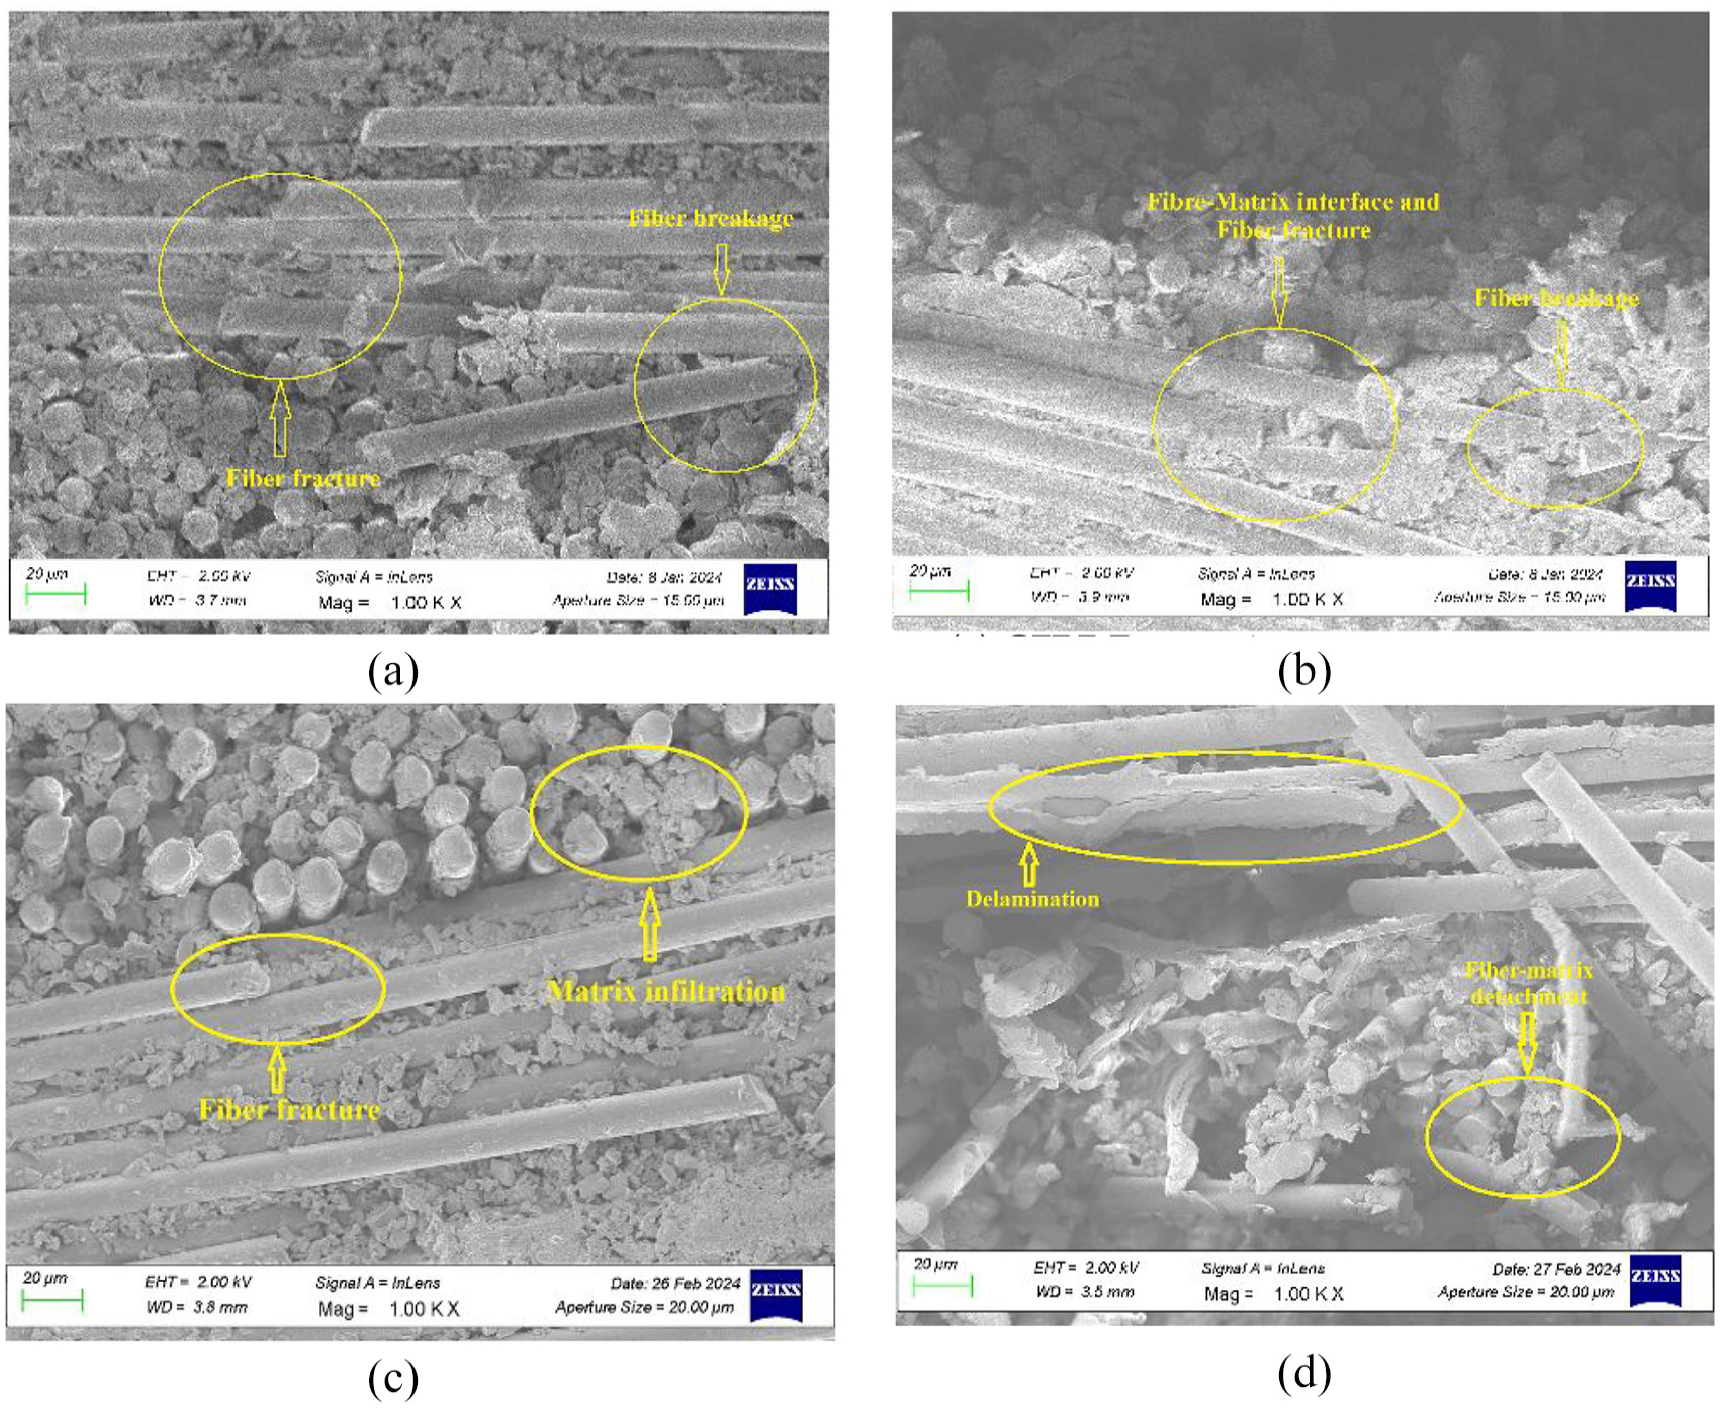
SEM image of GFRP composite material after impact test (Charpy-Izod): (a) GFRP dry environment, (b) GFRP first month, (c) GFRP second month, and (d) GFRP third month.
In SEM images, fibre fractures and fibre breakage were observed in Figure 10(a). Also, fibre breaks were observed the most. It was observed that the voids in the fibre-matrix interfacial bond were more in GFRP specimens kept in seawater for the first month than in CFRP specimens.
This is the situation, for GFRP samples stored in a dry environment and for 1 month in seawater, this condition happened between 1.39 and 2.73 J, however for CFRP samples, it happened between 1.28 and 1.59 J.
In GFRP specimens kept in seawater for 2 months, fibre breakage, matrix leakage, and the gap between the fibre-matrix interface bond increased further at 4.42 J. In CFRP specimens, it was observed that at 1.93 J, fibre breakage continued to some extent and the fibre-matrix interfacial bond was not much different from the situation at 1.28–1.59 J.
In GFRP specimens soaked in seawater for 3 months, delamination occurred at 3.73 J, which caused the matrix to start cracking. In addition, the gaps between the fibre-matrix increased, fibre breakage continued and matrix leakage was concentrated around the fibres in the transverse and vertical directions. In CFRP samples kept in seawater for 3 months, fibre fractures were observed at 1.85 J and the increase in the gap between the fibre-matrix interfacial bond was not different from 1.93 J.
Three point bending test results
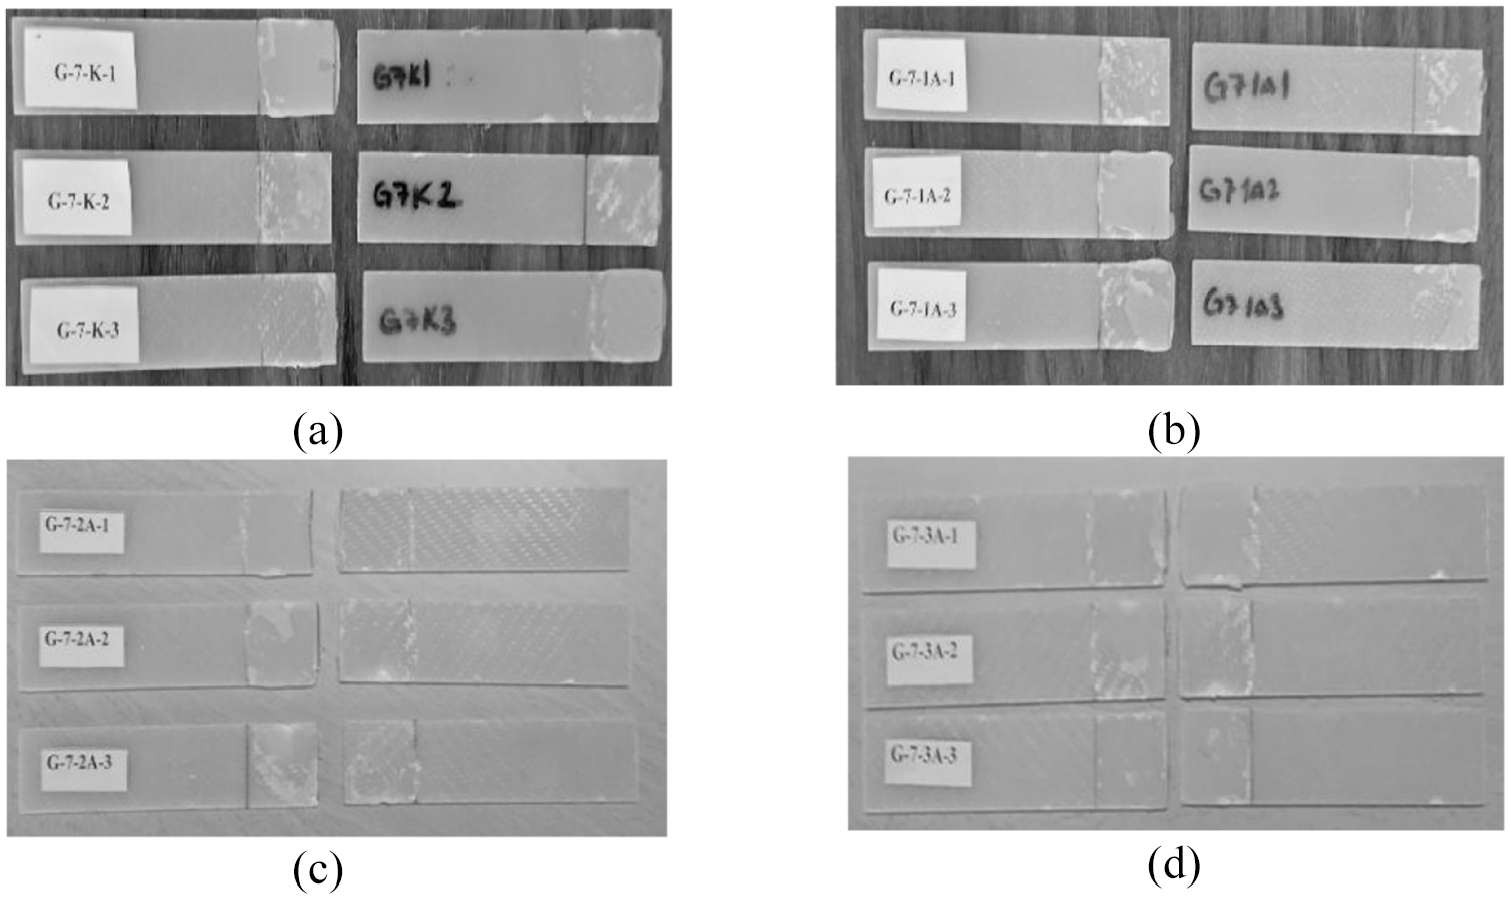
GFRP dry environment specimens subjected to three-point bending test are shown in Figure 11(a), specimens exposed to seawater for 1 month are shown in (b), specimens exposed to seawater for 2 months are shown in (c), and specimens exposed to seawater for 3 months are shown in (d).
GFRP dry environment (a), first month (b), second month (c), and third month (d) specimens (three point bending test).
In GFRP dry environment specimens, the connection point seen in Figure 11(a) is in the form of rupture. The specimens were separated from each other starting from the adhesive bond line. In Figure 11(b), the specimens kept in seawater for 1 month did not show any rupture starting from the adhesive bond line. In the specimens kept in seawater for 2 months in Figure 11(c) and 3 months in Figure 11(d), rupture damage occurred at the bond line with the remaining adhesive on both adhesive surfaces.
The results of the force-displacement values obtained after the flexural tests performed after the GFRP composite specimens were kept in dry environment, seawater for 1, 2, and 3 months are given in Figure 12.

Bending force-displacement graph of GFRP specimens soaked in seawater for 1, 2, and 3 months.
In Figure 12, the GFRP dry environment specimens have 247.0313 N and the displacement is 13.649 mm, where sudden rupture did not occur, but occurred after some increase. This can be attributed to the anisotropic nature of the GFRP connection material. In the first month kept in seawater, the highest load decreased by 207.0313 N with seawater absorption, but the displacement was 14.908 mm. In the first month ambient samples, the displacements increased and decreased with the load. This showed that the ductility of the GFRP bonding joint started to increase. In the GFRP specimens, the highest load was 173.4375 N and the displacement was 6.836 mm in the second month when the seawater molecules started to spread to the interface and matrix of the adhesive and GFRP material. The load carried by the connection decreased with seawater absorption. Moisture absorption further increased the ductility of the connection and the increases and decreases continued.
At month 3, the highest load was 167.5 N and the displacement was 7.475 mm. Here, seawater reduced the epoxy resin content between the fibres. However, in the GFRP connections, the load decreased after reaching the maximum damage load that the connection could withstand in the dry, first, second, and third months and the connection rupture occurred. This is in accordance with the general behaviour of single lap bonded joints.
CFRP specimens subjected to three-point bending test
The results of the force-displacement values obtained after the three-point bending tests performed after the CFRP composite specimens were kept in dry environment, seawater for 1, 2, and 3 months are given in Figure 13.
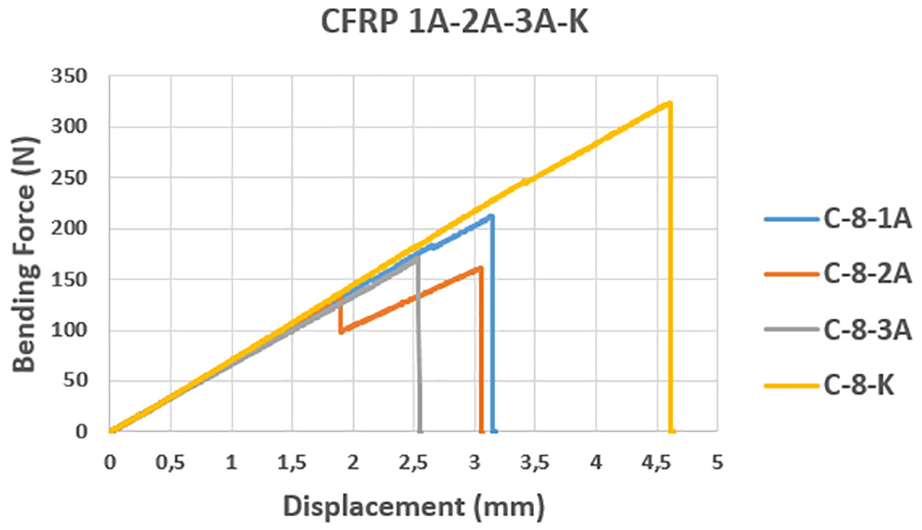
Bending force-displacement graph of CFRP specimens soaked in seawater for 1, 2, and 3 months.
When the bending test results are analysed, the first and highest bending force for C-8-K is 342.9688 N and the displacement is 4.346 mm. The C-8-K bonded joint fibre fractures and fibre debonding were observed here.
The bending force for C-8-1A is 182.6563 N and the displacement value is 2.647 mm. Then, the highest bending force is 212.3438 N and the displacement value is 3.142 mm. While the applied load increased proportionally with the displacement, a very small decrease was observed. The connection continued to resist the load. As the load continued to increase, a sudden drop was observed and the connection broke. There were no obvious fibre fractures in the connection. The initial bending force for C-8-2A was 134.2188 N and the displacement was 2.556 mm. Then the lowest bending force is 94.3437 N and the displacement is 1.903 mm. Finally, the highest bending force is 161.0938 N and the displacement is 3.047 mm. At first, the load increased proportionally to the displacement. However, as the applied load continued to increase, the matrix started to deform, the load-displacement graph could not continue proportionally and the connection was broken when it reached a blurred load value.
The first and highest bending force for C-8-3A is 169.8438 N and the displacement is 2.541 mm. Here, the load increased proportionally with the displacement graph and when the maximum damage load was reached, it suddenly fell and the connection was broken. The connection resulted in fibre fractures and fibre breaks.
In Figure 13, as in GFRP specimens, the elongation values of CFRP specimens initially increased linearly with load in all specimens.
The highest load in CFRP dry environment specimens was 342.9688 N and the displacement was 4.346 mm. As can be seen, it is higher than the other seawater soaking months 1, 2, and 3. In the first month, with the absorption of seawater, the highest load decreased by 212.3438 N and the displacement decreased by 3.142 mm in direct proportion. The dry specimens and the first month showed ruptures without increase or decrease. This showed that CFRP is more brittle. At month 1, the reason for the different displacement from the dry specimen is that the seawater molecules start to diffuse into the interface and matrix of the adhesive and CFRP material. The effect of this situation started to increase gradually in the second and third month. When the CFRP specimens reached the highest humidity in the second month, the highest load was 161.0938 N and the displacement was 3.047 mm. In addition, an increase-decrease in displacements was observed with the load. This is the ductilization of the connection as it reaches moisture saturation.
In the third month, the highest load is 169.8438 N and the displacement is 2.541 mm. Here, compared to the dry specimens, seawater absorption reduces the epoxy resin content between the fibres. However, this reduction was not as much as in GFRP connections due to the stiffness of the CFRP material. In addition, the loads on the CFRP connection are higher and the displacements are less than GFRP. In dry, 1, 2, and 3 months, the load decreased after a while after reaching the maximum damage load that the connection could withstand and the connection rupture occurred. This is in accordance with the general behaviour of single lap bonded joints.
Discussion and conclusions
Research on bonded joints in composite materials has typically focused on single composite materials and single joint configurations. The long-term effects of different composite materials and environmental factors on single lap bonded joints remain uncertain, posing significant challenges for practical applications. Most previous studies on single lap joints have not linked the bending stresses induced by various composite materials and seawater exposure, often relating to the flexural strength of materials bonded in composite joints. Tensile axial impact (Charpy-Izod) tests and three-point bending tests were conducted by measuring the moisture retention percentages of GFRP and CFRP composites formed by single lap adhesive bonding in dry conditions, seawater for 1 month (30 days), 2 months (60 days), and 3 months (90 days). Based on the findings, these conclusions are drawn: Moisture retention rates (%) for GFRP single lap bonded joints kept in dry conditions for 1, 2, and 3 months were 0.66%, 3.43%, and 4.16%, respectively. For CFRP single lap bonded joints, the rates were 0.57%, 0.86%, and 0.87%, respectively. Seawater exposure resulted in higher water absorption in GFRP single lap bonded specimens compared to CFRP specimens due to the greater solubility of seawater molecules in GFRP and their penetration into the fibre-matrix interface. Tensile axial (Charpy-Izod) impact tests revealed that the fracture toughness of GFRP single lap bonded joints at 30 J impact energy level in dry and seawater conditions for 1, 2, and 3 months was 4.6%, 9.1%, 14.7%, and 11.23%, respectively. The fracture toughness of CFRP single lap bonded joints kept in dry and seawater conditions at 30 J impact energy level for 1, 2, and 3 months was 4.2%, 5.3%, 6.4%, and 6.1%, respectively. For GFRP and CFRP specimens, the maximum increase in energy absorption occurred at 2 months of seawater immersion, after which saturation led to a decrease in absorbed energy. The energy absorbed during impact testing indicated that GFRP specimens were more brittle. Three-point bending tests determined that GFRP single lap bonded joints exhibited 16%, 30%, and 36% flexural strength compared to dry joints after being immersed in seawater for 1, 2, and 3 months, respectively. CFRP single lap bonded joints exhibited 38%, 53%, and 50% flexural strength compared to dry joints after seawater immersion for 1, 2, and 3 months. The three-point flexure test results showed that the amount of displacement decreased with increasing seawater immersion time in CFRP joints, with the decrease being less pronounced than in GFRP joints. After tensile axial impact (Charpy-Izod) and three-point bending tests of single lap GFRP and CFRP composite bonded specimens, fractures, ruptures, and cracks in the internal structure were observed using SEM imaging. CFRP specimens demonstrated superior mechanical properties compared to GFRP in seawater conditions.