
Abstract
This study aimed to enhance the existing vehicle’s structural reaction to a frontal and side impact collision. Energy-absorbing parts, a sturdy frame design, and enhanced crash performance are used to produce improvements based on the outcomes of the current model. When conducting the analysis, 3D modeling is done using CATIA, and FEM analysis is done using LS-DYNA. After adjustment, the ability to stabilize the momentum, the impact force during a crash, and the relation between internal energy and deformation is discussed; in doing so, the impact force is reduced by 7.82% and a 3.52% increment of energy is absorbed during a frontal collision. The side structure of the modified model also provided additional 162 mm space protection for the occupant, a reduction of impact force by 14.4%, and absorbed additional 7.6% energy. The new model generates more moment force that stabilizes fast as compared to the current, and also the relationship between energy absorbed and deformation is seen that with less deformation, the new model absorbs more energy. In conclusion, it can be claimed that the updated model considerably improved the pickup vehicle’s safety and crashworthiness without affecting the vehicle’s weight or appearance.
Introduction
Vehicle accidents have been one of the key factors for growing mortality rates of individuals globally. Hence, severe rules on vehicle safety have been placed on car industry. In different instances, the accidents of the cars on the road, front and side collision have maximum contribution to death. In both incidents, the individuals inside the vehicle or close side of the car and the inhabitants on the opposite of the vehicle are at danger of harm.
An investigation into the characteristics of the existing status of road safety and the characteristics of the traffic accident data supplied by Ethiopian police for a period of 6 years (July 2005 to June 2011). Of the 14,542 deaths, there are an average of 1.2 traffic passenger deaths per accident.1,2 An occupant cell is referred to in a road safety report as a “survival box,” and it is suggested that this term refers to a basic requirement for the safety design of vehicles. Road accidents can also be caused by other reasons, such as poor design, poor communication, poor decision-making, taking risks, etc. 3
The pickups are generally characterized by Body on frame and have two wheels in front and two wheels in their rear in which the engine is found on the front and the driving axel is the rear. A frontal frame geometry consisting of a front bumper, grille, fenders, hood, windscreen, cabin, and so on. It has gross weight of 2.5 ton (2495 kg) with 1.2 ton/1.3 ton axel load distribution and a maximum velocity of 120 km/h, the driver is placed in the left front of the vehicle cabin and other three up to four passengers sit in the front right and rear part of the cabin. 4 Figure 1 shows the pickup vehicle which is assembled in Bishoftu, Ethiopia.

Bishoftu pickup vehicle structure. 4
Protecting occupants in vehicle crashes has been an important priority since car industry was founded. Over the past few years, due to awareness of passenger safety and the need for energysaving engineering, manufacturers have turned to ideal passenger design, using strong models to improve crashing without increasing size.5,6
Information about structural reactions to various transport hazards can be determined by many different systems. Advanced crash simulation techniques allow for improvements to vehicle structure (crashworthiness) to improve passenger safety, yet to reconstruct the capacity of road accidents.7,8 Optimization of the structure is very important in engineering design. It is an important tool for eliminating unnecessary features and improving the performance of a device or system. 9
This Research paper aimed to solve and improve the crashworthiness of the existing pickup vehicle which is assembled in bishoftu by re-modeling in such way that crash injuries are minimized. Therefore, the first task of this article is to model and analyze existing truck models. After that, the result will be interpreted and then depending on the results, the new model is created to avoid the shortcomings of the existing pickup vehicle. To do so, different software’s like that of CATIA, for 3D modeling and LS-DYNA, for FEM analysis are used.
Crashworthiness
In fact, a car accident is a special event in which a car collides with another car, similar or different, hard and large; otherwise it will collide with other stationary objects. Some of the pickup truck crashes are categorized and illustrated below.
A crash-test is a form of destructive testing usually performed in order to ensure safe design standards in crash-worthiness and crash compatibility for automobiles or related components. To test the safety performance of a vehicle under different conditions and in different types of accidents, automakers use different angles, different sides, and different objects, including other vehicles, to crash the car and Carry out the test. 10
Front crash: A front crash is one where the forward ends of two cars strike one other or a vehicle collide with a stationary object. This has a chance for the greatest crash energy. In the situation presented in Figure 2, the car is struck through its front wheel framework. 11

Frontal impact. 12
Side impact: Side influence mechanisms come into effect when the vehicle is engaged in a crossing accident or when the car goes off the road and strikes a sideways power pole, trees, or another impediment on the wayside. In a sides crash with a car, the hitting vehicle goes down owing to the reaction force created by several structural parts such as car doors, side contact beams, top bow, B-Pillar, etc. As these structural elements plastically distort and absorbs energy, the striking vehicle slows down. 13 Figure 3 shows side collision which hits the driver compartment.

Side impact. 14
Rear hit crashes: whenever a slower traveling or stopped vehicle is hit from behind by another car driving at a quicker rate of speed. In crash situations, seats should have higher back support and head restraints to help ensure proper alignment of the head, neck, and upper body in the event of a crash.
Rollover impact analysis: It refers to a sort of vehicle collision during which a car flips over onto its side or roof. Rollovers have higher fatality than other sorts of car incidents Vehicle rollovers are categorized into two categories: tripped and un-tripped. Tripped rollovers are triggered by forces by a foreign object, such as a curb or an impact with another car. Un-tripped collisions are the effects of directional input, velocity and resistance with the pavement. 15
Crash simulation is a real time test of a car crash test using computer simulation to assess the safety level of a car and its occupants. The data obtained from the crash test show the body’s ability to protect the occupants of the vehicle in the event of a collision. These simulation technologies have greatly increased the protection, reliability, and production capacity of modern cars. 10
Car cluster in the architecture
For financial reasons, the cars are intended to show as many places as possible. Vehicles are grouped if they are related to: Direct connection: When multiple vehicles share the same location, they are directly connected. Indirect connection: Indirect connection describes the situation where more than one vehicle is not connected to each other. 16 However, they share the same tool, as shown in Figure 4.

The coupling connection of a cluster of five cars. 16
When designing the car’s components, automotive design engineers must consider how they will absorb the most energy in the event of an accident. The structure should be designed to maximize the space in the bend when the car crashes, thus reducing injuries to passengers. Today, similar incidents occur every hour around the world, and most of them are quite serious. Head-on collisions are one of the most common types of crashes. Figure 5 shows a comparison of various relevant event scenarios. More importantly, foreshocks are larger than other shocks. 17
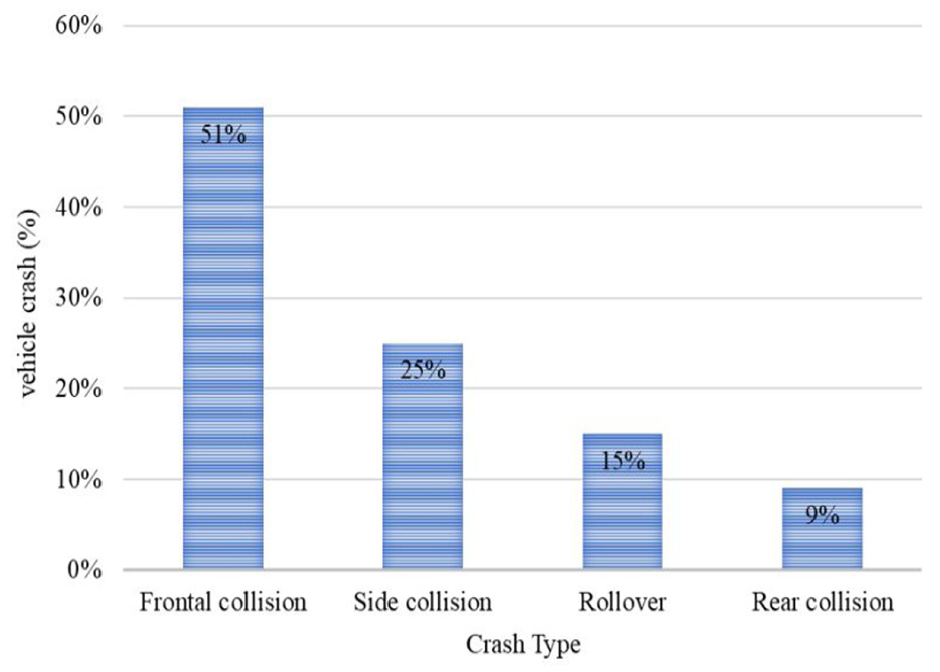
Vehicle crashes by crash type. 17
Crashworthiness mainly depends on the position, cross-section, and material of the intrusion barrier, so the novel design has to cope with the following crashworthiness problems:
Crash position: in the case of a full overlap crash (both longitudinal and engine involved) as in the case of an offset or oblique crash (at 40% overlap only one longitudinal directly involved) a similar amount of energy must be absorbed by the front structure.
Crash velocity: With a not much longer deformation length, much more energy must be absorbed at high crash velocities (resulting in less fatal injuries) and a lower injury level must be obtained at lower crash velocities.
Crash pulse: A deceleration pulse must be obtained which is optimal (lowest injury level) for the concerning relative collision speed and the chosen dummy restraint parameters.
Crash compatibility: The structure stiffness must also be optimized for the mass and stiffness of the struck object.
Mean crashing load: This is the average force or load at which the energy absorber deforms in stable manner and is obtained for a particular deflection by dividing the absorbed energy by the impact distance.
Peak force: It is the force at which first fold starts. It is higher than the mean load.
Crash Force Efficiency: It is the mean crashing force divided by the peak crashing force 18
The primary energy-absorbing areas are positioned in the front and rear areas of the automobiles, they are constructed in order to allow a controlled distortion. This type of deformation is employed to absorb the highest kinetic energy following a collision as shown in the Figure 6. 19

Example of a state-of-the art vehicle structure. 19
Simplified modeling
Four main categories include the most commonly used automotive crash design systems throughout the virtual production cycle: (1) Lumped mass spring (LMS) systems and system balance; (2) Collision lines; (3) Multibody lines (including rigid and flexible bodies); (4) Finite element (FE) model (hybrid, reduced order, submodel, and detailed). 20
In the BVO system, handrails, cabins, and passengers are the same size, and the energy absorption and control mechanisms of the components are easy to spring, as shown in Figure 7. The circle around the cabin and guardrails and the rebound number of energy absorbing components are not included in the model. 21

The analytic model of BVO system. 22
In the Figure 7, MB, M, and m are the mass of barrier, car, and person, respectively; XB, XV, and XO are the displacements of barrier, vehicle, and passenger correspondingly; VO is the starting speed for three masses; KB is the equivalent rigidity of barrier; K is the comparable stiffness of the front-end components of vehicle; k is the passenger restraint strength (the linear system’s stiffness).
The idea of the computer model is the rigidity of the front-end model of the car. The result of the model is the dynamic response of obstacles, vehicles, and passengers, as well as the evaluation of the collision.
Methodology
The concept design process resulted in a multitude of ideas from which we created the final specification and design. Different ideas have emerged to increase the crashworthiness of the Bishoftu pickup truck model. This includes safety development concepts and structure modification methods. Figure 8 shows the concept for engineering approach.
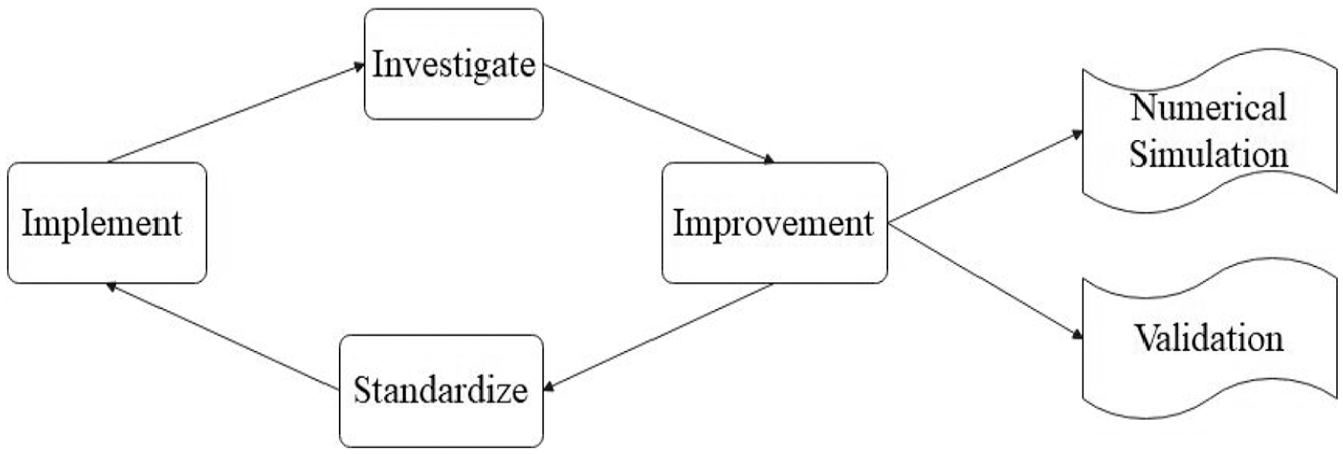
Approach to engineering research.
Modeling and mesh generation of the current Pickup Vehicle
Pickup geometry model for the Vehicle specifications from data collected on BAEI, Bishoftu are used to model the vehicle. While modeling in CATIA V5, a number of procedures are carried out before linking the geometry to LS DYNA. Sketcher is the first step of modeling, when the fundamental profile or component of the Pickup Vehicle is shown. The surface is then created, and each part’s matching extruding (pad) thickness is provided. The components are then put together to check for dimension errors. Consequently, the mesh type used is auto mesh type. LS-DYNA software was used to mesh vehicle geometry using a combination of linear quadrilateral and triangle elements. The dimensions of each element vary from 3 to 7 mm. There are 1,188,194 nodes and 1,154,037 elements in the meshed model. Figure 9 displays the mesh Pickup Vehicle assembled in bishoftu.
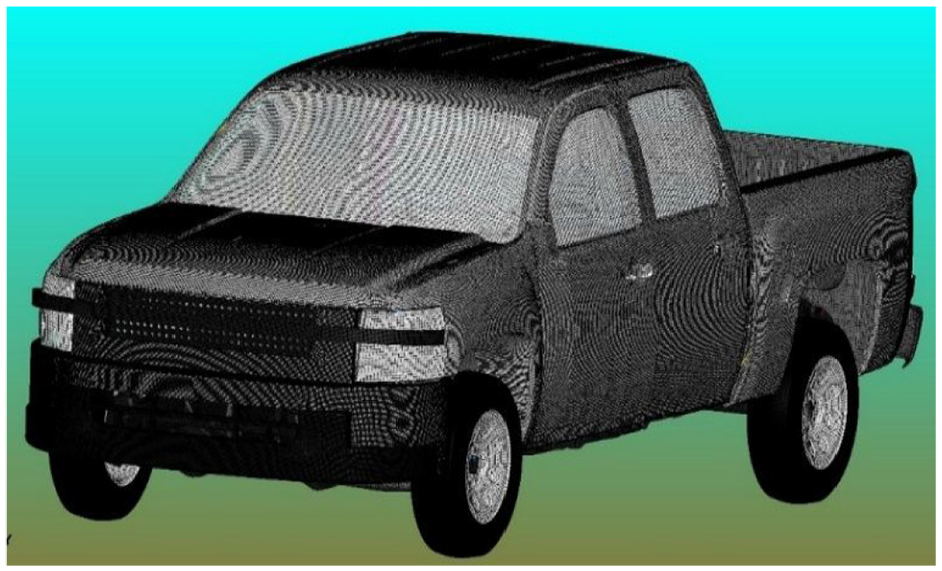
Meshed pickup vehicle assembled at bishoftu.
Check for element quality and shell normal
Incorrect values in certain fields (e.g. a negative value when this is not valid). This errors usually leads to usually errors like the above will result in LS-DYNA not running, and a termination so when running in LS-DYNA it is important that the issue is picked up at the pre analysis checking stage, as it may go unnoticed. Normal check is for reviewing and reversing shell, segment, and thick shell normal. Consistent normal in a part may be required to meet mesh quality standards, for contact definitions in LS DYNA.
Material, thickness, and contact definition
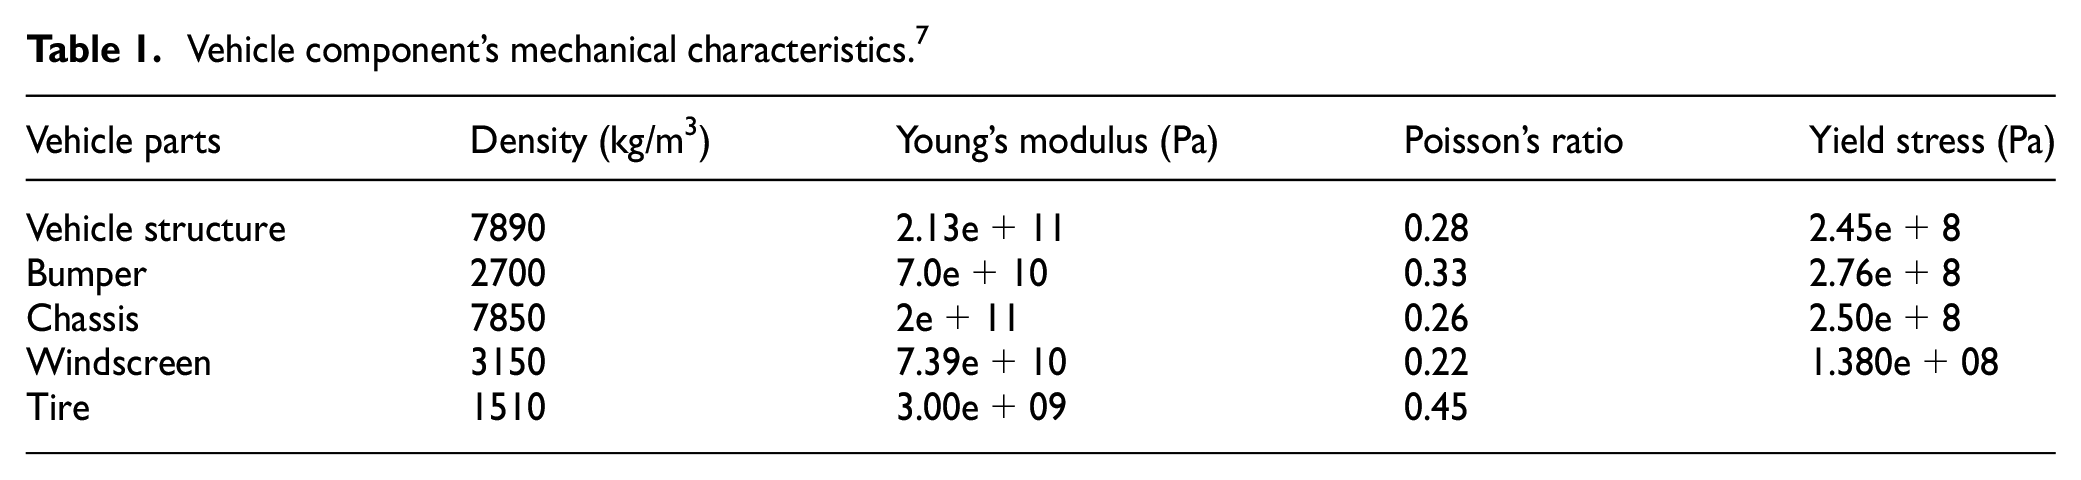
The most crucial elements that have a substantial impact on the impact simulation’s accuracy are the kinds and characteristics of the vehicle’s materials. Moreover, materials should have qualities that meet vehicle standards for safety, the environment, lightweight, fuel efficiency, and design. Table 1 lists the material mechanical characteristics of the main vehicle components. The thicknesses of the majority of vehicle parts such as Vehicle Structure, chassis, Windscreen, Tire are 1, 4, 4, 7 respectively and determined by section shells. The contact between the Tire and ground, the vehicle and external part are automatic surface to surface and the contact within the vehicle parts are automatic single surface is selected. 23
Vehicle component’s mechanical characteristics. 7
Boundary conditions and simulation environment
The goal of the impact test is to clearly define the damages to the Pickup vehicle’s front and side body structure. The simulation is set to 160 ms, and the vehicle is slamming into a hard wall and pole that is stationary on the other side with a pickup that is traveling at a speed of 60 km/h during front crash and 32 km/h during side crash. The impacts are shown in Figure 10. The three viewpoints of SET UP are examined in the section that follows. 5

Front and side impact SET UP.
Improvements to the current pickup truck
Maintaining the safety required to protect the driver and occupants makes high demands on the frame structure, particularly in the case of serious accidents. The final 3D model of the modified vehicle is shown on Figure 11 below. Since modifications were done symmetrically so the stability of the vehicle is not also affected by the modifications.

Modification made on Bishoftu pickup.
Bumper and beam material
In different studies, we found that the performance of bumpers and cross-members in the event of a crash depends on the materials used. Therefore, the use of heavy equipment and good crash capability will allow reducing the weight of the vehicle, thereby improving fuel consumption and reducing the amount of pollution. The most important factors are: the ability of the system to absorb shocks or impacts, to stay intact at high-speed impacts, weight, manufacturing process ability and cost are also the factors in design phase, and both initial cost and repair cost are also important.
Aluminum foam is a product made of aluminum having a large number of pores or cavities as shown in Table 2. The advantages of aluminum foam for cars are: high strength and stiffness to weight ratio, Corrosion resistance, withstand serious damage, light weight, easily formed into geometries, strong, very strong, and can absorb a lot of energy.
Frontal bumper material property. 24

Advanced high-strength steels (AHSS) are routinely used in numerous manufacturing applications due to their good combination of desirable properties such as high formability, high strength, good ductility, light-weight, and low cost as well as high deformation hardening, which implies a high energy absorbing ability or “crashworthiness.” Advantages of advanced high strength steel (AHSS) DP 980 steel material are: good crash performance, light weight as compared to conventional steels, cost effective solution.
The material properties are shown in Table 3:
Material properties of DP 980 steel material.

Boundary conditions
Different limits for testing each driver and setter are represented by LS-DYNA’s options. INITIAL_VELOCITY_GENERATION is used to define the speed of movements such as front and gate. CONTACT_AUTOMATIC_SURFACE_SURFACE_ID between vehicle and collision. For the simulation time, CONTROL_TERMINATION is set to 0.16 s, for zero energy type use CONTROL_HOURGLASS IHQ = 4, IBQ = 0 for non-integrated deformations. For output values in DATABASE_EXTENT_BINARY; Select D3PLOT, D3DUMP, ASCII.
Result and discussion
Conservation of energy
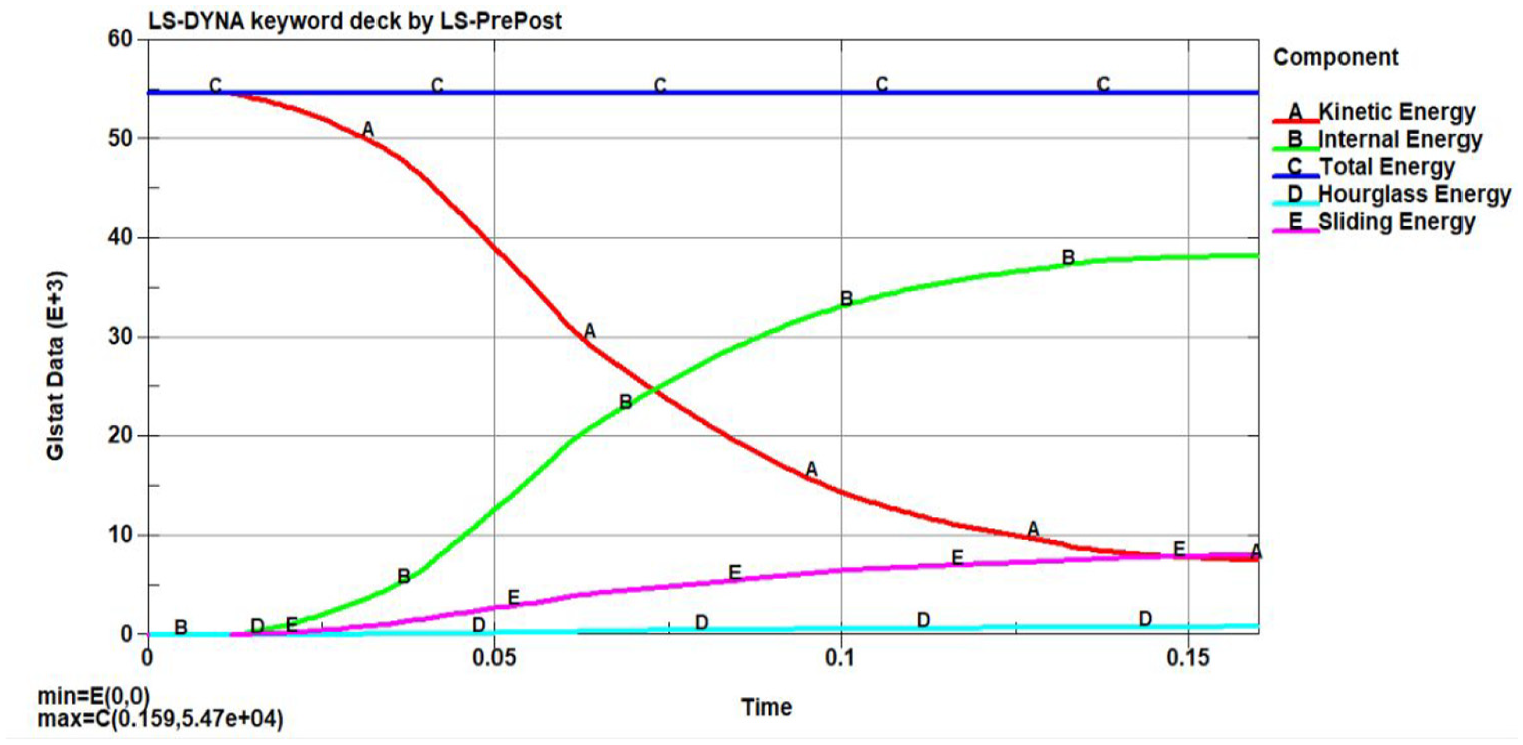
The energy versus time graph of the total system is shown in Figure 12. The simulation shows how the idea of energy conservation is maintained by converting kinetic energy lost during impact into different forms of energy, such as sliding energy, internal energy, and hourglass energy. The graph of total energy stays mostly unchanged.

Front collision energy balance curve.
Energy-time graphs for all systems are shown in Figures 12 and 13. As can be seen, the total energy of the system remains almost constant throughout the 0.16 s simulation and has a load equal to the first kinetic energy of 175 kJ. Frontal impact 54.7 kJ, side impact 54.7 kJ. On the other hand, when the collision begins, the kinetic energy of the whole body begins to decrease and turns into internal energy, linear energy, shear energy, or other types of energy. This increases from zero energy. Most of the absorbed energy comes from the deformation of the structure.
Side collision conservation of energy.
The structural reaction
The structural response of the original and modified Pickup vehicle for the 0.16 s simulation is displayed in Figure 14. From the figure, the structural deformation of the existing vehicles looks more as compared to the modified for example the front fenders of the existing model damage to much whereas the very less for modified one and also the rear wheels of the existing model leave the ground and rotate whereas slight (little) on the modified. Generally, the structural response of the Pickup vehicle was determined by comparing the internal energy absorbed and impact energy after collision.

Structural reaction of the existing (a) and modified model (b).
Intrusion into the vehicle is obtained by measuring the relative displacement of the node where there is no deformation with the node at another side where the deformation is more. Figure 15 shows the un-deformed and the final deformation of the pickup before and after impact with the rigid pole. As it can be seen, from the original width of the pickup, due to the side crash the side structure of the vehicle deformed 539 mm whereas 377 mm in the modified model.

Structural reaction of the current and new model.
Velocity of Pickup Vehicle components
To analyze the change of speed of varying vehicle section, I take the front most (lower bumper), front, middle, and back section in all four points (node 115,324, node 1,247,900, 508,903 and node 879,701 respectively). As the Figure 16 shows, initially the vehicles velocity is given positive initial velocity of 16.6667 m/s in horizontal direction, the speed on node 115,324 (lower bumper) falls down the most quickly because it is the point where the first impact contact occurs, and reach a velocity of 3.4 m/s at time 160 ms it has come down and then up which shows the rebounding of the part. The speed on node 1,247,900 (hood) initially starts to move with constant velocity of 16.6667 m/s until the body starts to deform and then decreases its speed with rebounding effect and finally reach a velocity of 0.1 m/s. Node 508,903 (a point in the cabin of the vehicle) falls down linearly to 2 m/s at 160 ms without rebounding effect. Node 879,701 (a point on the rear part of the vehicle) starts increasing the speed to 20.7 m/s then falls down with fluctuation, this reflects the phenomena that the vehicle would generate rebound after crash.

Velocity of nodes on pickup.
Energy absorbed by the vehicle components
From the energy absorbed by the whole system, front parts of the vehicle contributes107.09 kJ of absorbed energy. This covers 75.4% of the total energy absorbed by the whole system. Figure 17 shows the energy absorbed by frontal parts with primary and secondary axis versus time. As indicated the parts listed under primary axis absorbed much of energy by covering 99.35% of the energy absorbed by Vehicle parts. The front structure (bumper and front body structure) is responsible for most of the energy absorbed as it is very near to the frontal collision contact area.

Energy absorbed vehicle parts for front crash.
From the total energy absorbed by the whole system, the energy absorbed by the vehicle side parts is equal with 27.32 kJ as shown on the Figure 18. This shows that 77.4% of the total amount of energy is absorbed by the side structure. Thus, the lower frame structure (chassis, floor) which support the front and rear structure, door and also roof structure have absorbed maximum of 21.59 kJ of energy which is 61.16% of total absorbed energy. From the absorbed energy, the remaining 22.6% of the energy (7.98 kJ) is obtained by the deformation of front and rear body structure. This is quite easy to predict because the pole has direct contact with the side structure. This is due to the force of impact transferred from the rigid pole to front and rear structure.
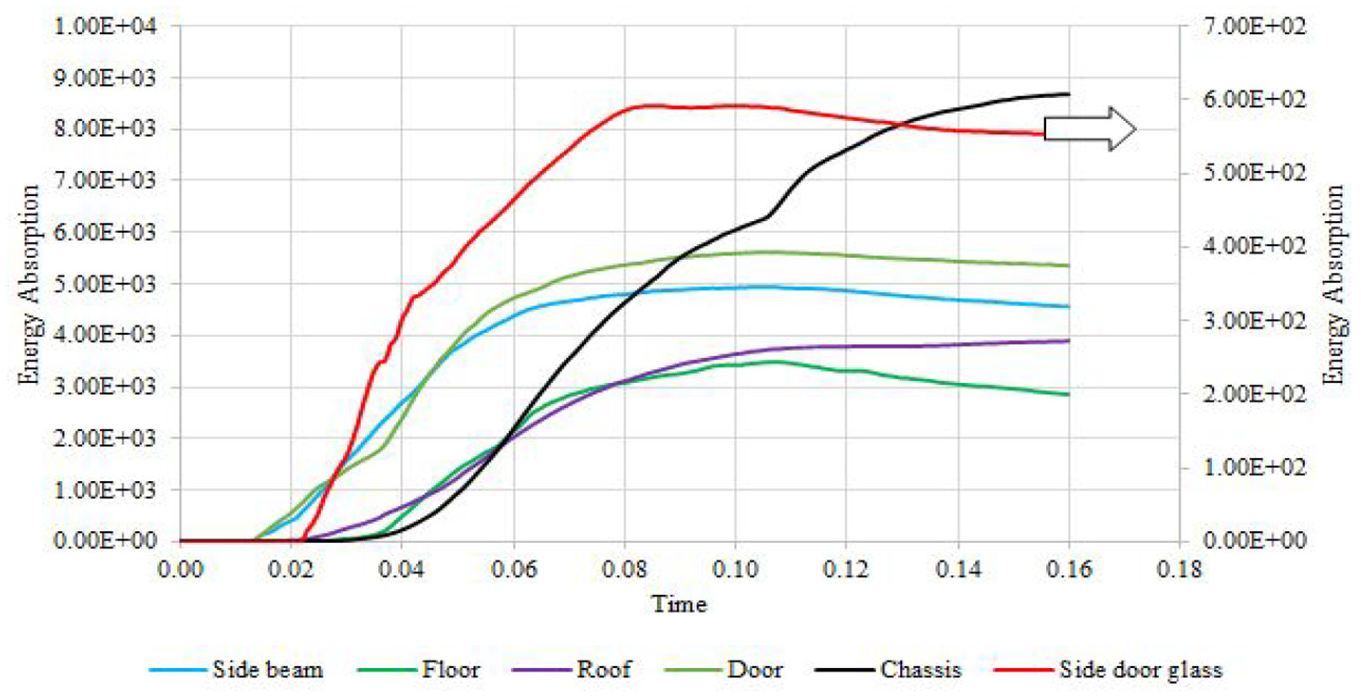
Energy absorbed side components during side collision.
Resultant moment
As stated on the Figure 19 (a and b) present model during the frontal and side collision (c and d) updated model for frontal and side collision respectively, the resultant moment produced during the impact of frontal areas such as bumper, the current (existing) model is 214 kNm and for the new model is 379 kNm. Whereas during side collision the moment produced at the side door of the current model is 204 kN and the new model is 177 kN. As shown below the moment generated in the new model is even more the oscillation stabilizes fast where as more in the existing model this indicates that the new model has the capacity to absorb most of the moment force generated.
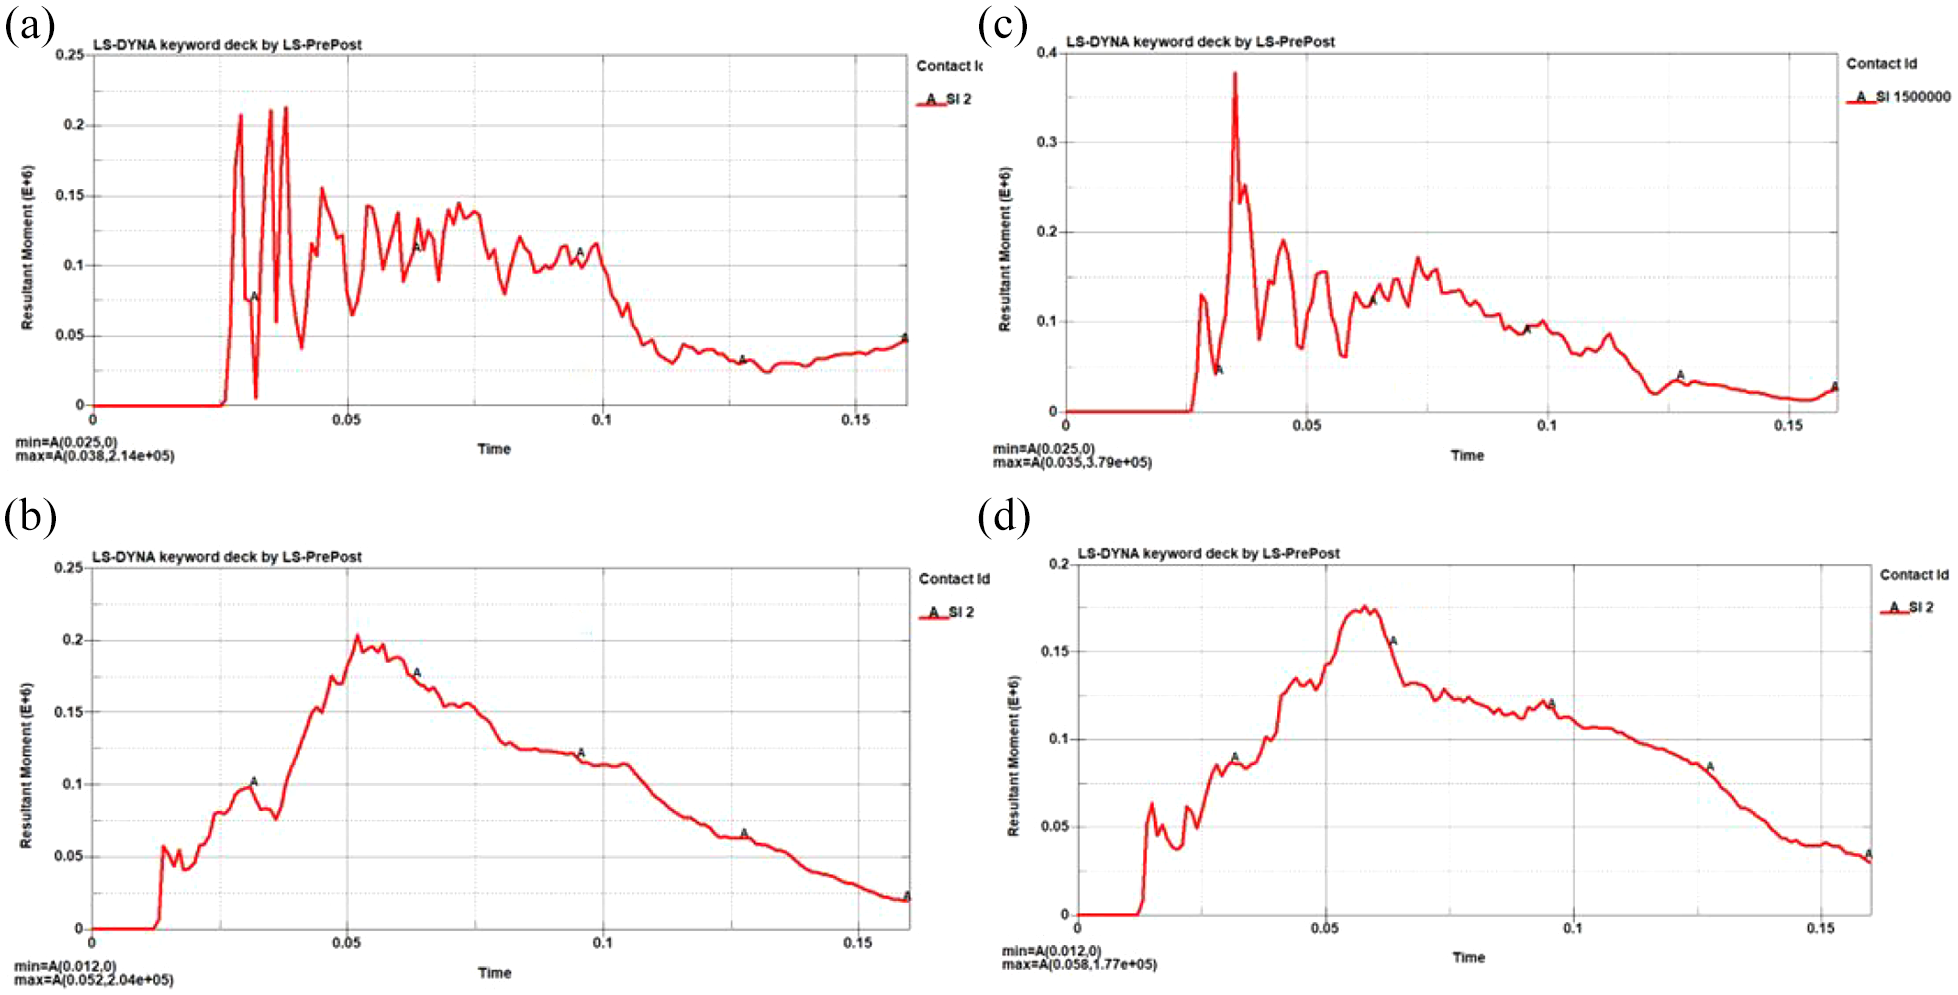
Resultant moment for (a and b) current model (c and d) new model.
Relation of energy absorbed to deformation
The relation of energy absorbed and deformation is stated on the Figure 20 (a and b) Existing front and side (c and d) developed front and side collision model respectively, during the current (existing) model the energy absorbed for 571 mm of deformation is 137 kJ and for the new model of 570 mm deformation is 142 kJ. This indicates that with in less deformation the modified model absorbs more energy during both collisions under the same simulation environment.

Relation between energy absorbed and deformation for (a and b) existing (c and d) developed model.
Internal energy
The total energy absorbed by the current model and the modified model is shown in Figure 21. The new design absorbs the most energy. This is because the buffer material used in the modification causes more deformation and more absorption. The difference in absorption in a forward collision is 5 kJ (energy absorption increased by 3.52%). The modified model for impact absorbs the maximum amount of kinetic energy with an internal energy equal to 38.2 kJ. The current standard is still 35.3 kJ. This also shows that the developed structure can absorb more kinetic energy with less deformation. In this way, it will help reduce the energy cost to citizens. Since the simulation conditions of the two models are the same, the energy absorption capacity of the model is calculated using all internal energy diagrams. The internal energy of the model is represented by the green line (change) and red line (still).
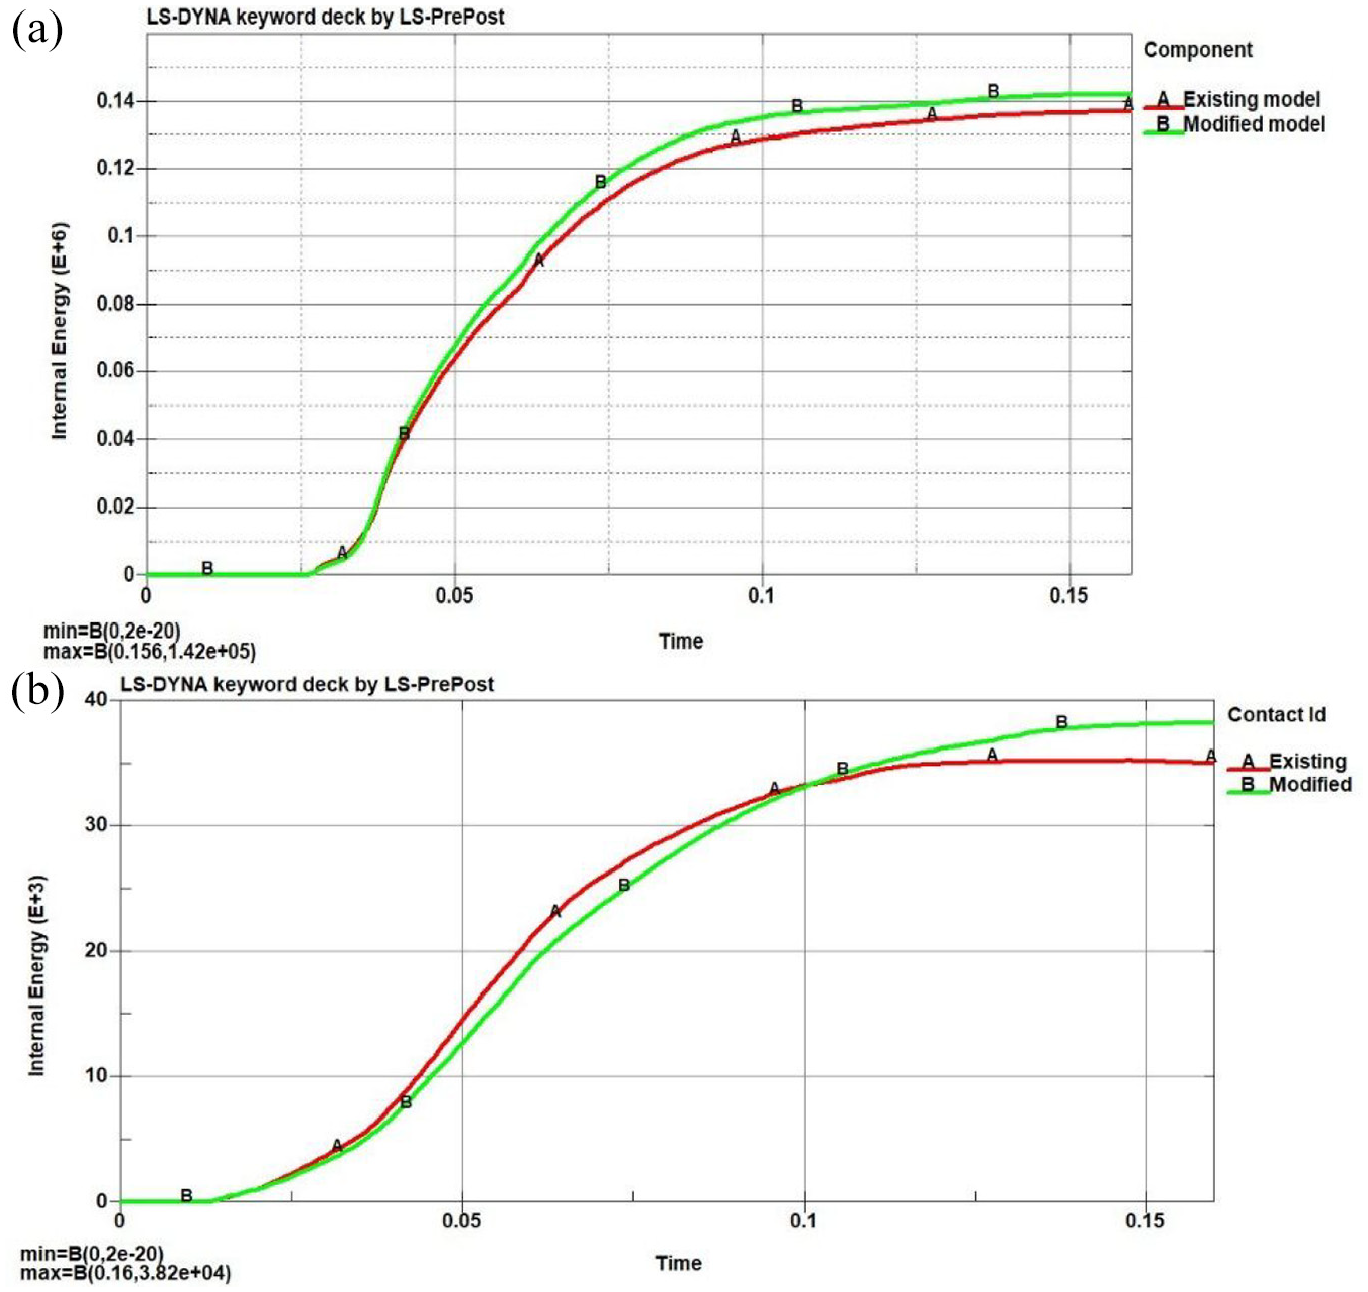
Internal energy of frontal (a) and side model (b).
Impact force
The improved model has a better force of impact in addition to internal energy, as seen in Figure 22. The updated model produced a force of 460 kN, whereas the highest impact force is 499 kN on the present model. This is a 7.82% improvement in impact force. From the figure below, the greatest side force of impact happens at the old model with a value 84.6 kN while the force on the changed model is equivalent to 72.4 kN. Therefore, their difference is 12.2 kN. Therefore, a significant change in force can cause serious damage to the vehicle by producing more force on the vehicle. The red line shows the current model and the green line shows the changing model. A larger impact could cause more danger to passengers. Therefore, it can be said that the new model will reduce the impact on passengers.

Force of impact for front (a) and side collision model (b).
Verification parameters
The verification procedure can be used to determine whether values obtained from computer simulations are appropriate in the absence of experimental evidence. With LS DYNA simulation, verification is achievable. 25 The following are the most widely used and reasonable methods:
Energy Ratio
The ratio of TE/HE
Energy ratio
Figure 23 shows the energy ratio for the entire system, with values ranging from 1.0159 to 1.0157. This value in the range stated above is acceptable.
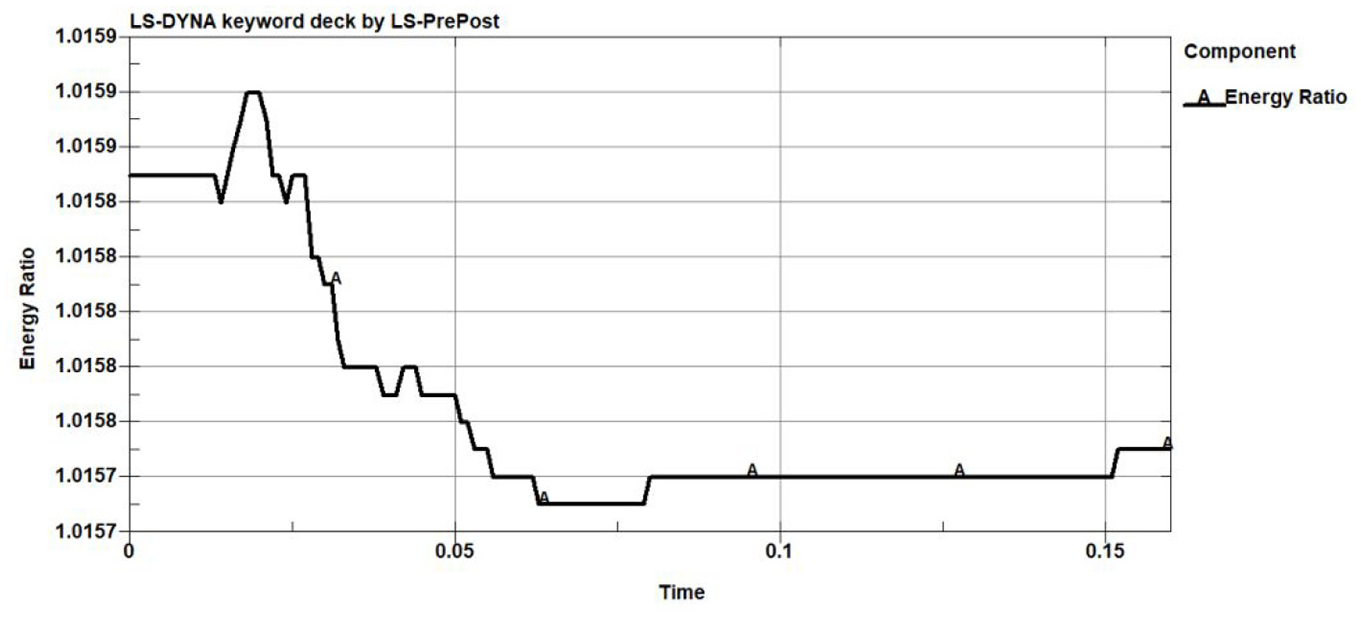
Energy ratio.
HE/TE ratio
Another way to analyze FEA results is the ratio of total energy to calculated energy. As shown in the figure, the power diagram of the hourglass power is plotted against time on the right vertical axis, and the total power is plotted against time on the left vertical axis. The highest energy recorded was equal to 0.833 kJ and the total energy was 54.7 kJ. The ratio of values (HE/TE) is less than 5%. If the hourglass force is less than 5% of the total force, the finite element model is reliable. Figure 24 shows the TE/HE diagram.

HE/TE.
Validation
Finite element model analysis is validated with a real-time crash of the NCAP crash test. The simulated outcome is very similar to the actual crash, as seen in the image. Figure 25 show the simulation sequence of FEM of pickup vehicle versus the real crash of pickup.

Sequence of frontal crash FEA versus real NCAP test.
Figure 26 shows the truck’s side bar test results with the NCAP test indicator. As can be seen, finite element simulations are similar to trace scale.

Sequence of side pole crash FEA versus real NCAP crash test.
Conclusion
The study clearly states the problems exist on Pickup vehicle assembled at bishoftu during event of front and side crash scenarios. Hence, the present Pickup Vehicle’s crashworthiness is numerically analyzed using NCAP standards and regulations. Analysis is done on the front and side collision of the current vehicle. In addition, the vehicle’s structural crashworthiness was modified in light of the current model’s performance. Better crashworthiness measures have been added to the revised Pickup vehicle, which improves occupant safety. The modified model absorbs more total energy than the current model, as well as having a smaller impact energy. This is due to the mechanical properties of the material used for the modification, as a result it deforms more and produces more absorption and low impact force as compared to the existing one. The new model generates more moment force that stabilize fast as compared to the current and also the relationship between energy absorbed and deformation is seen that with in less deformation the new model absorbs more energy that the current model. This clearly indicates the oscillation of moment force during the new model is less. So, the crash performance of the modified model is better.
Footnotes
Handling Editor: Sharmili Pandian
Declaration of conflicting interests
The author(s) declared no potential conflicts of interest with respect to the research, authorship, and/or publication of this article.
Funding
The author(s) received no financial support for the research, authorship, and/or publication of this article.
Availability of data and material
Information will be provided upon request.