
Abstract
With the constant prioritization for vehicle lightweighting, high temperature forming processes are increasing in demand due to their capability to produce large and complex parts in a single forming operation. Superplastic forming is utilized to form such parts, but this process typically requires long forming times. To remedy this, an increasing number of processes are being developed which utilize a higher and more variable strain rate history during the forming process. As a result, there is a growing need to develop material models capable of simulating high-temperature forming processes characterized by variable strain rates and different deformation mechanisms acting at different strain rates. This study proposes the utilization of physical based modelling concepts to construct a simple, phenomenological model that is easy to use within industry. Consequently, tensile tests were conducted on aluminum alloy AA5083 at temperatures of 400°C, 450°C and 500°C, at strain rates ranging from 0.0005 s−1 to 0.15 s−1. Additionally, an iterative model parameter calibration procedure is proposed, verified, and validated with LS-DYNA finite element simulations to achieve accurate predictions of material behaviour all the way up to the onset of localized necking. The generated material model(s) yielded validation metrics greater than 96% for the investigated data sets. The accuracy of the model was further assessed using tensile testing data with changing strain rates, yielding validation metrics on average greater than 90%.
Introduction
Superplastic forming (SPF) is a well-known metal forming process driven by the need for vehicle lightweighting. 1 SPF is typically conducted at temperatures approximately equal to one-half the melting temperature and at low forming rates, typically less than 0.001 s−1. Due to these extreme process conditions, applications are limited to low volume production parts such as those manufactured for aerospace, biomedical and some automotive applications. Because of these limitations, several new processes such as high-speed blow forming, 2 superplastic-like forming, 3 quick plastic forming, 4 oscillation-enhanced SPF 5 and two-step SPF 6 have been developed and implemented through academic and industrial research partnerships. One differentiating factor between traditional SPF and the newer high-temperature forming processes is that the new processes do not adhere to the controlled and constant strain rates typically implemented in SPF. As a result, numerical simulations that rely on traditional constant strain rate material models and assumptions of steady state flow behaviour tend to lack accuracy.
Additionally, due to the high costs associated with conducting forming trials at these process conditions, the accuracy of numerical models is vital for reducing manufacturing costs and increasing process efficiency. Work continues to be on going for optimizing the simulation of the process conditions in SPF,7,8 but there lacks a consensus on the correct approach for the appropriate constitutive material modelling for the various and increasingly complex high temperature forming processes.
Constitutive models can be separated into two categories, namely, phenomenological models and micromechanical or physical models. Phenomenological models are constructed based solely on the stress/strain/strain rate behaviour collected from material characterization tests such as tensile testing. In contrast, micromechanical models utilize tensile test data along with extensive microstructure investigation to model micro-scale mechanisms such as grain growth and cavitation.
Micromechanical models
The use of micromechanical (MM) models is typically of interest in academia due to the thoroughness of the constructed models as well as their reported accuracy to describe material behaviour and performance. Despite this, the implementation of microstructural deformation and failure micro-mechanisms requires very extensive testing and investigation. Additionally, to determine the modelling parameters a multi-objective analysis must be undertaken making the fitting process more complex and less practical for usage in industry.
One of the most used MM models is the unified constitutive model developed by various researchers:9,10
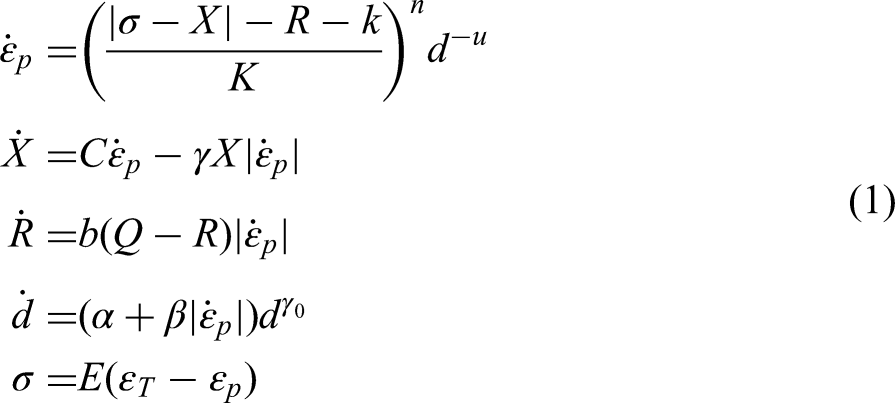
Another commonly applied micromechanical model is the microstructure overstress model:
11
Phenomenological models
Due to their simplicity and ease of use, phenomenological models are most widely used in the fast-paced manufacturing industry. With this phenomenological approach the material is characterized by utilizing traditional testing procedures such as uniaxial tensile tests, 12 or less conventionally biaxial tensile testing, 13 or high temperature bulge testing. 14 Which can then be utilized to construct and optimize a phenomenological material model from the relationships between strain, strain rate and the material's flow stress.
One of the early phenomenological models used to describe superplasticity was developed by Backofen
15
and utilized a strain rate hardening approach as shown in equation (3):


Due to this, a significant amount of work has gone into the modelling of processes with a wider range of strain rates taking into consideration the change in material behaviour with varying strain rates. Gao
19
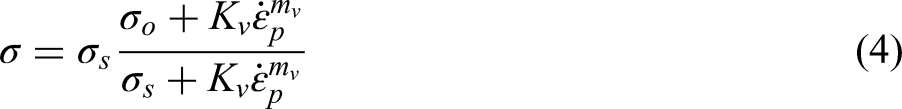
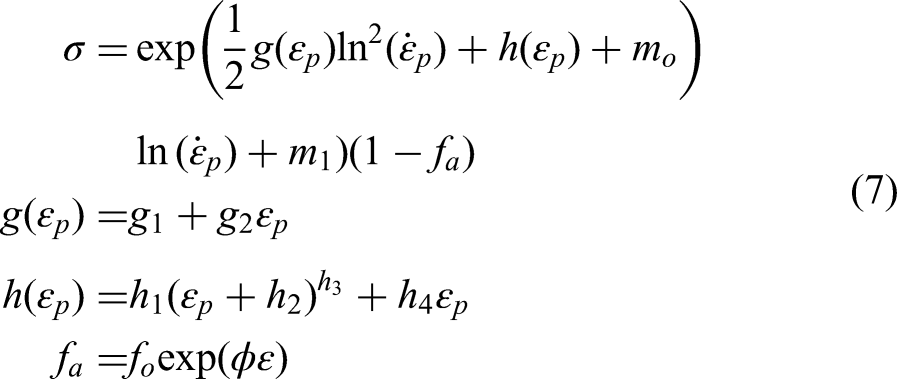
modelled the high-temperature behaviour of various titanium alloys by accounting for the dynamic hardening behaviour as well as the proposed depreciation of the rate sensitivity with respect to strain as shown in equation (6):

Further research done by Majidi et al.
21
utilized the concept of a depreciating strain rate sensitivity index for modelling the high temperature deformation of various materials:
Existing models have indicated a strong degree of accuracy, but all have their limitations. The current study proposes a model combining physical based modelling concepts, while maintaining the simplicity of phenomenological models. The primary proposal is predicated on the model being path-dependent, as opposed to state dependent. This means that hardening and softening are modelled based on the strain rate history, as opposed to the accumulated plastic strain and the current strain rate. The model will be constructed, calibrated, verified and validated using easy and affordable tensile tests coupled with finite element analyses of the same tests. And the proposed model will be further verified using variable crosshead velocity tensile tests and comparing the numerical predictions to the experimental data.
Experimental work and proposed numerical model
Viscous behaviour of AA5083
As indicated in the literature, the primary temperature for the superplastic forming of the AA5083 alloy is in the range of 450–500°C. 22 Considering this, and the desire for reducing forming temperatures, temperatures of 400°C, 450°C and 500°C were selected for this study. The sample geometry selected follows the ASTM standard for material characterization, 23 having a gauge length of 25 mm and a gauge width and thickness of 6 mm and 1.4 mm, respectively. This geometry is advantageous to reduce material flow from the grip region as evidenced by the work of Abu-Farha et al.24,25 In contrast to the ASTM standard, constant crosshead velocity tests were selected. Since an iterative finite element study will be conducted and grain growth in the AA5083 alloy is typically limited this was deemed suitable for the development of the model. A double screw tensile test machine with two ceramic radiant heaters was used. The test setup allowed the furnace to be heated to the testing temperature and a five-minute soaking time was adopted to reach thermal equilibrium prior to the onset of deformation. The tensile specimens were manufactured using wire EDM based on recommendations from the literature. 26
Due to the high costs of superplastic sheet material a clearly defined testing procedure is required to ensure efficiency and efficacy of the material characterization with a view to developing an improved phenomenological model. The proposed model is predicated on the separation of the viscous behaviour, that being, the stress response as a function of the strain rate (
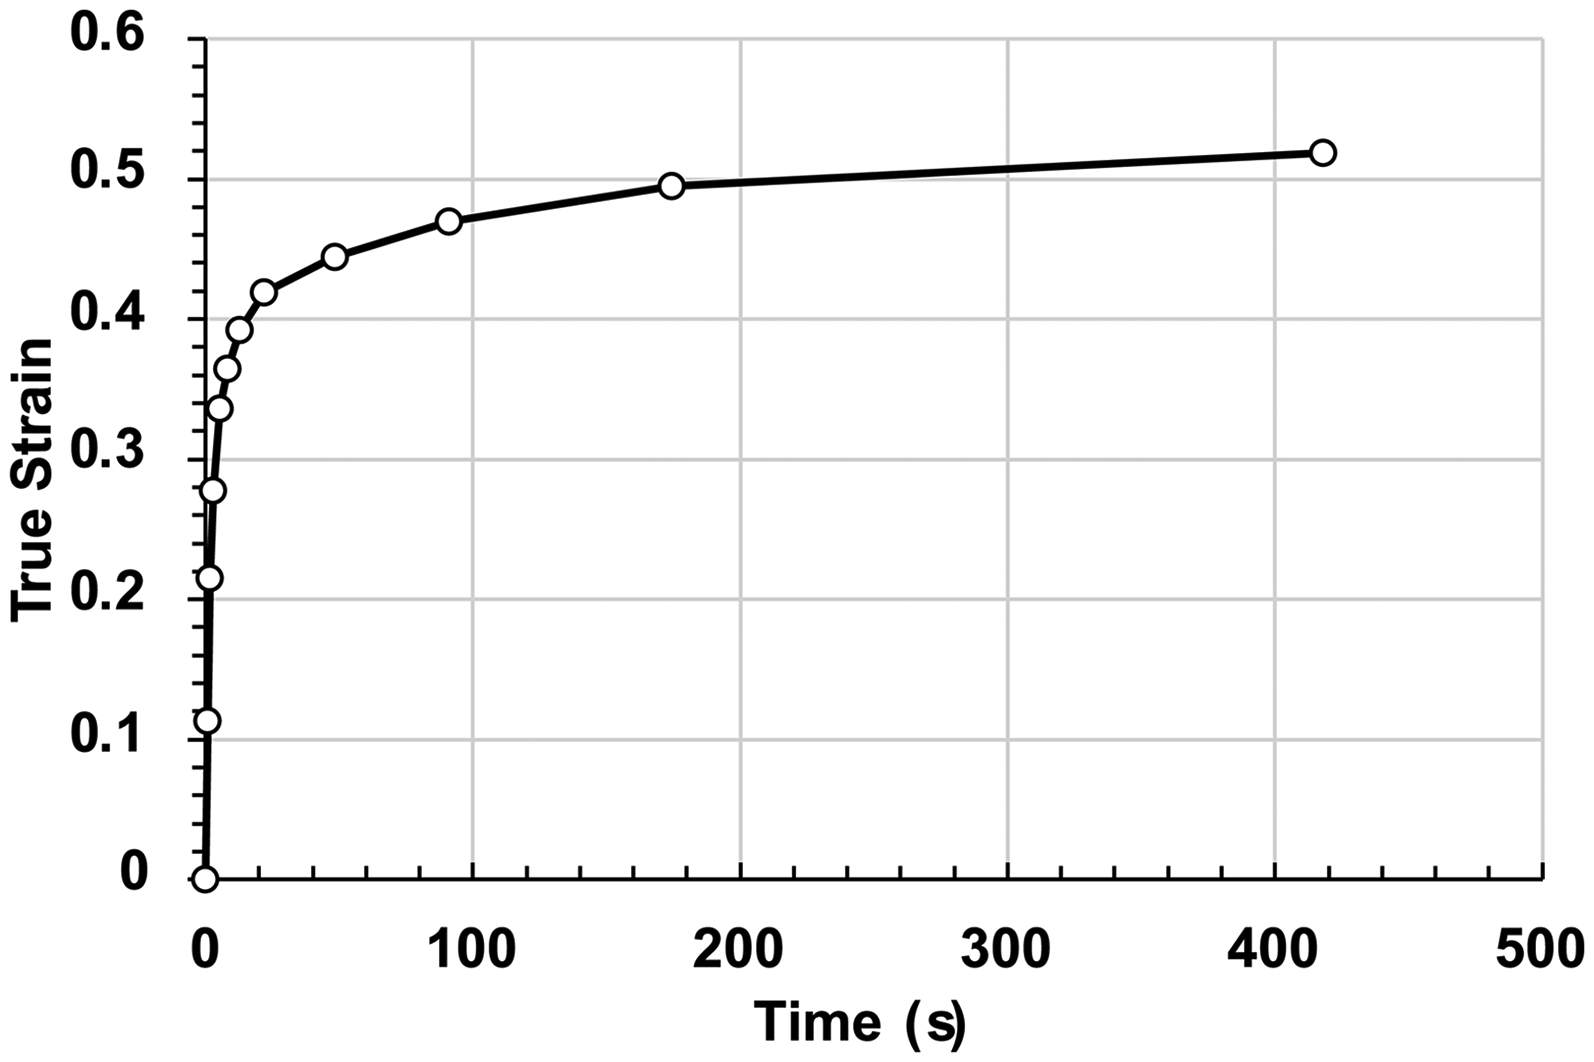
Strain versus time for completed stepped tensile tests.
Each test was run with two repetitions with the model being fit to both test results to ensure that the mean material behaviour was captured. The results of the stepped tensile tests are shown in Figure 2.
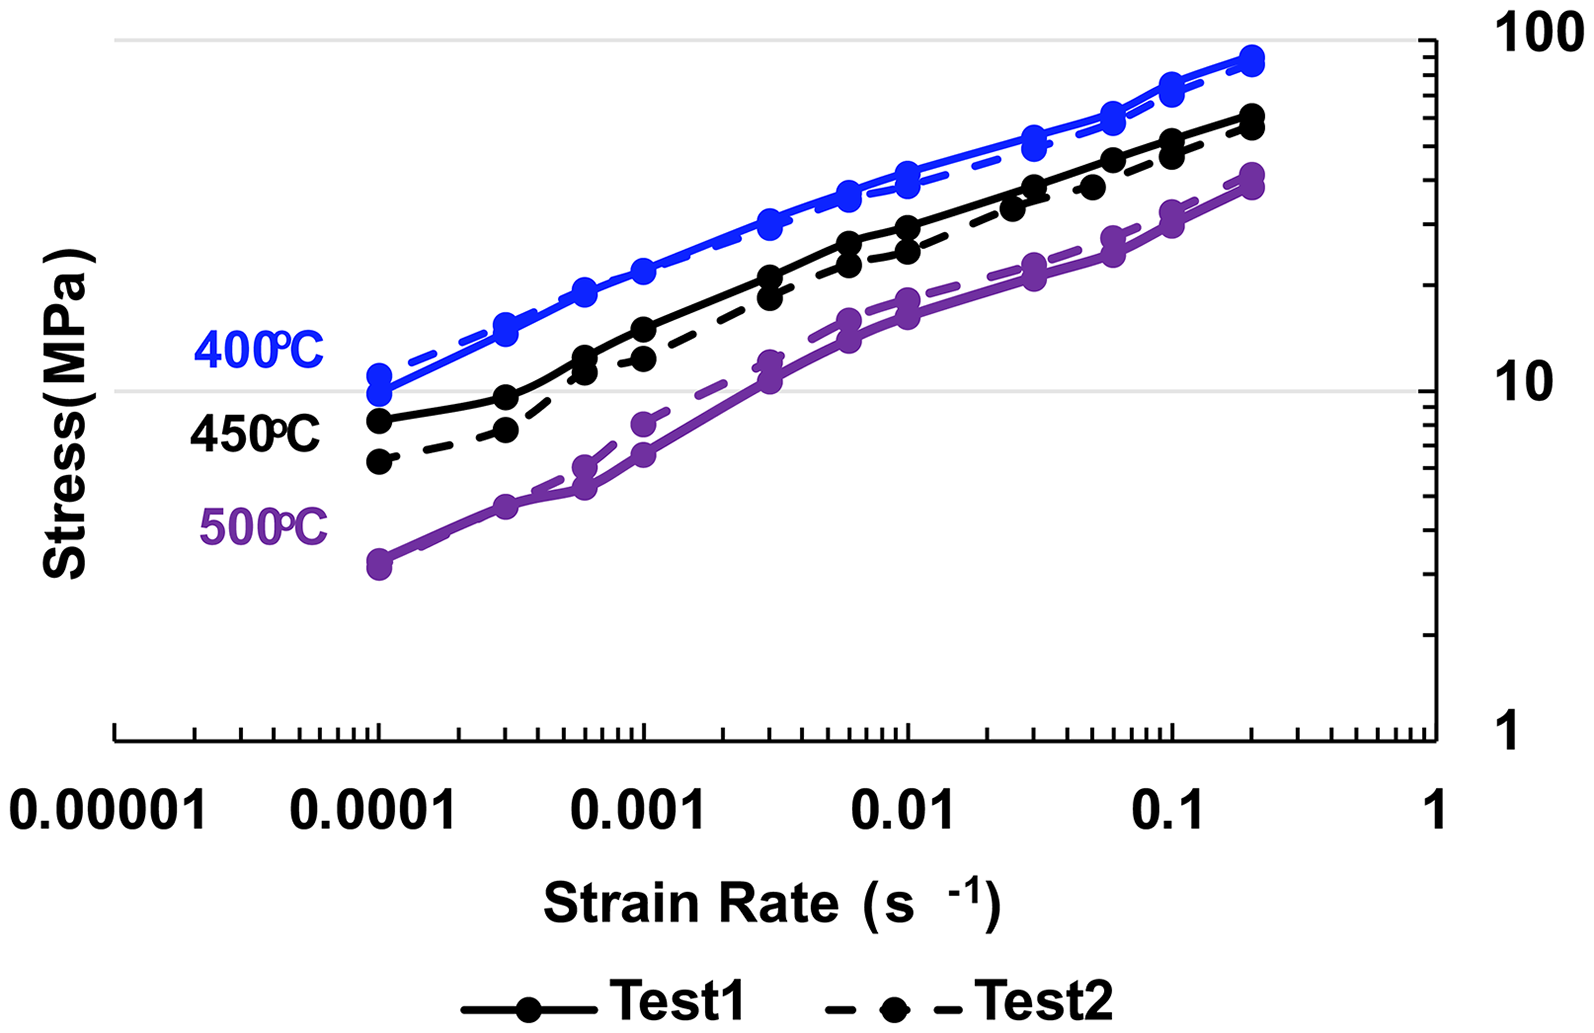
Results of stepped tensile tests at three selected temperatures.
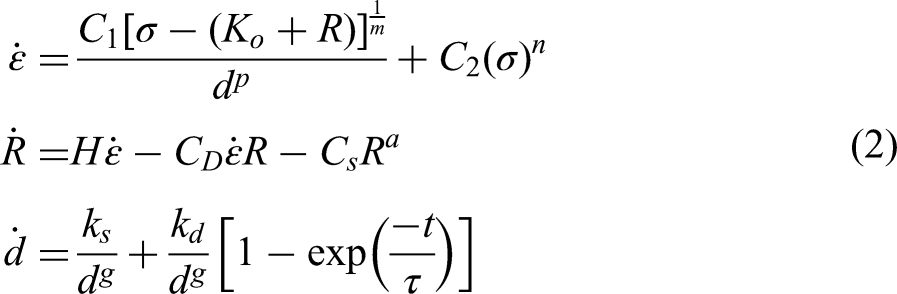
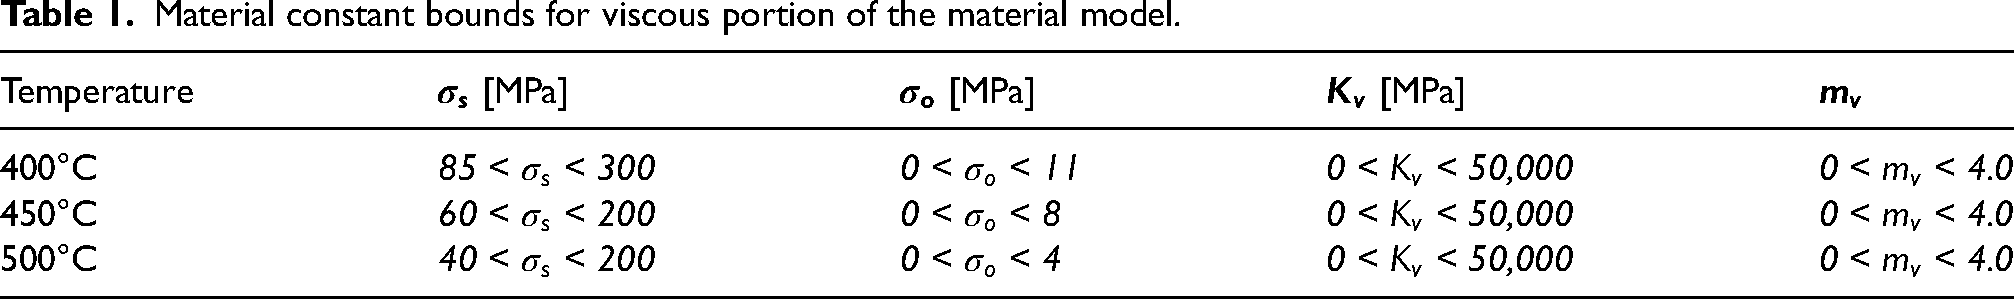
Following this, the selection of the appropriate approach to model the viscous behaviour was selected. Considering suggestions in literature, to model the variation of the strain rate sensitivity index with respect to strain rate, the model proposed by Smirnov was selected as outlined in equation (4). An additional benefit to this model is the ability to simply prescribe bounds to each of the material constants. As a result, fitting the constants is much easier numerically. The bounds for each of the material constants are shown in Table 1.
Material constant bounds for viscous portion of the material model.
The model was fit using numerical optimization techniques, primarily the generalized reduced gradient nonlinear optimization method and evolutionary algorithms, to minimize the error function (E) defined in equation (8):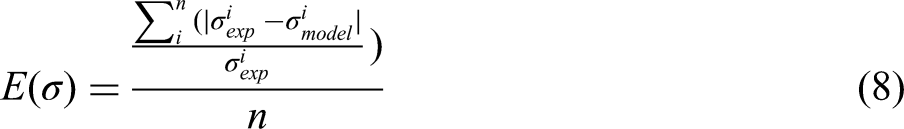
The resultant model fit is shown in Figure 3 for each of the test temperatures.
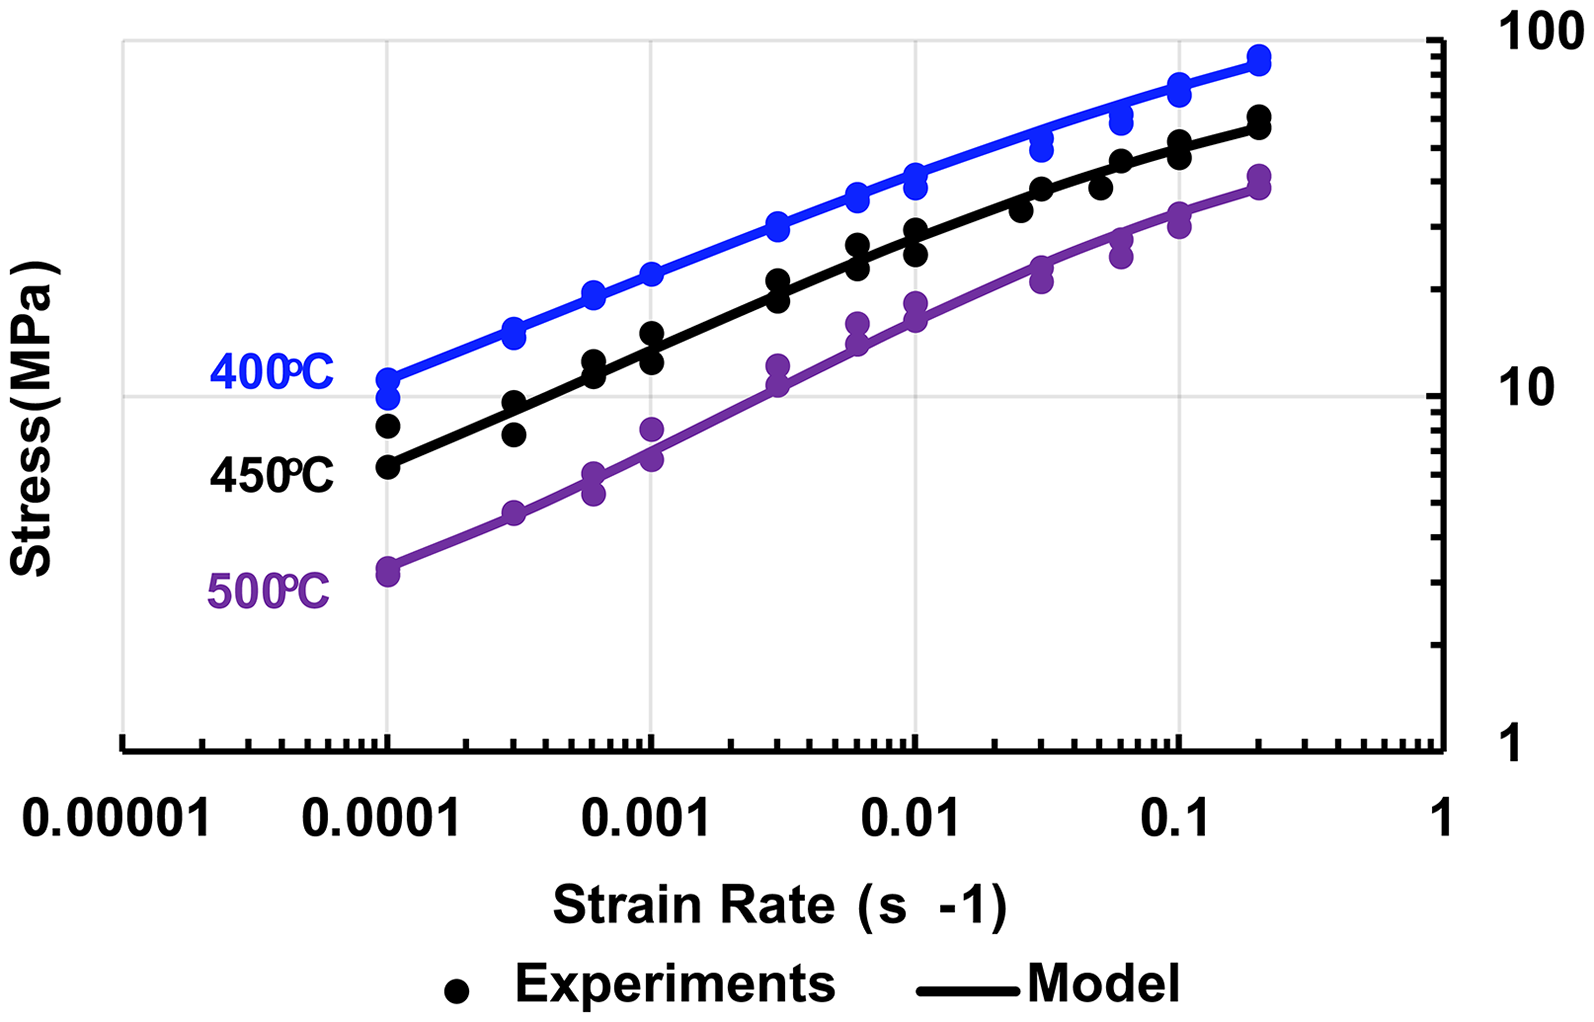
Stress behaviour with respect to strain rate at three selected temperatures with Smirnov model fit.
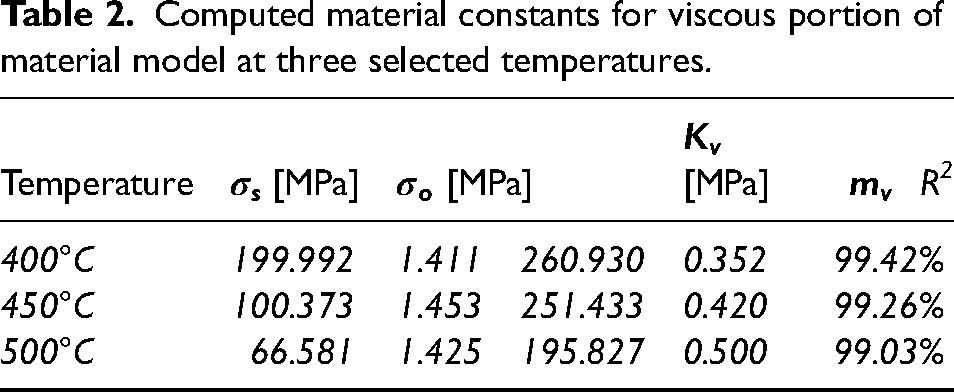
The calculated model constants and the corresponding correlation coefficients are shown in Table 2.
Computed material constants for viscous portion of material model at three selected temperatures.
An added benefit of this material model is the ease of calculation of the predicted strain rate sensitivity index, m, as a function of strain rate. This is done by computing the logarithmic derivative of stress shown in equation (4) with respect to logarithmic strain rate as shown in equation (9):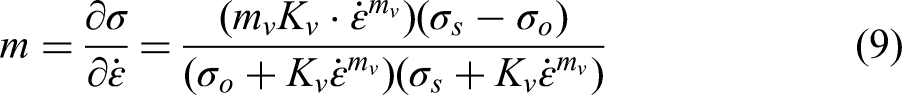
The resultant m values with respect to strain rate for the three temperatures are plotted in Figure 4.
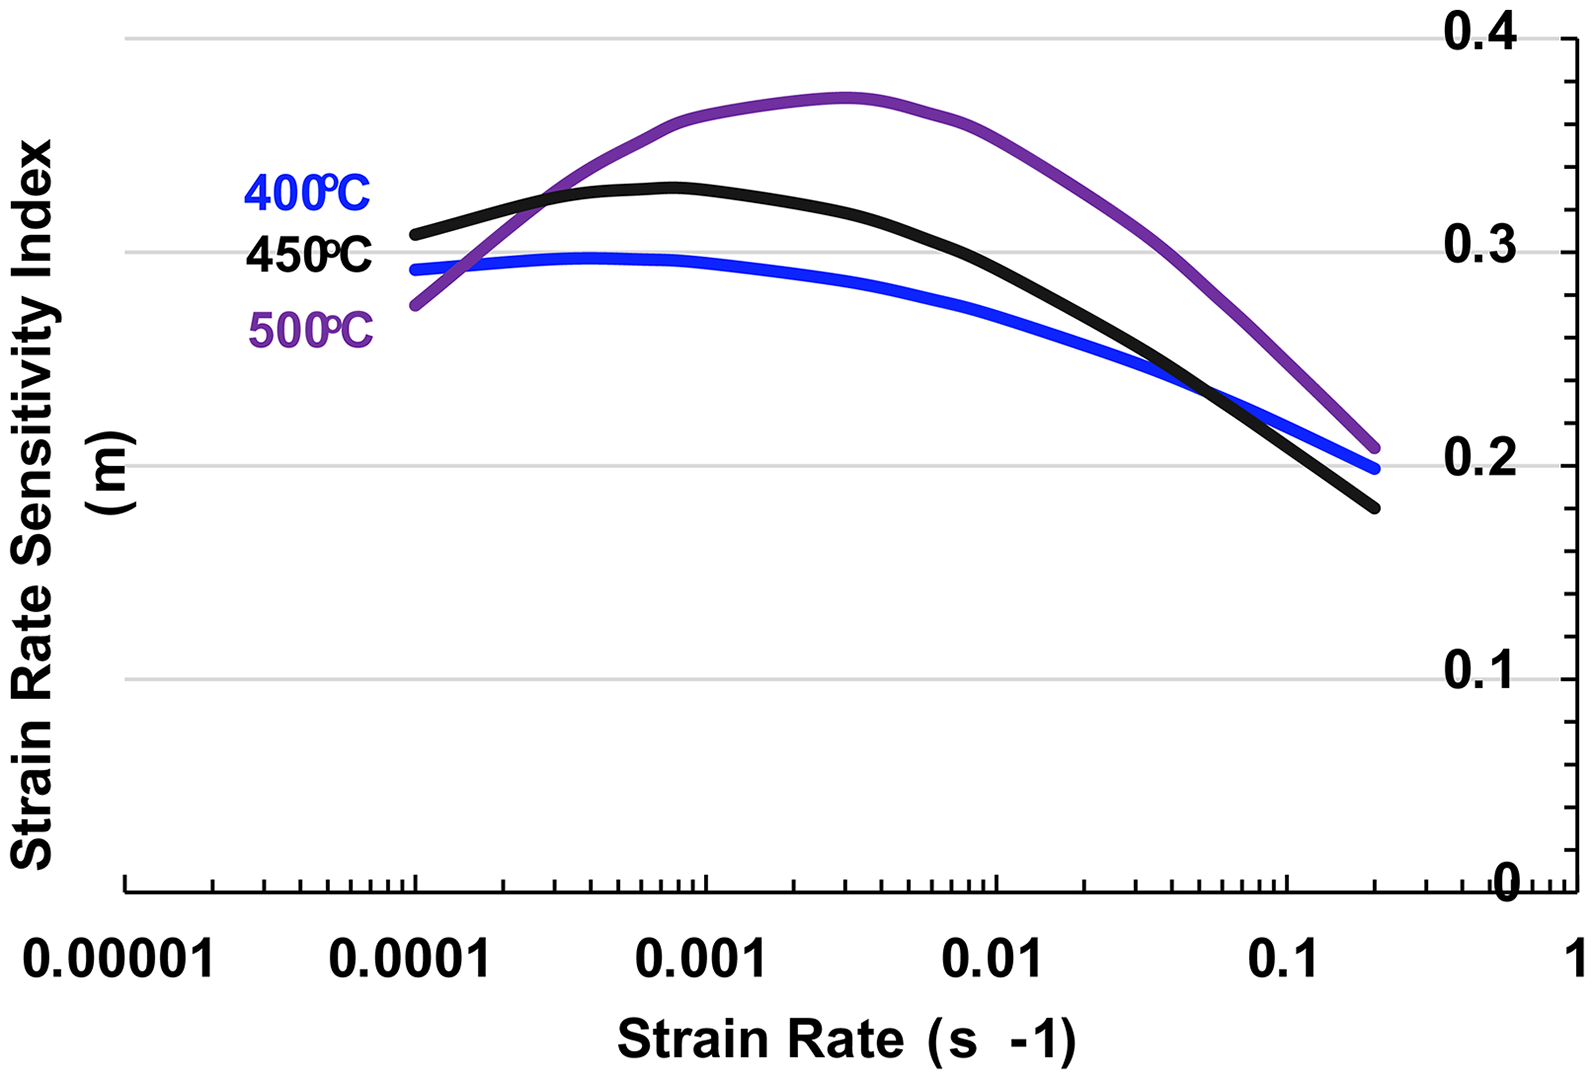
Strain rate sensitivity index calculated with the Smirnov material model at the three selected temperatures.
Deformation behaviour of AA5083
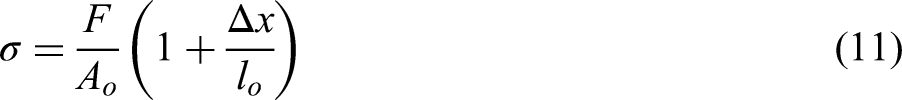
Considering that the viscous behaviour is effectively modelled (R2 > 99%), the constant velocity tests are used to model the hardening and softening behaviour. To comprehensively model the material behaviour, constant velocity tests were run at initial strain rates of 0.0005 s−1, 0.001 s−1, 0.01 s−1, 0.05 s−1 and 0.15 s−1. An important consideration when modelling constant velocity tests is the depreciation of the predicted strain rate. In all, three assumptions must be made for the strain, strain rate and stress in the tensile specimen as outlined in equations (10) to (12):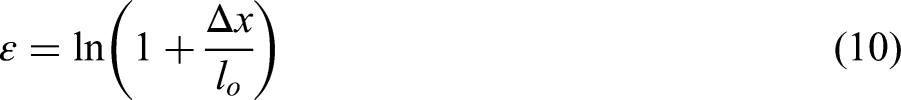

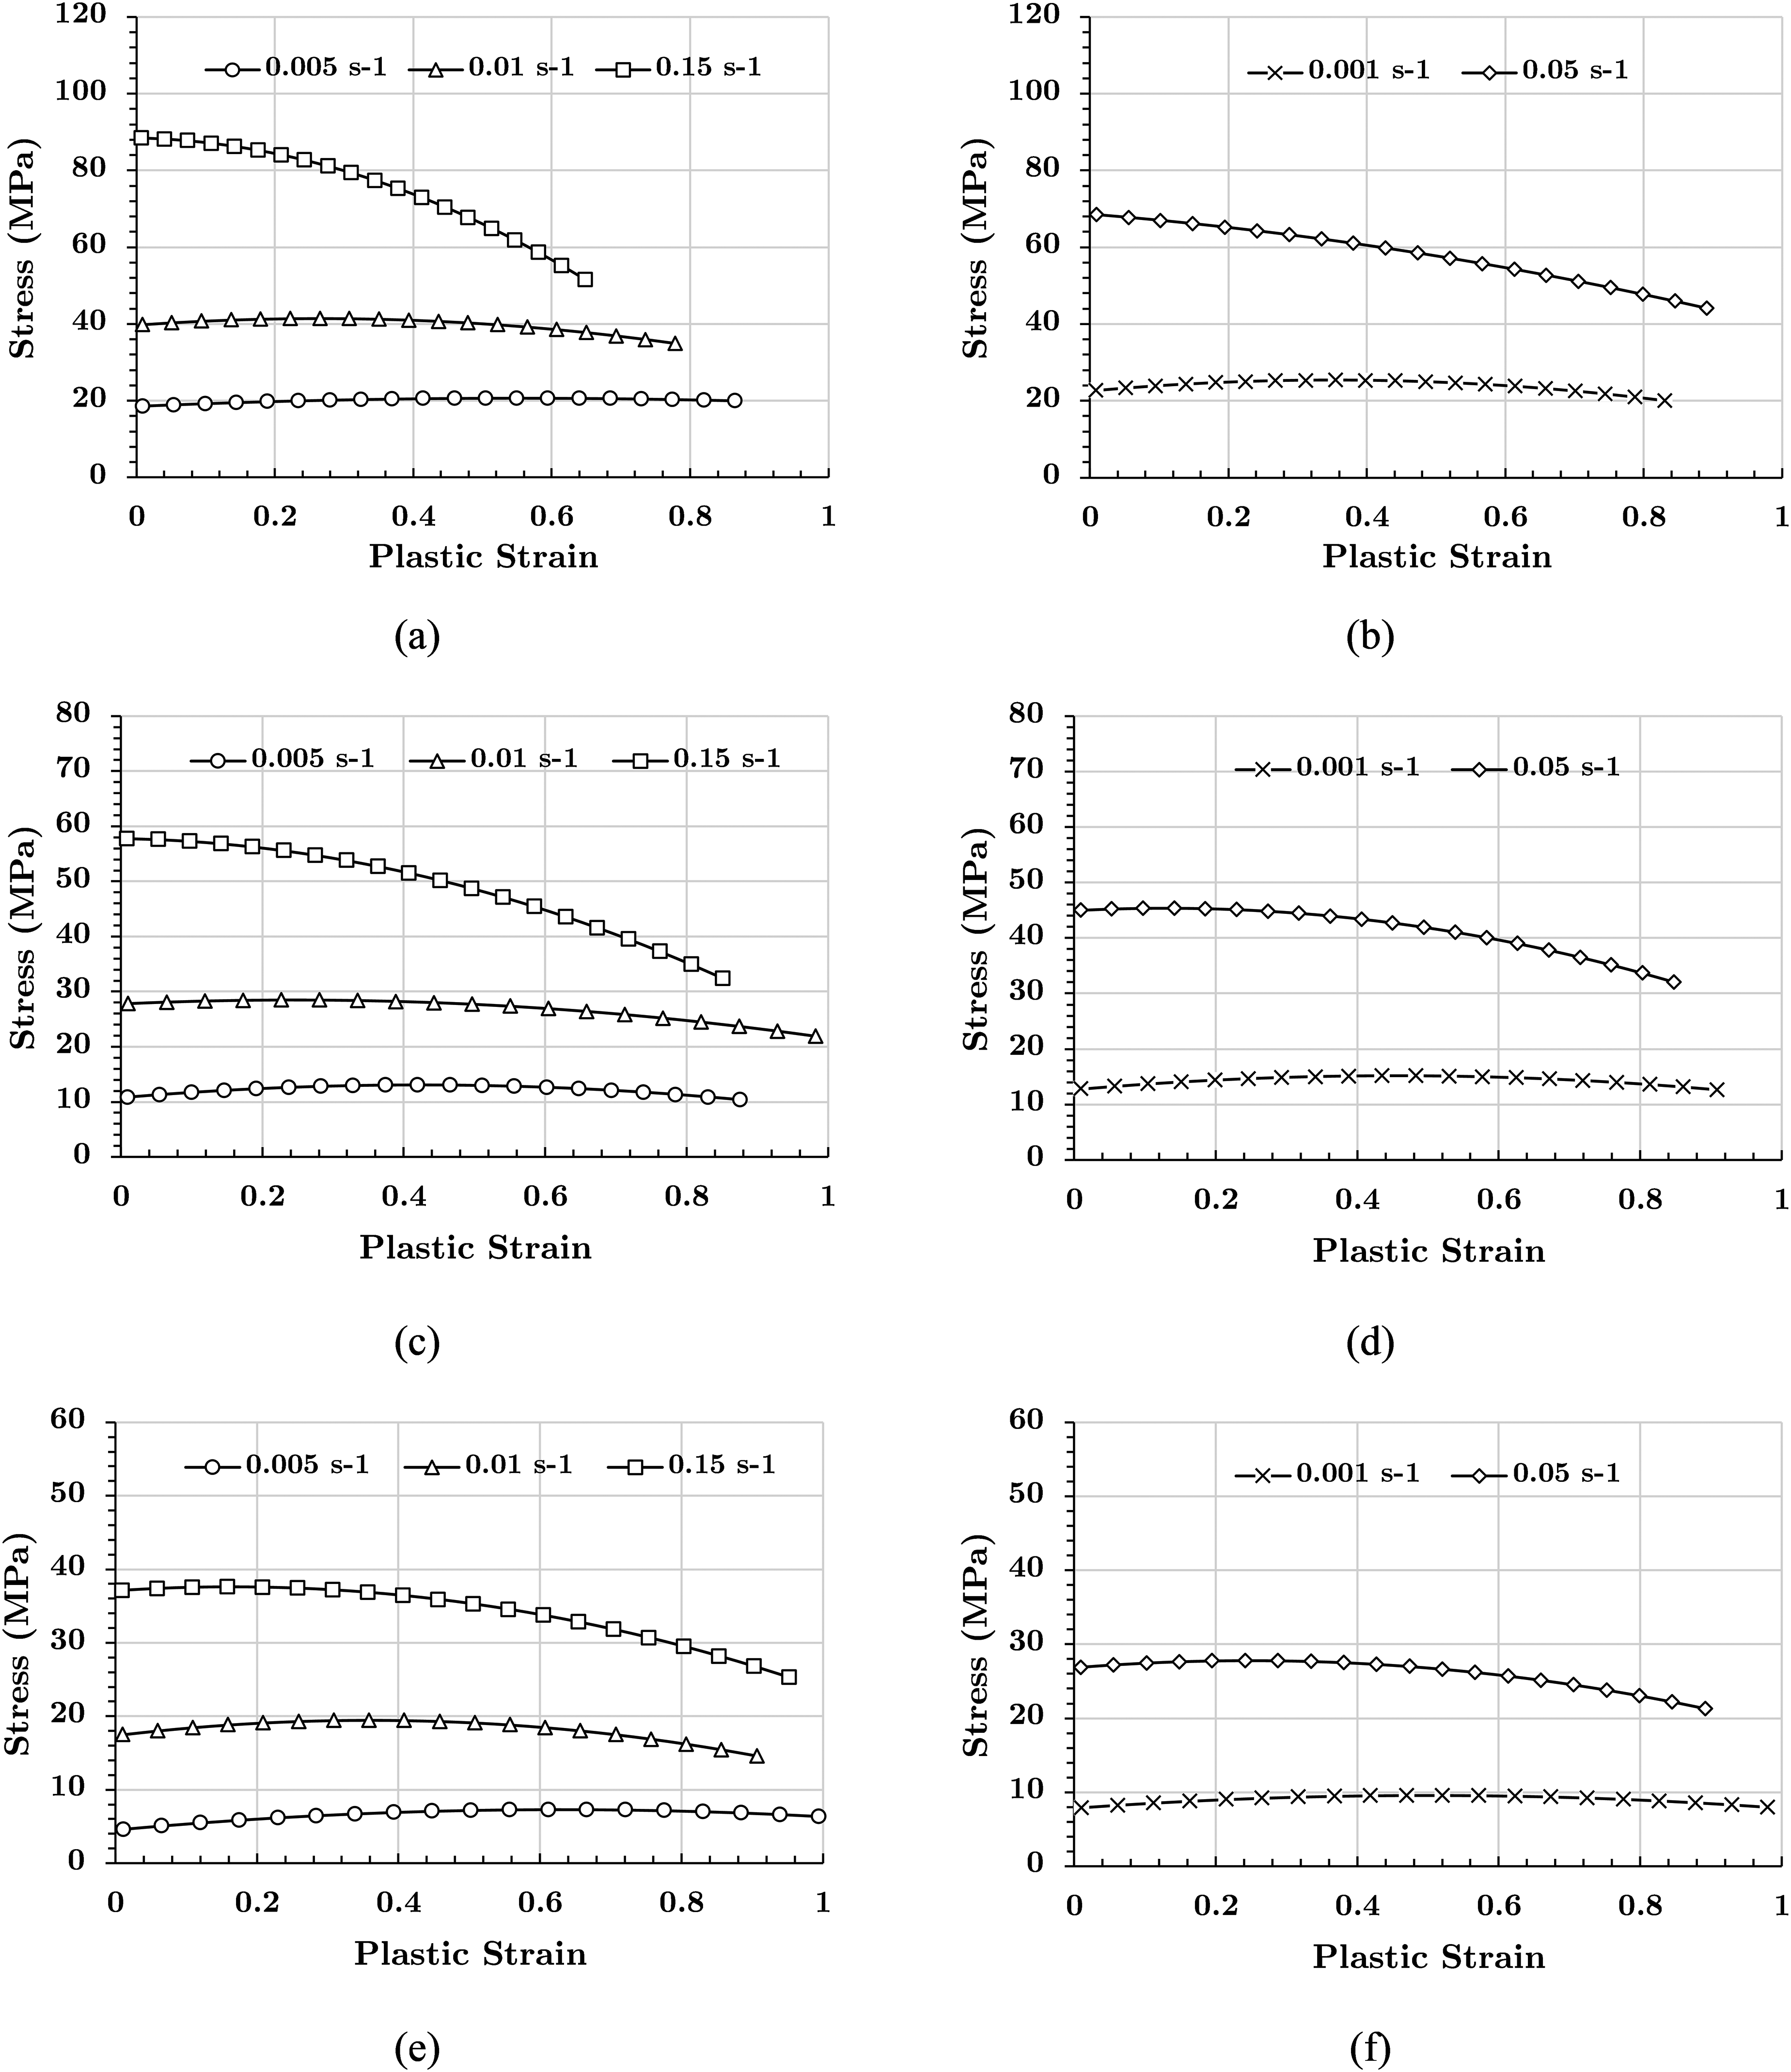
Tensile test results at constant crosshead velocity for temperatures of 400°C (a, b), 450°C (c, d), 500°C (e, f).
To model the strain hardening and softening behaviour it is important to consider the respective deformation mechanisms that operate during the hardening and the softening of the material. The primary mechanism responsible for hardening during high temperature or creep deformation is grain growth, both static and dynamic. As the grains elongate during deformation, the accommodation mechanisms required for grain boundary sliding become more difficult and thus the stress level increases. In contrast, superplastic materials can experience strain softening due to cavitation, dynamic recrystallization and dynamic dislocation recovery. 27
Traditional phenomenological models utilize a static surface-based modelling approach to model these deformation mechanisms (equations (5) to (7)). In contrast, physical based models typically use a rate formulation for accumulating hardening or softening (equations (1) to (2)) This study retains a phenomenological approach while incorporating the effects of strain rate history during deformation. This formulation is more appropriate for a forming process where different areas of the deforming sheet are deforming at different strain rates which also vary throughout the process. Additionally, indications in microstructural studies suggest that the rate of grain growth, cavitation and other hardening and softening mechanisms depends on the amount of hardening or softening accumulated to that point.
28
As a result, this study proposes the formulation of a hardening value, H, and a softening parameter, D, following the relationship outlined in equations (13) and (14):

For the accumulation of hardening within each time step a simple power law formulation was selected using equations (16) and (17):

Material constant bounds for hardening and softening behaviour of material at three selected temperatures.
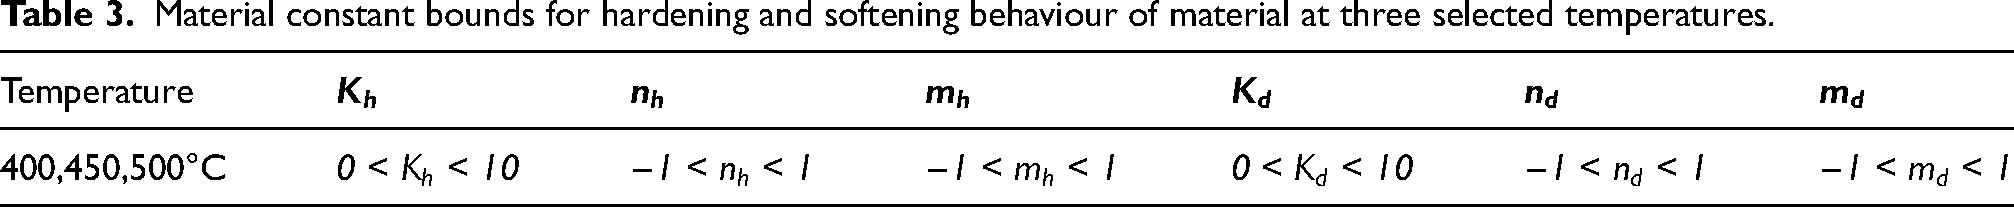
If desired, at least for the initial model fit, the constants can be further bound based on suggestions in literature. Cavitation, the primary source of softening specifically in aluminum alloys, can be assumed to occur more rapidly with increasing strain rate and increasing accumulated softening. This would imply the bounds
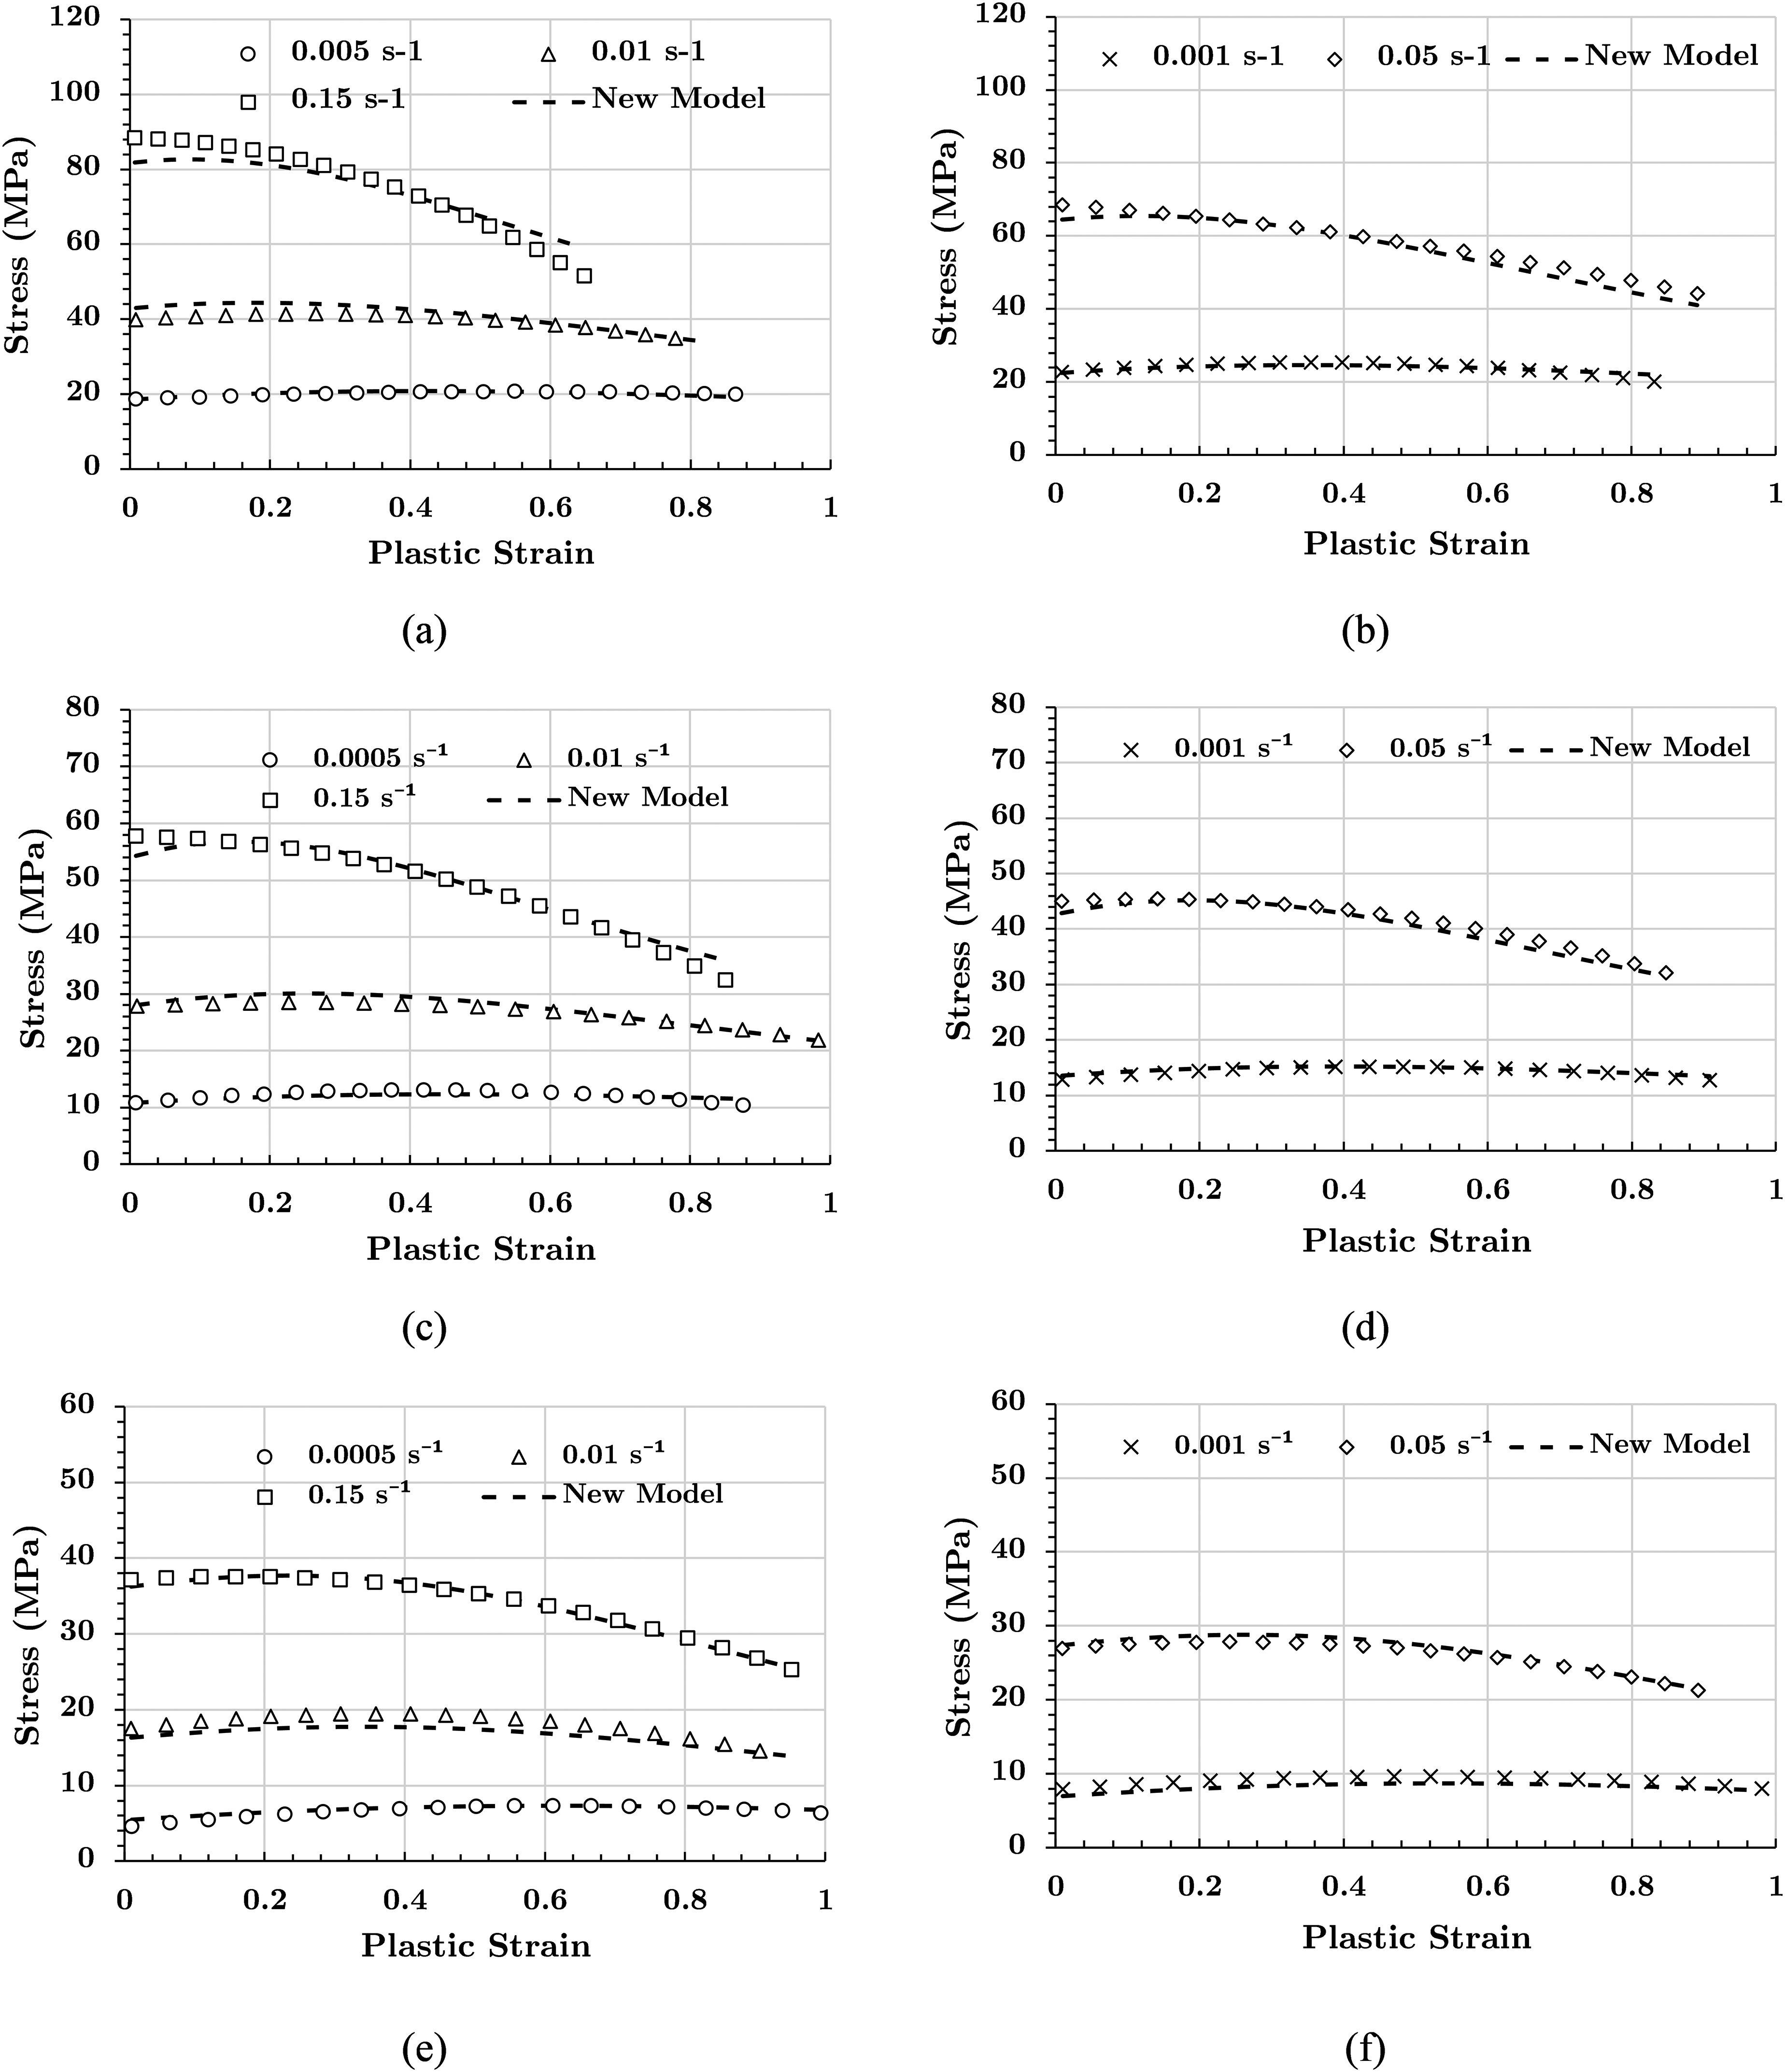
Fit of the proposed model for temperatures of 400°C (a, b), 450°C (c, d), 500°C (e, f).
The quality of the model fit is further evaluated and visualized in Figure 7.
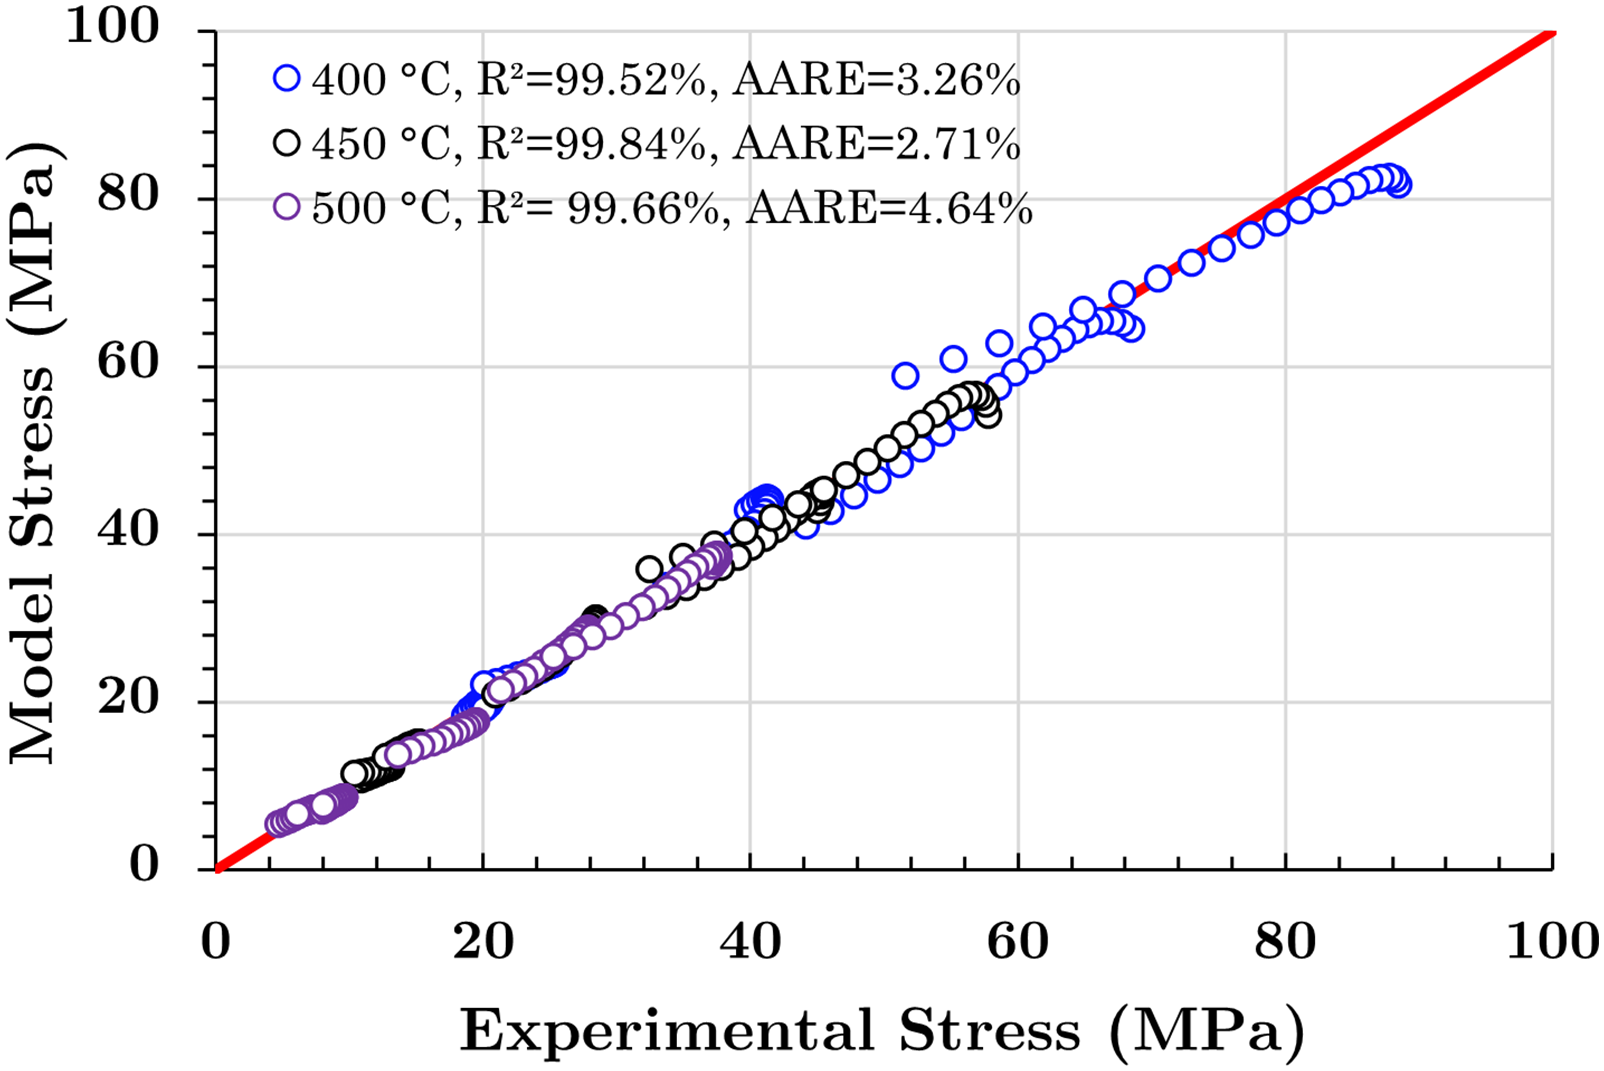
Quality of model fit for the three selected temperatures with accompanying optimal model fit line.
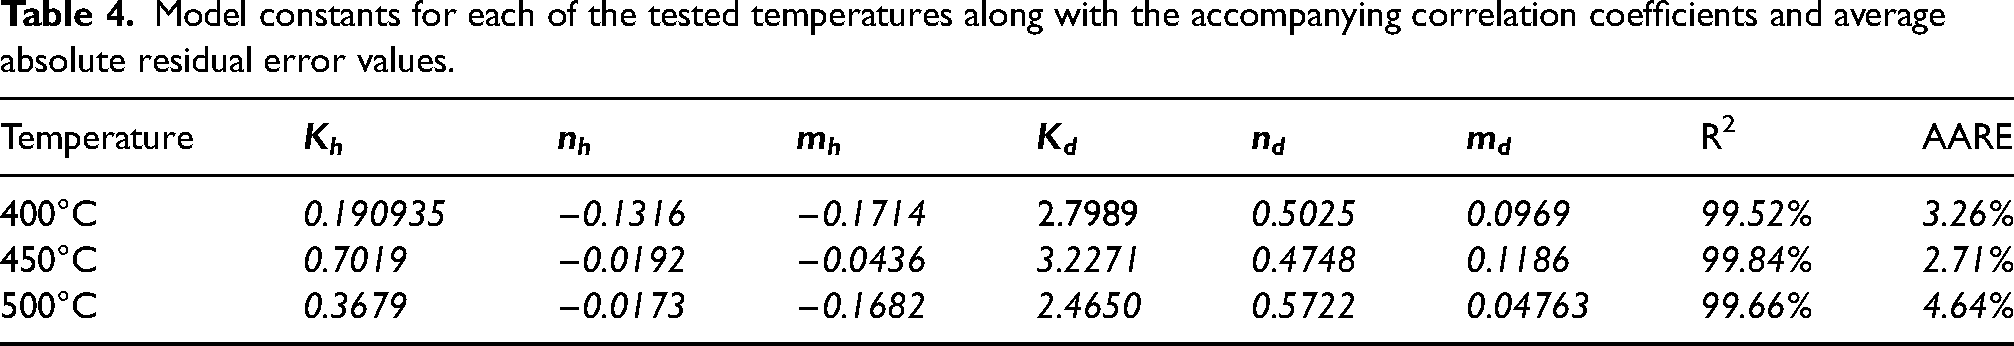
The resultant material parameters fit to the three separate test temperatures as well as the corresponding correlation coefficients, R2 and the average absolute relative errors (AARE) as detailed in equation (8) are shown in Table 4.
Model constants for each of the tested temperatures along with the accompanying correlation coefficients and average absolute residual error values.
In all, the developed model correlates well with experimental data for a wide range of strain rates. The strong correlation and diverse nature of the constructed model indicates its applicability to high temperature forming whether superplastic forming (
Tensile test simulations
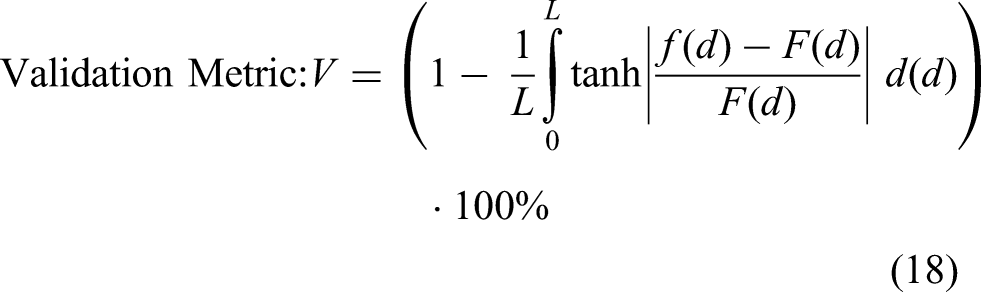
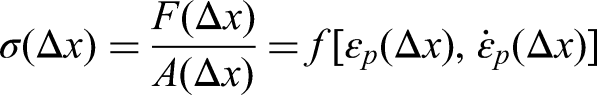
Work done by Aksenov and Mikolaenko has further elucidated the discrepancy between the projected stress behaviour as predicted by equations (10) to (12) and the actual material behaviour.29,30 Therefore, the accuracy of the developed model will more appropriately be determined using the force and displacement data recorded from the tensile tests. Doing this removes the requirement to undertake the uniform stress, strain and strain rate assumption. Accuracy will be quantified using the validation metric as developed by Oberkampf and Roy:
31
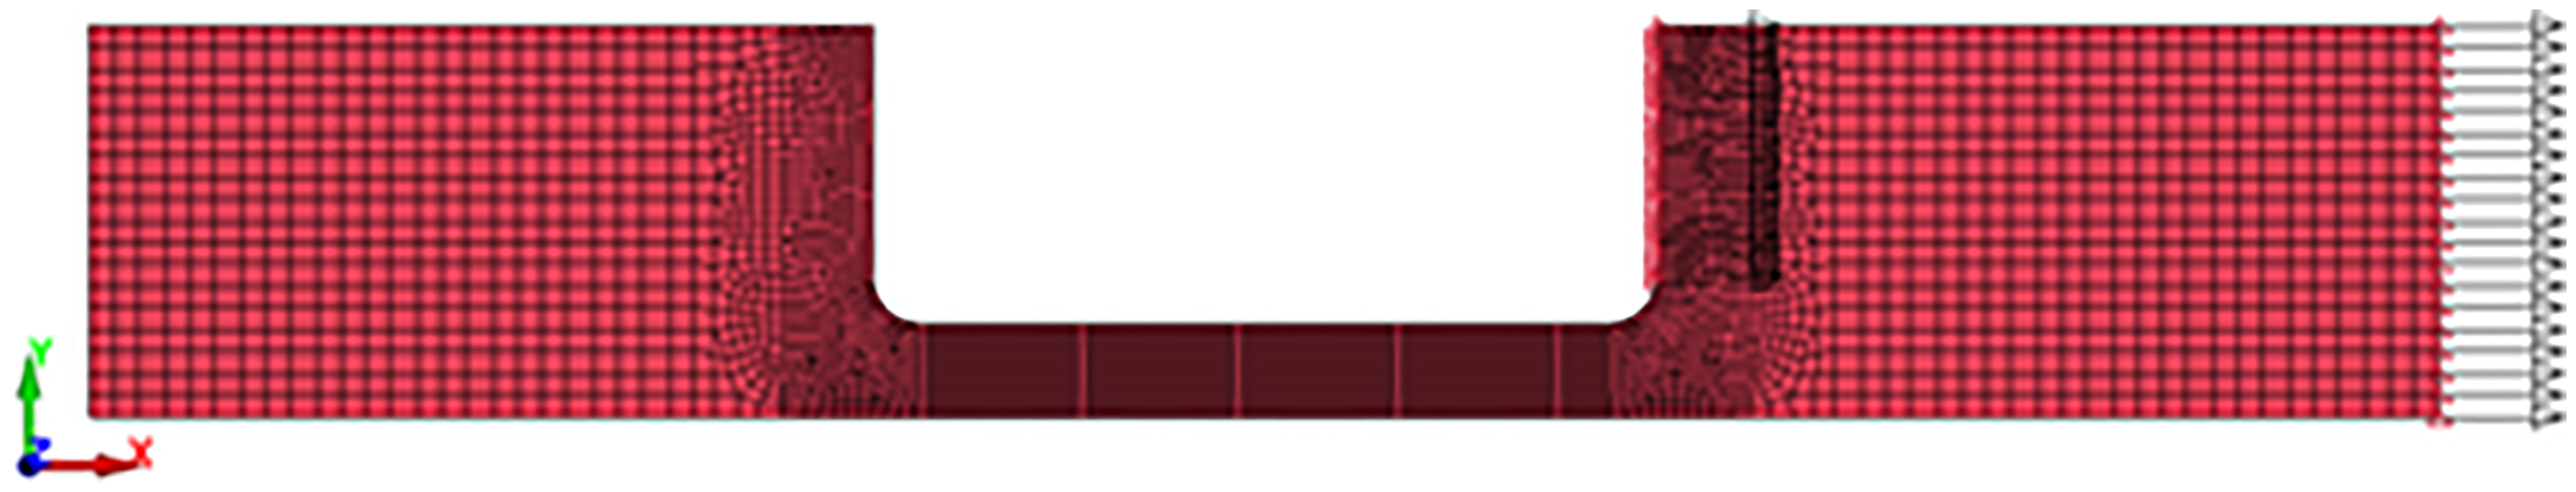
Tensile test model with symmetry applied in the x-z plane and appropriate boundary constraints.
It is important to note that in the absence of a contact interaction between the translating holder and the deforming sample a boundary condition was applied to the top (right) and bottom (left) of the sample to induce the required deformation. This assumption is valid due to the holder being rigid, only being in contact with the flat portion of the grip and the friction behaviour having a negligible impact on the results. Additionally, symmetry is applied in the width direction; the x-z plane since no material flows in the y-direction at the midplane. Also, in contrast to some suggestions in literature, symmetry is not applied in the y-z plane. This is due to the simulations continuing to the onset of necking and therefore any dynamic effects in this plane ought not to be ignored. The geometry of the specimen is discretized with 0.13 mm by 0.25 mm plane stress shell elements within the gauge, with a total of 4454 elements in the entire specimen based on the completed mesh sensitivity study. In LS-DYNA, “shell elements” refer to thin, layered elements capable of capturing through-thickness behavior in 2D representations. The mesh was particularly selected ensuring all simulations adhere to the conservation of energy, minimize hour glassing and extreme aspect ratios. The shell thickness is set to 1.4 mm, and fully integrated shell elements, shell element formulation 16 within LS-DYNA, 32 with five integration points through thickness are used. No mass or time scaling was used in any of the numerical simulations as an implicit time integration scheme was used.
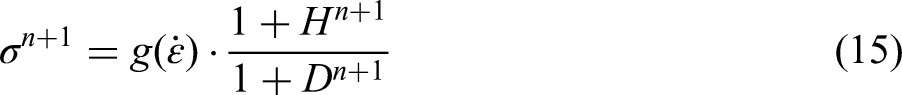
The material model is implemented using LS-DYNA's user material subroutine for the computation of the stress tensor. A strain-rate sensitive hardening law is introduced within the standard von Mises (J2) elasto-plasticity framework, without modifying the elastic or yield components. While the model formulation expresses stress in terms of an effective yield function, it is fully compatible with multi-dimensional finite element simulations through the von Mises plasticity framework. Stress components are updated via a radial return plasticity algorithm, ensuring consistency with multi-axial loading conditions. 33 This implementation allows the model to maintain validity in 2D/3D simulations despite its strain-rate-dependent nature. Additionally, at superplastic or high temperatures, anisotropy is approximately negligible, meaning that the fundamental assumptions of the model remain appropriate for material characterization in this regime. 34
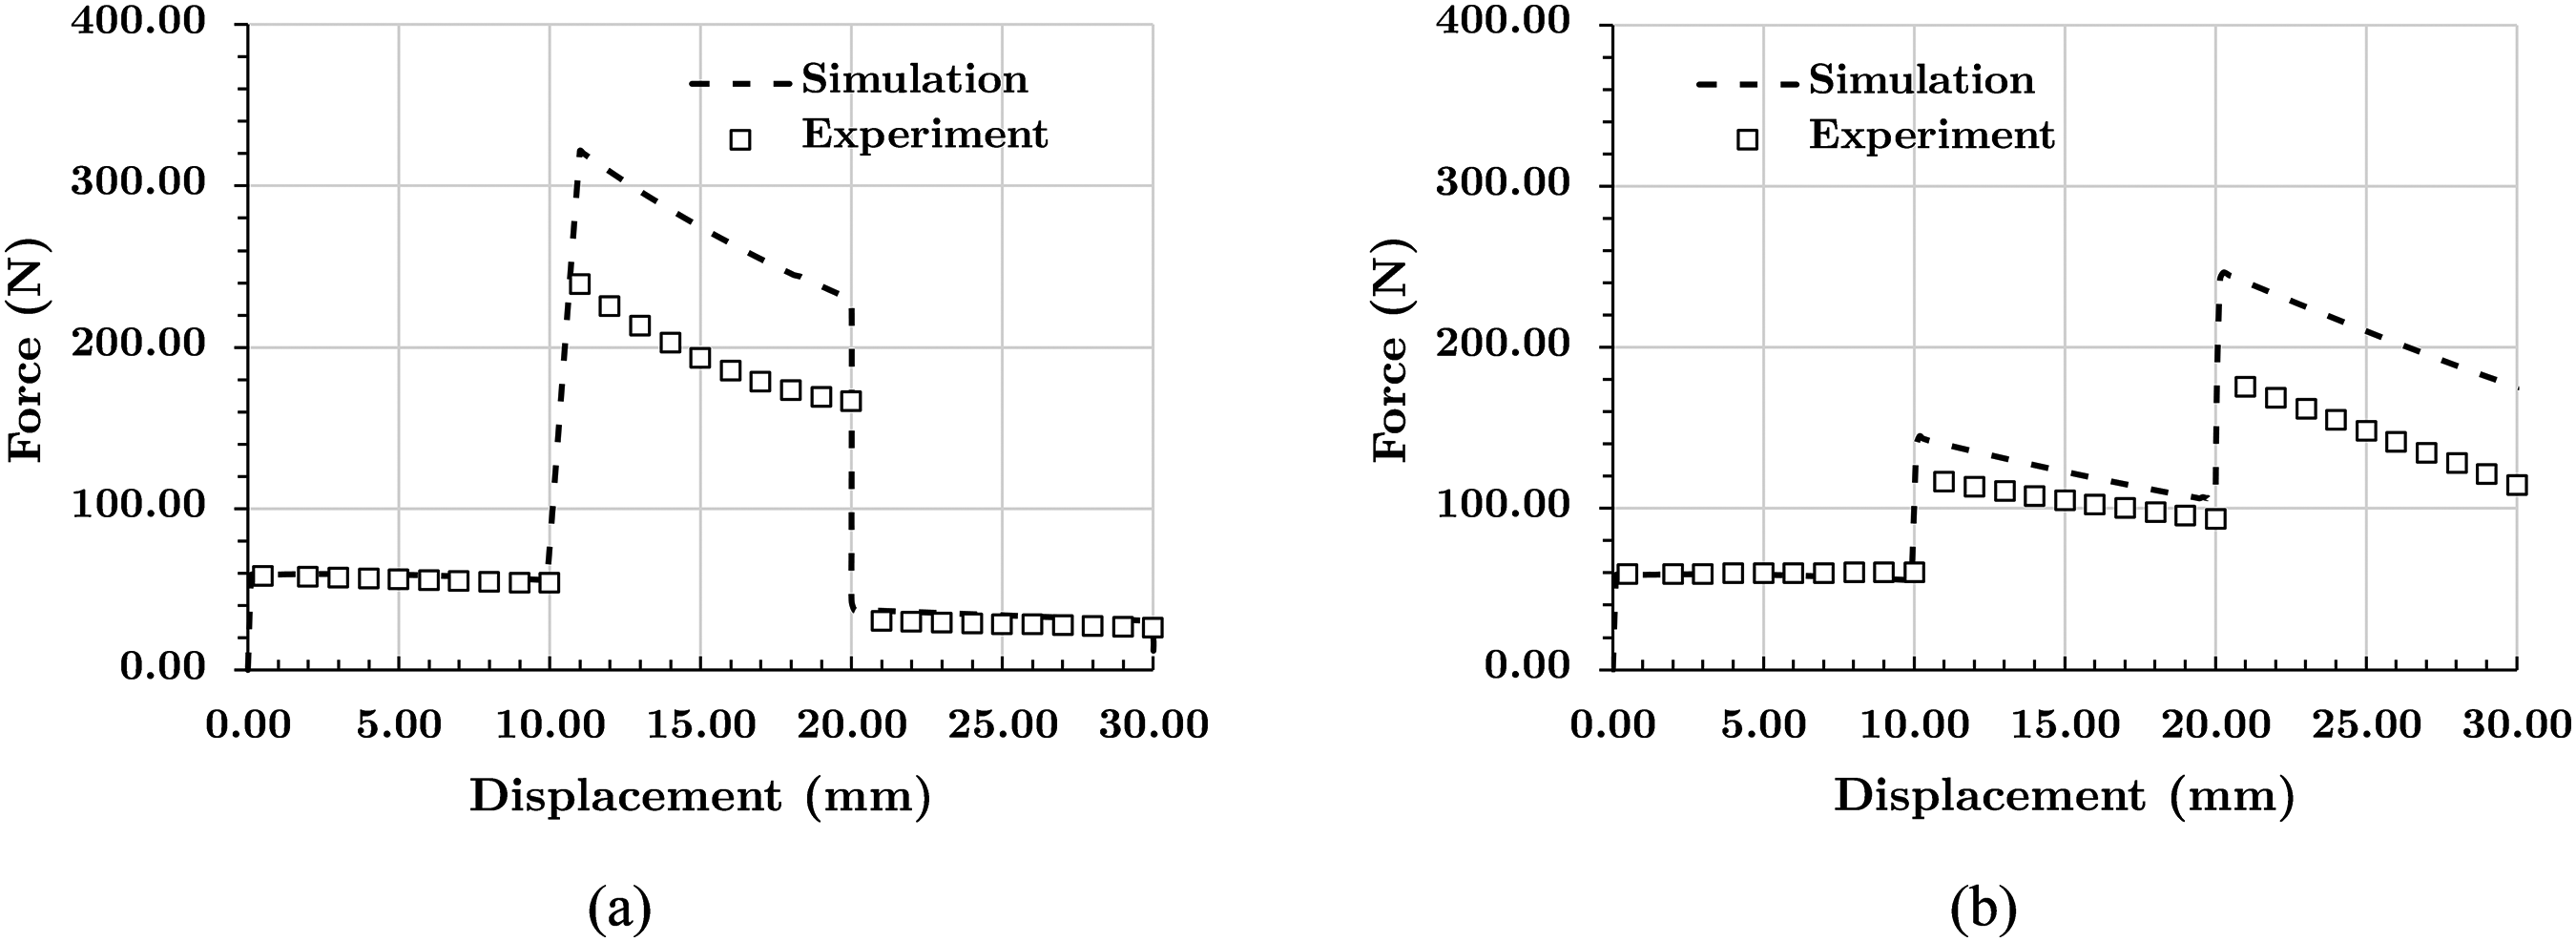
The force, to be compared to the load cell readings from the experiments, was computed and output using LS-DYNA's ASCII bndout file. Similarly, the crosshead displacement, which was compared to experimental data, was output in the nodout file, with the history of a node on the grip region on the right side of the sample used for analysis. To allow for efficient and effective data collection and analysis, the Python module lasso-dyna was used. This allowed for the collection and processing of binout and d3plot files directly from dyna to python. In summary, to reassess the accuracy of the model the predicted force/displacement responses are compared with the corresponding experimental counterparts and these results are shown in Figure 9.
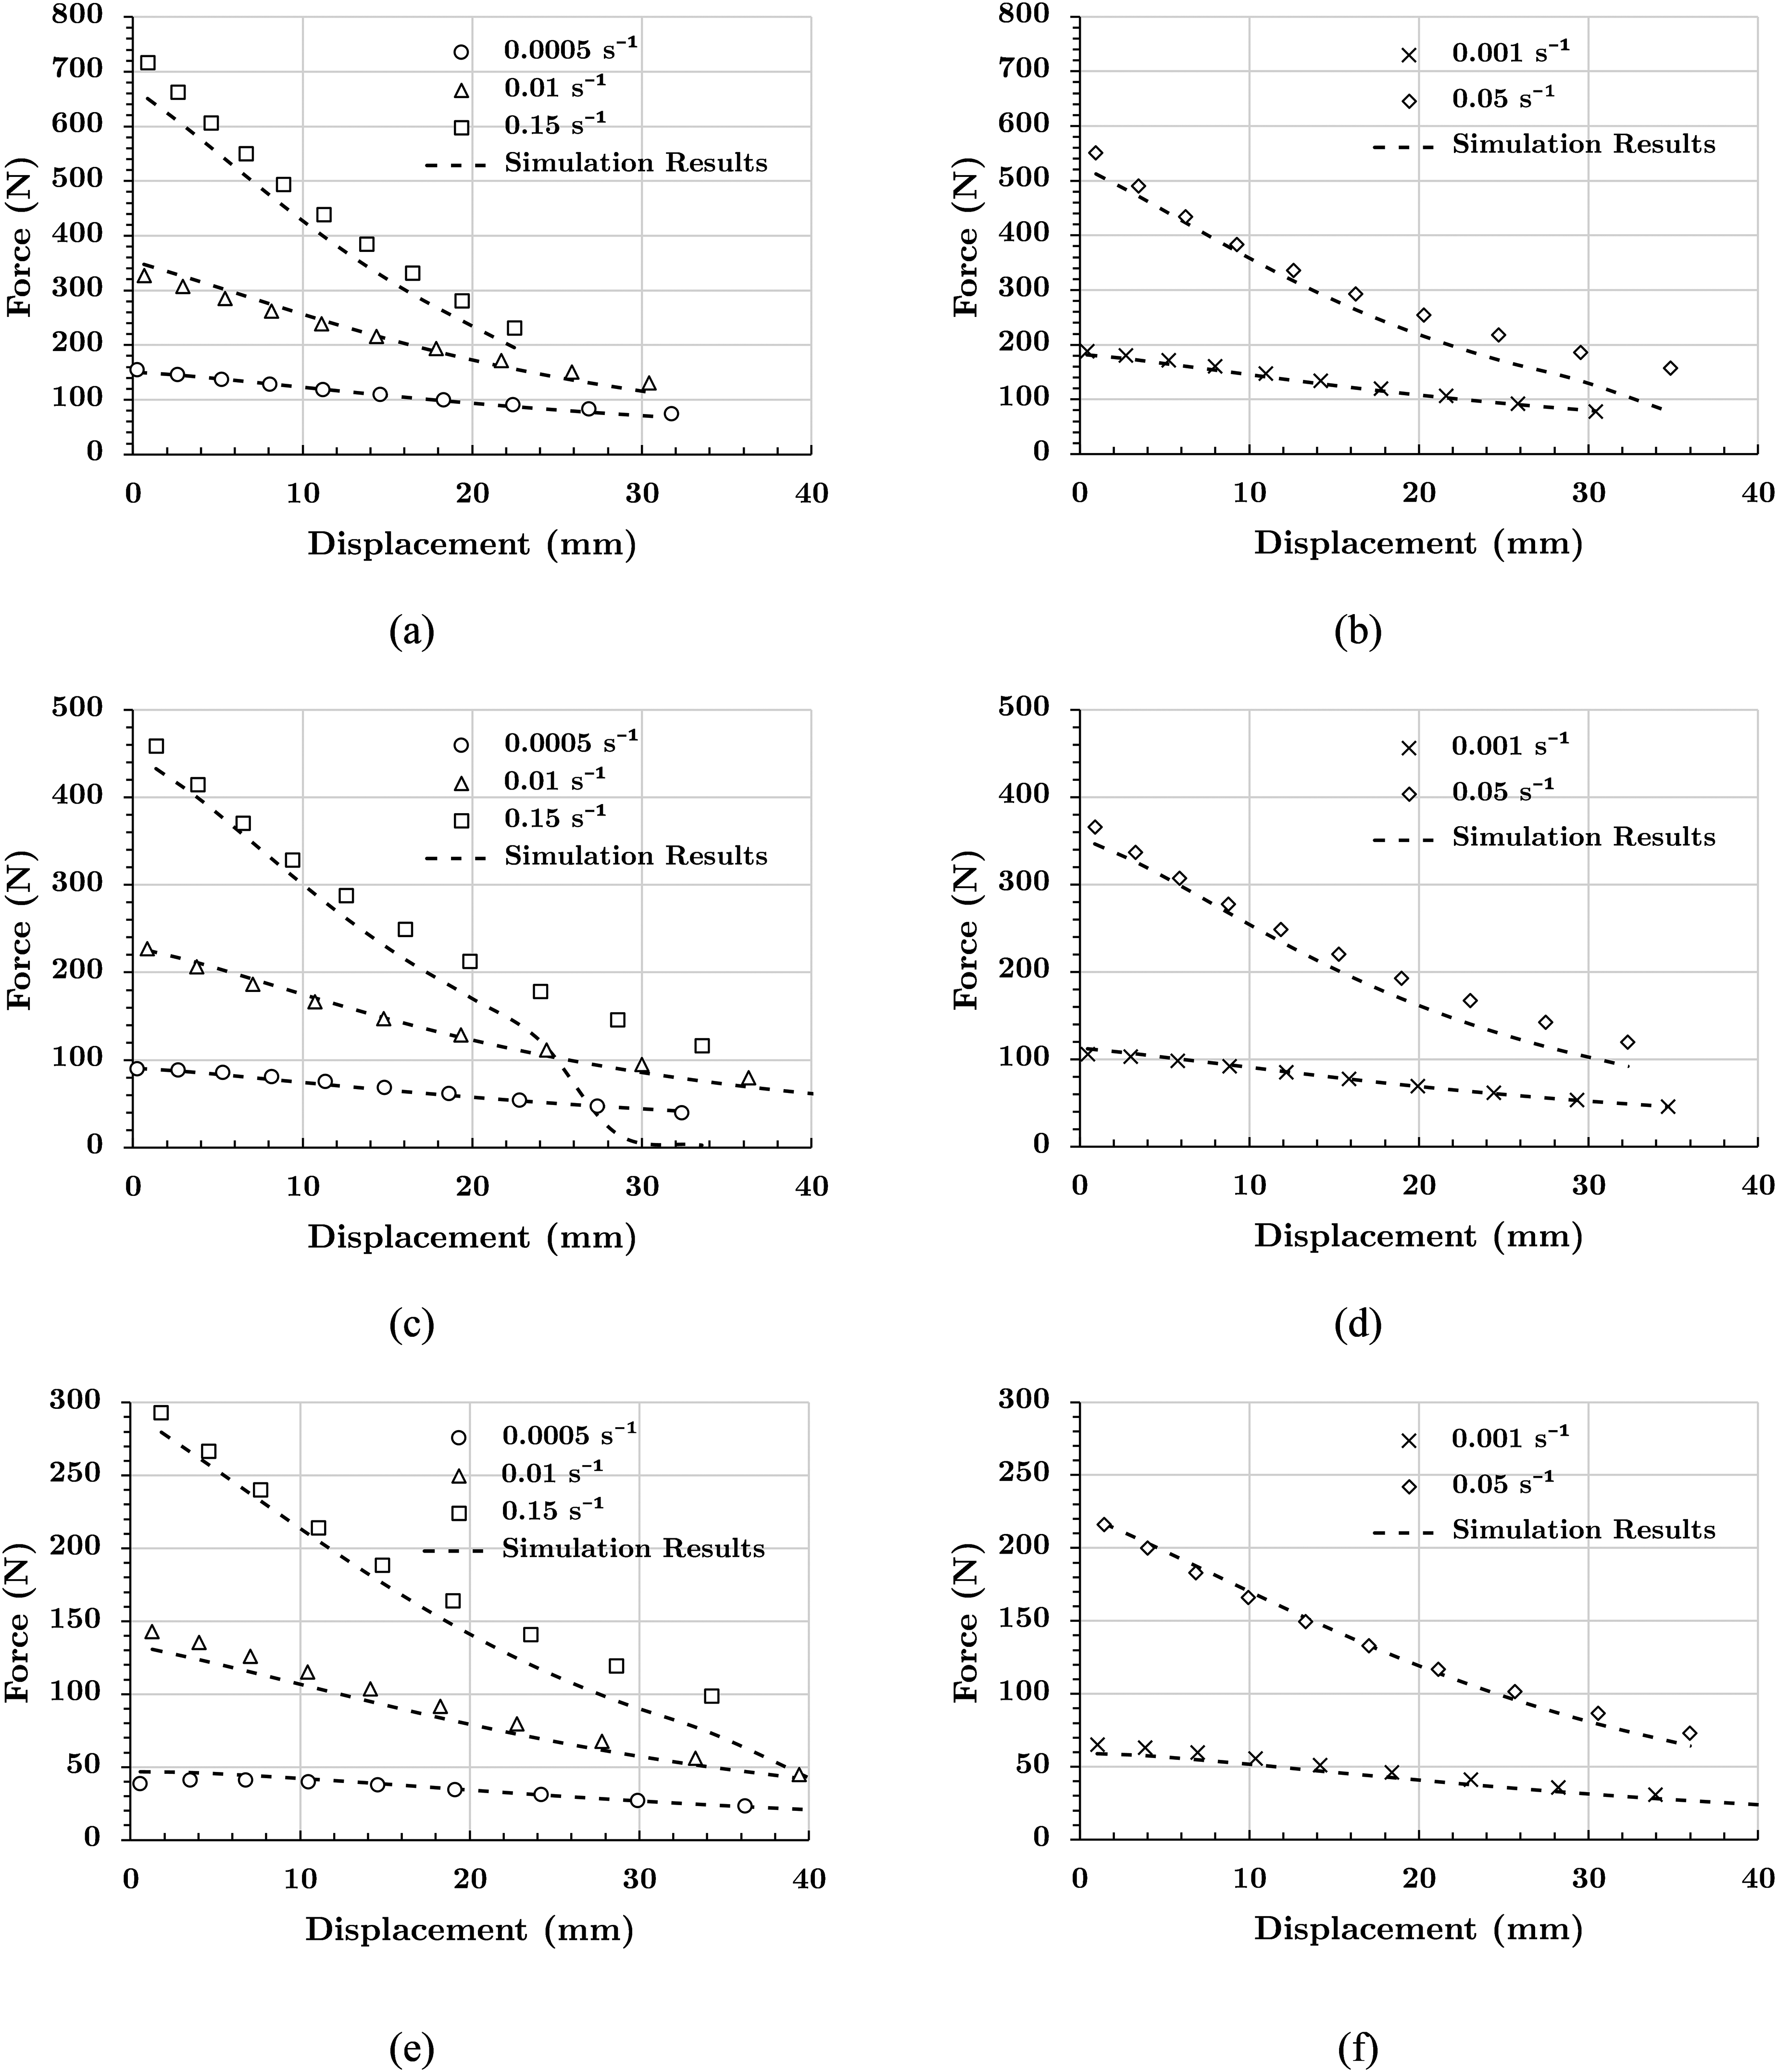
Fit of the proposed model for temperatures of 400°C (a, b), 450°C (c, d), 500°C (e, f).
The validation metrics for each of the predicted strain rates and temperatures in Figure 8 are shown in Table 5. It needs to be considered that when F(d) equals zero the integral in equation (18) becomes undefined, therefore these points are removed, which would significantly skew the validation metric in these cases. Additionally, the simulations were verified to adhere to the conservation of energy principles throughout the deformation. This was achieved by monitoring the energy balance and confirming the model accurately reflects the true physical behaviour of the system.
Validation metrics for force/displacement behaviour of tensile test simulations at varying strain rates and temperatures.
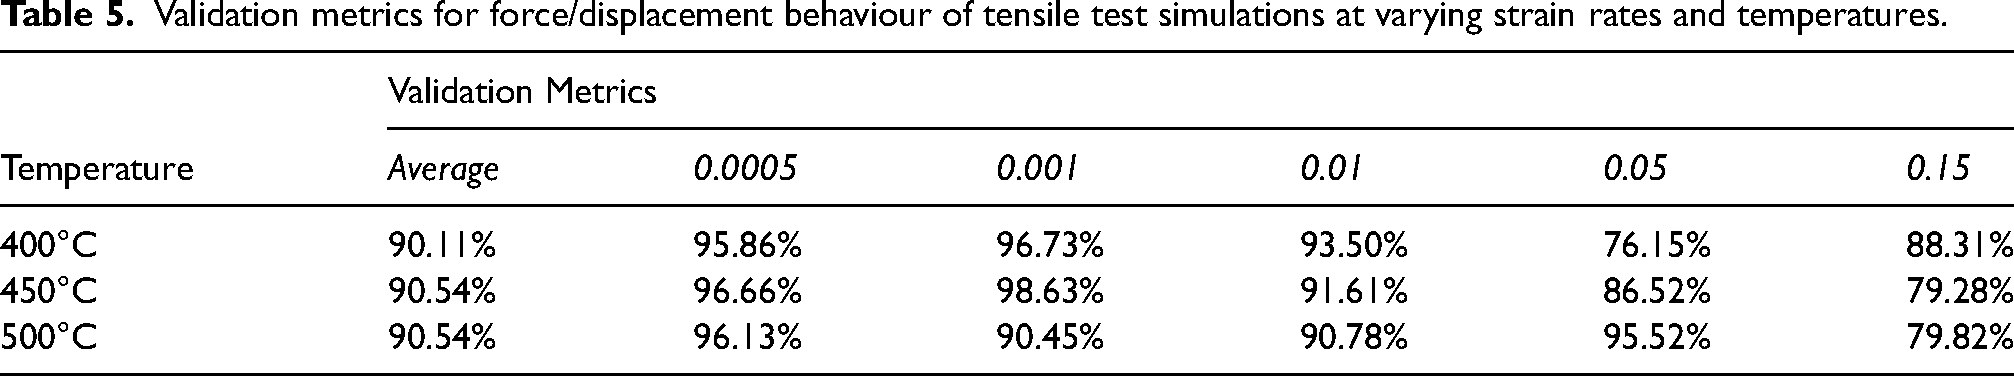
Qualitatively assessing the results in Figure 9 and quantitatively assessing the same results in Table 5, the model is shown to perform very well although it loses accuracy at elevated strain rates. This is seen particularly at 400°C as two of the five tensile test simulations have validation metrics below 90%. The loss of accuracy at elevated strain rates is due to the simulation exhibiting extreme localized necking resulting in the loss of the force bearing capacity of the sample. This shows the inaccuracy of the uniform deformation assumption particularly at strain rates and temperatures with reduced formability. Indeed, the completed tensile test specimens shown in Figure 10 demonstrate that at elevated strain rates the gauge section deforms non uniformly, with fracture occurring at a section where the strain localized most.
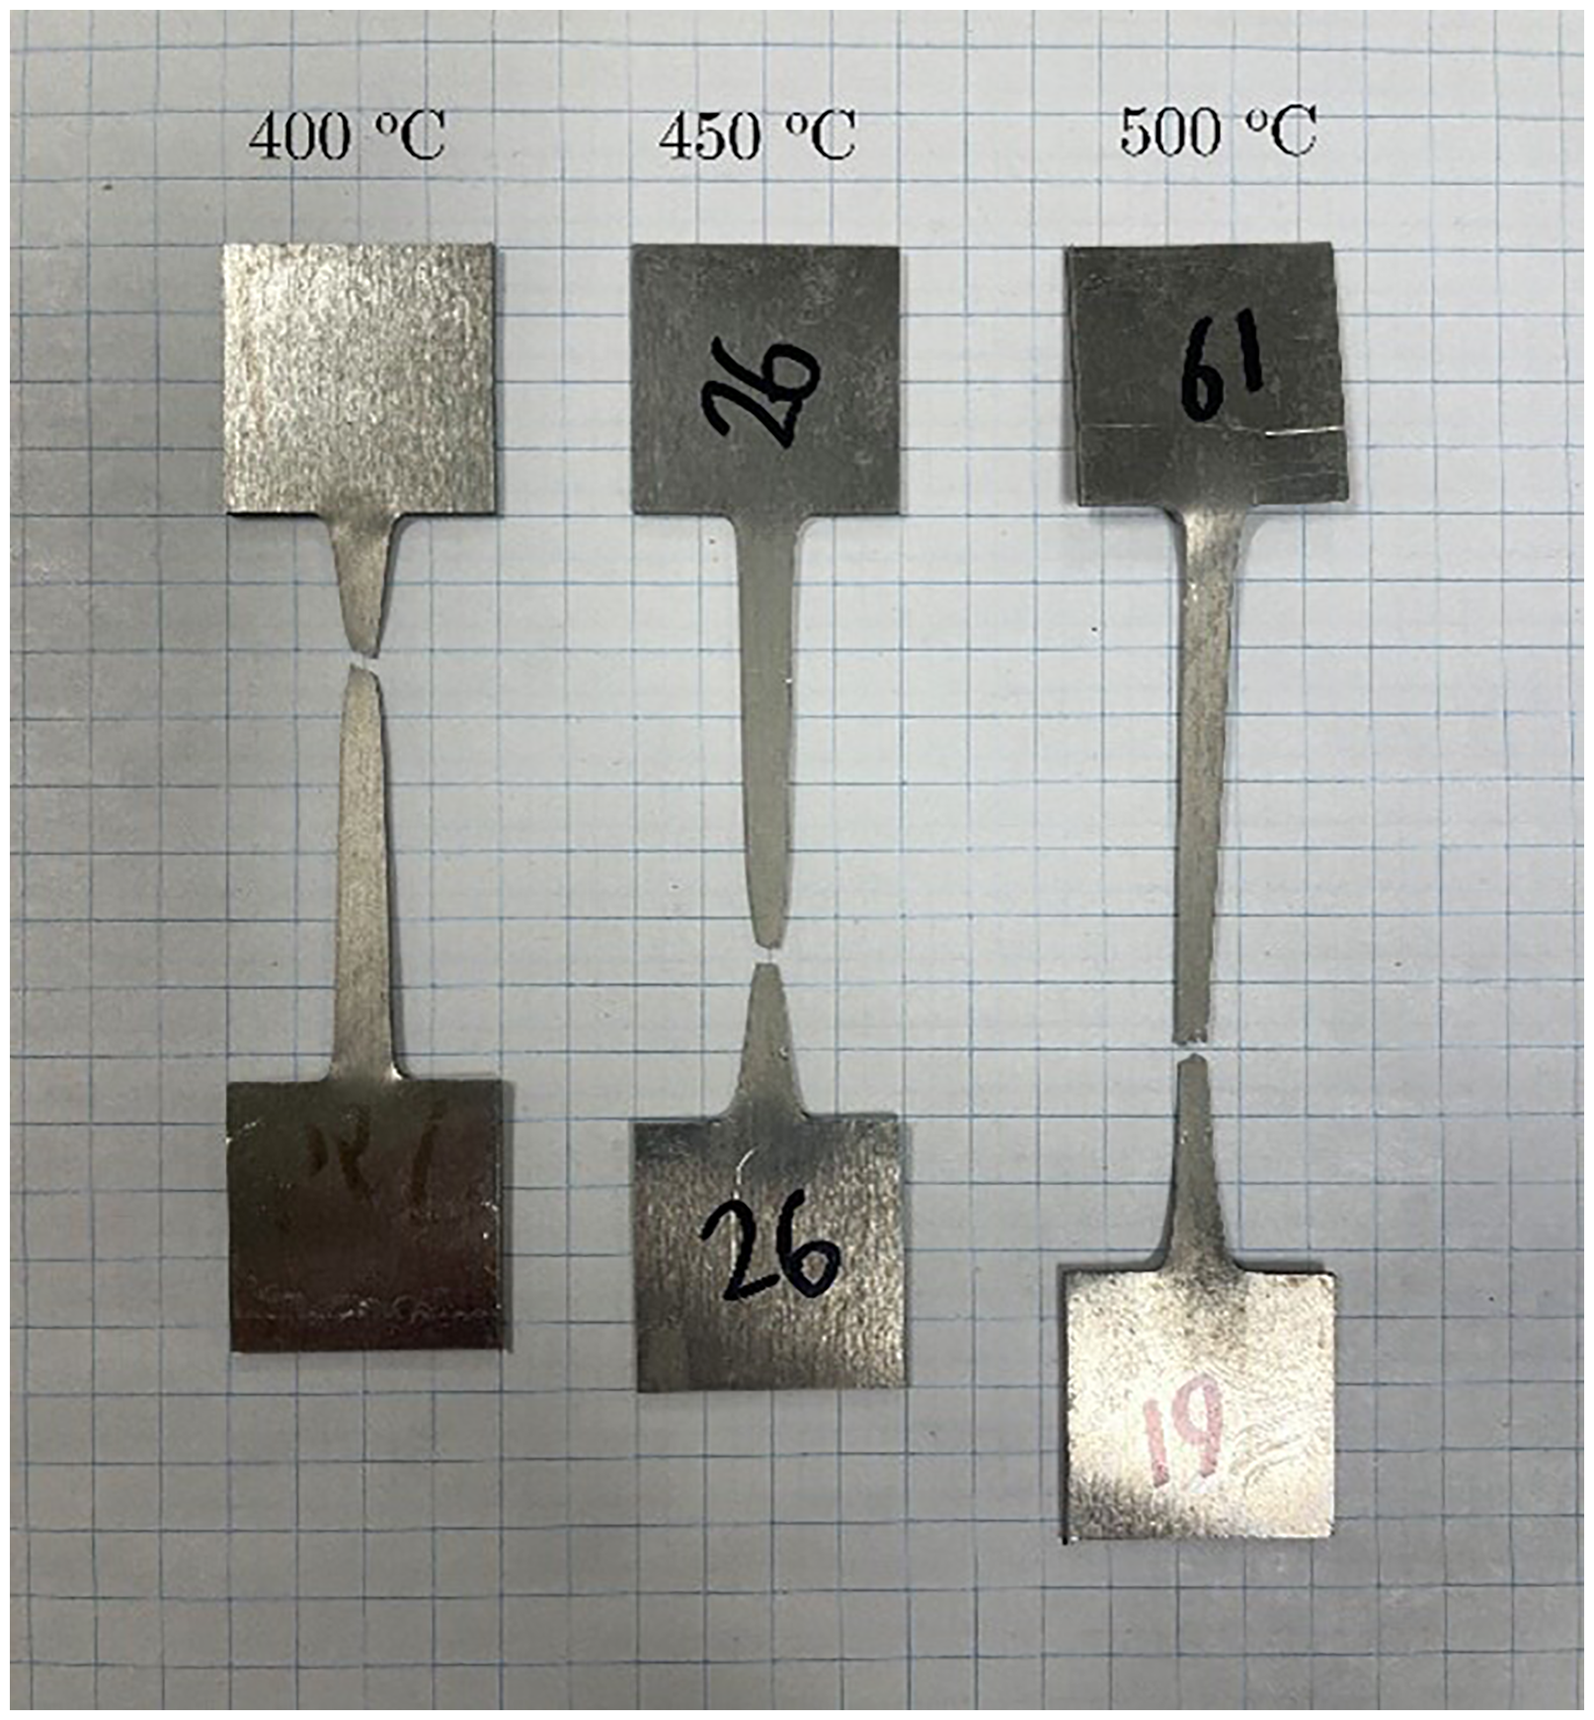
Tensile specimens from tests completed at an initial strain rate of 0.15 s−1 (V = 3.75 mm/s) for three different temperatures.
Therefore, to model the material behaviour more accurately the uniform deformation assumption was eliminated. In the absence of resources such as an etched sample pattern or Digital Image Correlation (DIC) strain readings, this will be done utilising an inverse FEA analysis approach, as developed and outlined in the following section.
Numerical analysis for model calibration
Recognizing the resultant inaccuracy of the uniform strain assumption, in situ strain and stress readings are more desirable to calibrate the material model. As mentioned, due to the nature of the completed tests, in situ strain measurements such as DIC cannot be used, and so the correlation between displacement and strain must be done with post-test numerical analysis. Previous work has been done to account for this limitation through inverse and iterative model procedures to model the high temperature deformation of superplastic or near superplastic materials.30,35 In this section, a new model calibration procedure is proposed to be coupled with the generated material model accounting for the true plastic strain, strain rate and stress. Plastic strain (
For the sake of easily correlating to experimental data, all the important variables are plotted with respect to the independent variable of the crosshead displacement. The simulation and model results for each processing method are shown in Figure 11.
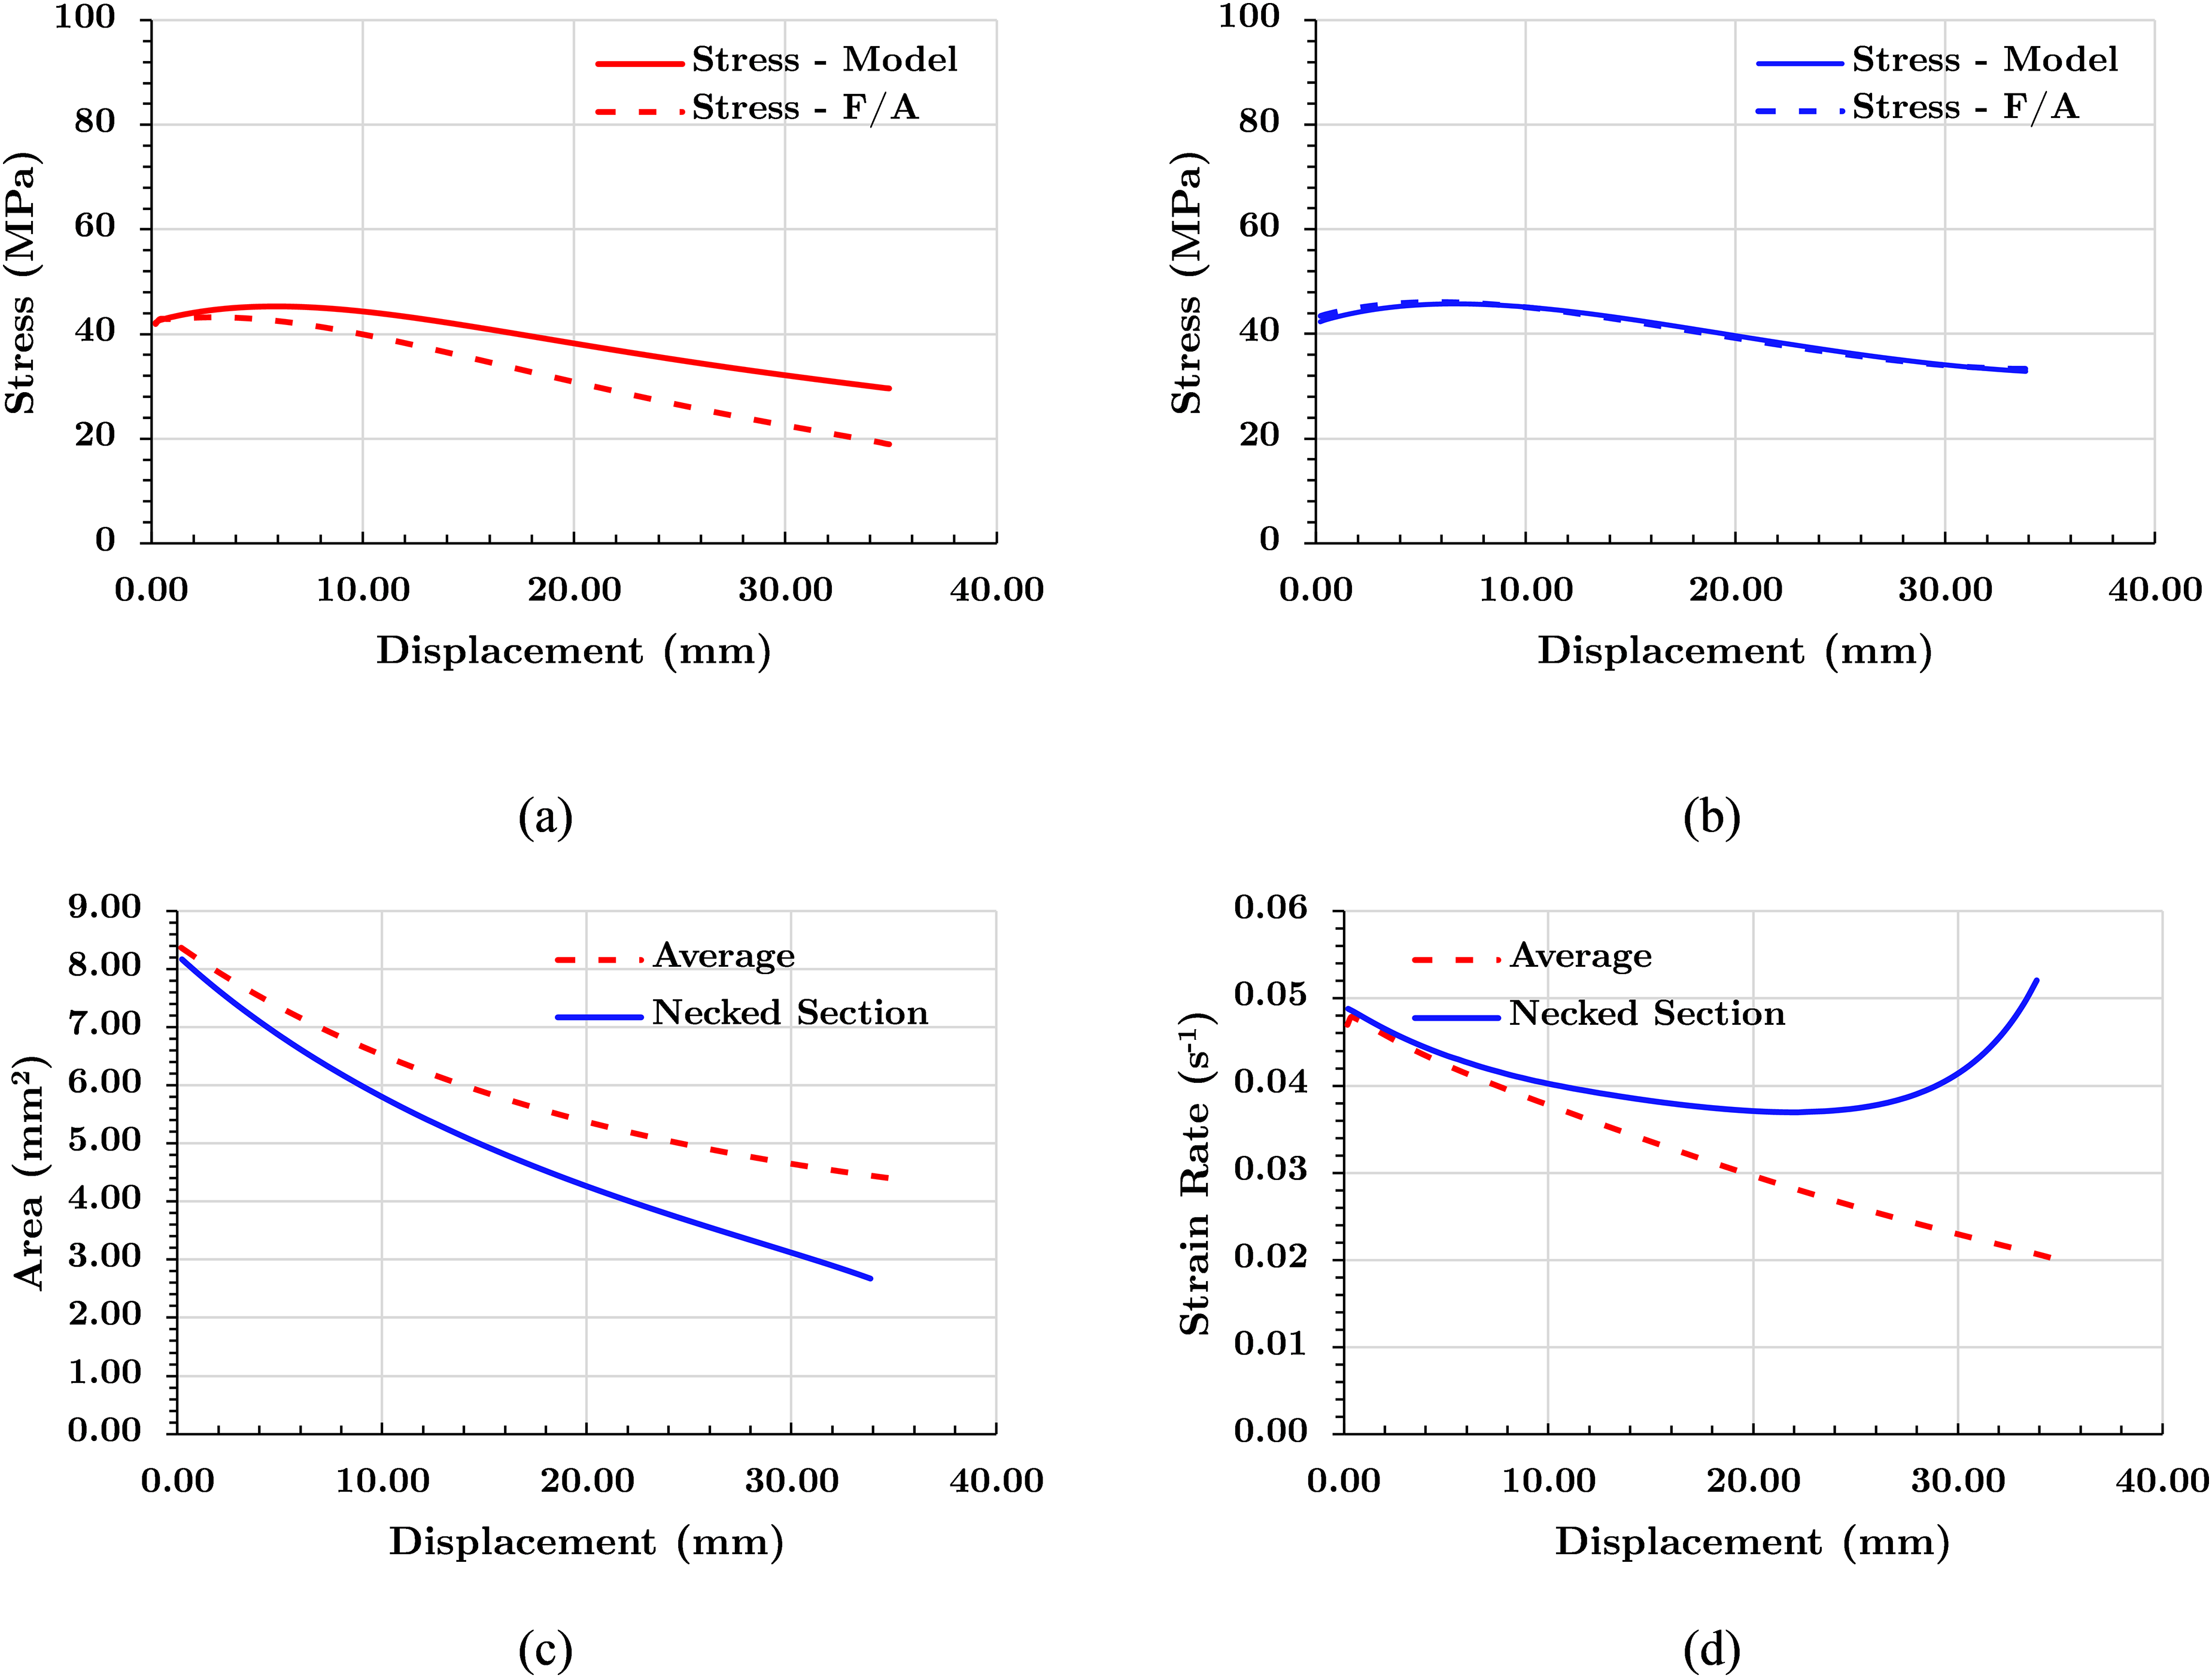
Comparison of results for stress predicted by model and F/A for a simulation of tensile test at 0.05 s−1 and 450°C for the average of the gauge elements (a) and the average of elements at the necked region (b). The comparison of the gauge area for the selected elements (c) and the average of the plastic strain rate for the elements (d).
As shown in Figures 11(a) and 10(b) the elements at the neck section are more effectively correlated to the resultant force/displacement behaviour when compared to an entire gauge average. The AARE for the average and the necked section are 22.86 and 0.99% respectively. The reason for the discrepancy in the results is shown in Figures 11(c) and 10(d) showing that strain begins to localize at a region in the gauge section shown by a sharp increase in strain rate and a significant reduction in cross-sectional area.
Now with the ability to correlate the output of the model to the results of the simulation a process for adjusting the model parameters was implemented as follows:
1.
2.
3.
4.
5. 
This model calibration procedure is further illustrated by the flow chart shown in Figure 12.
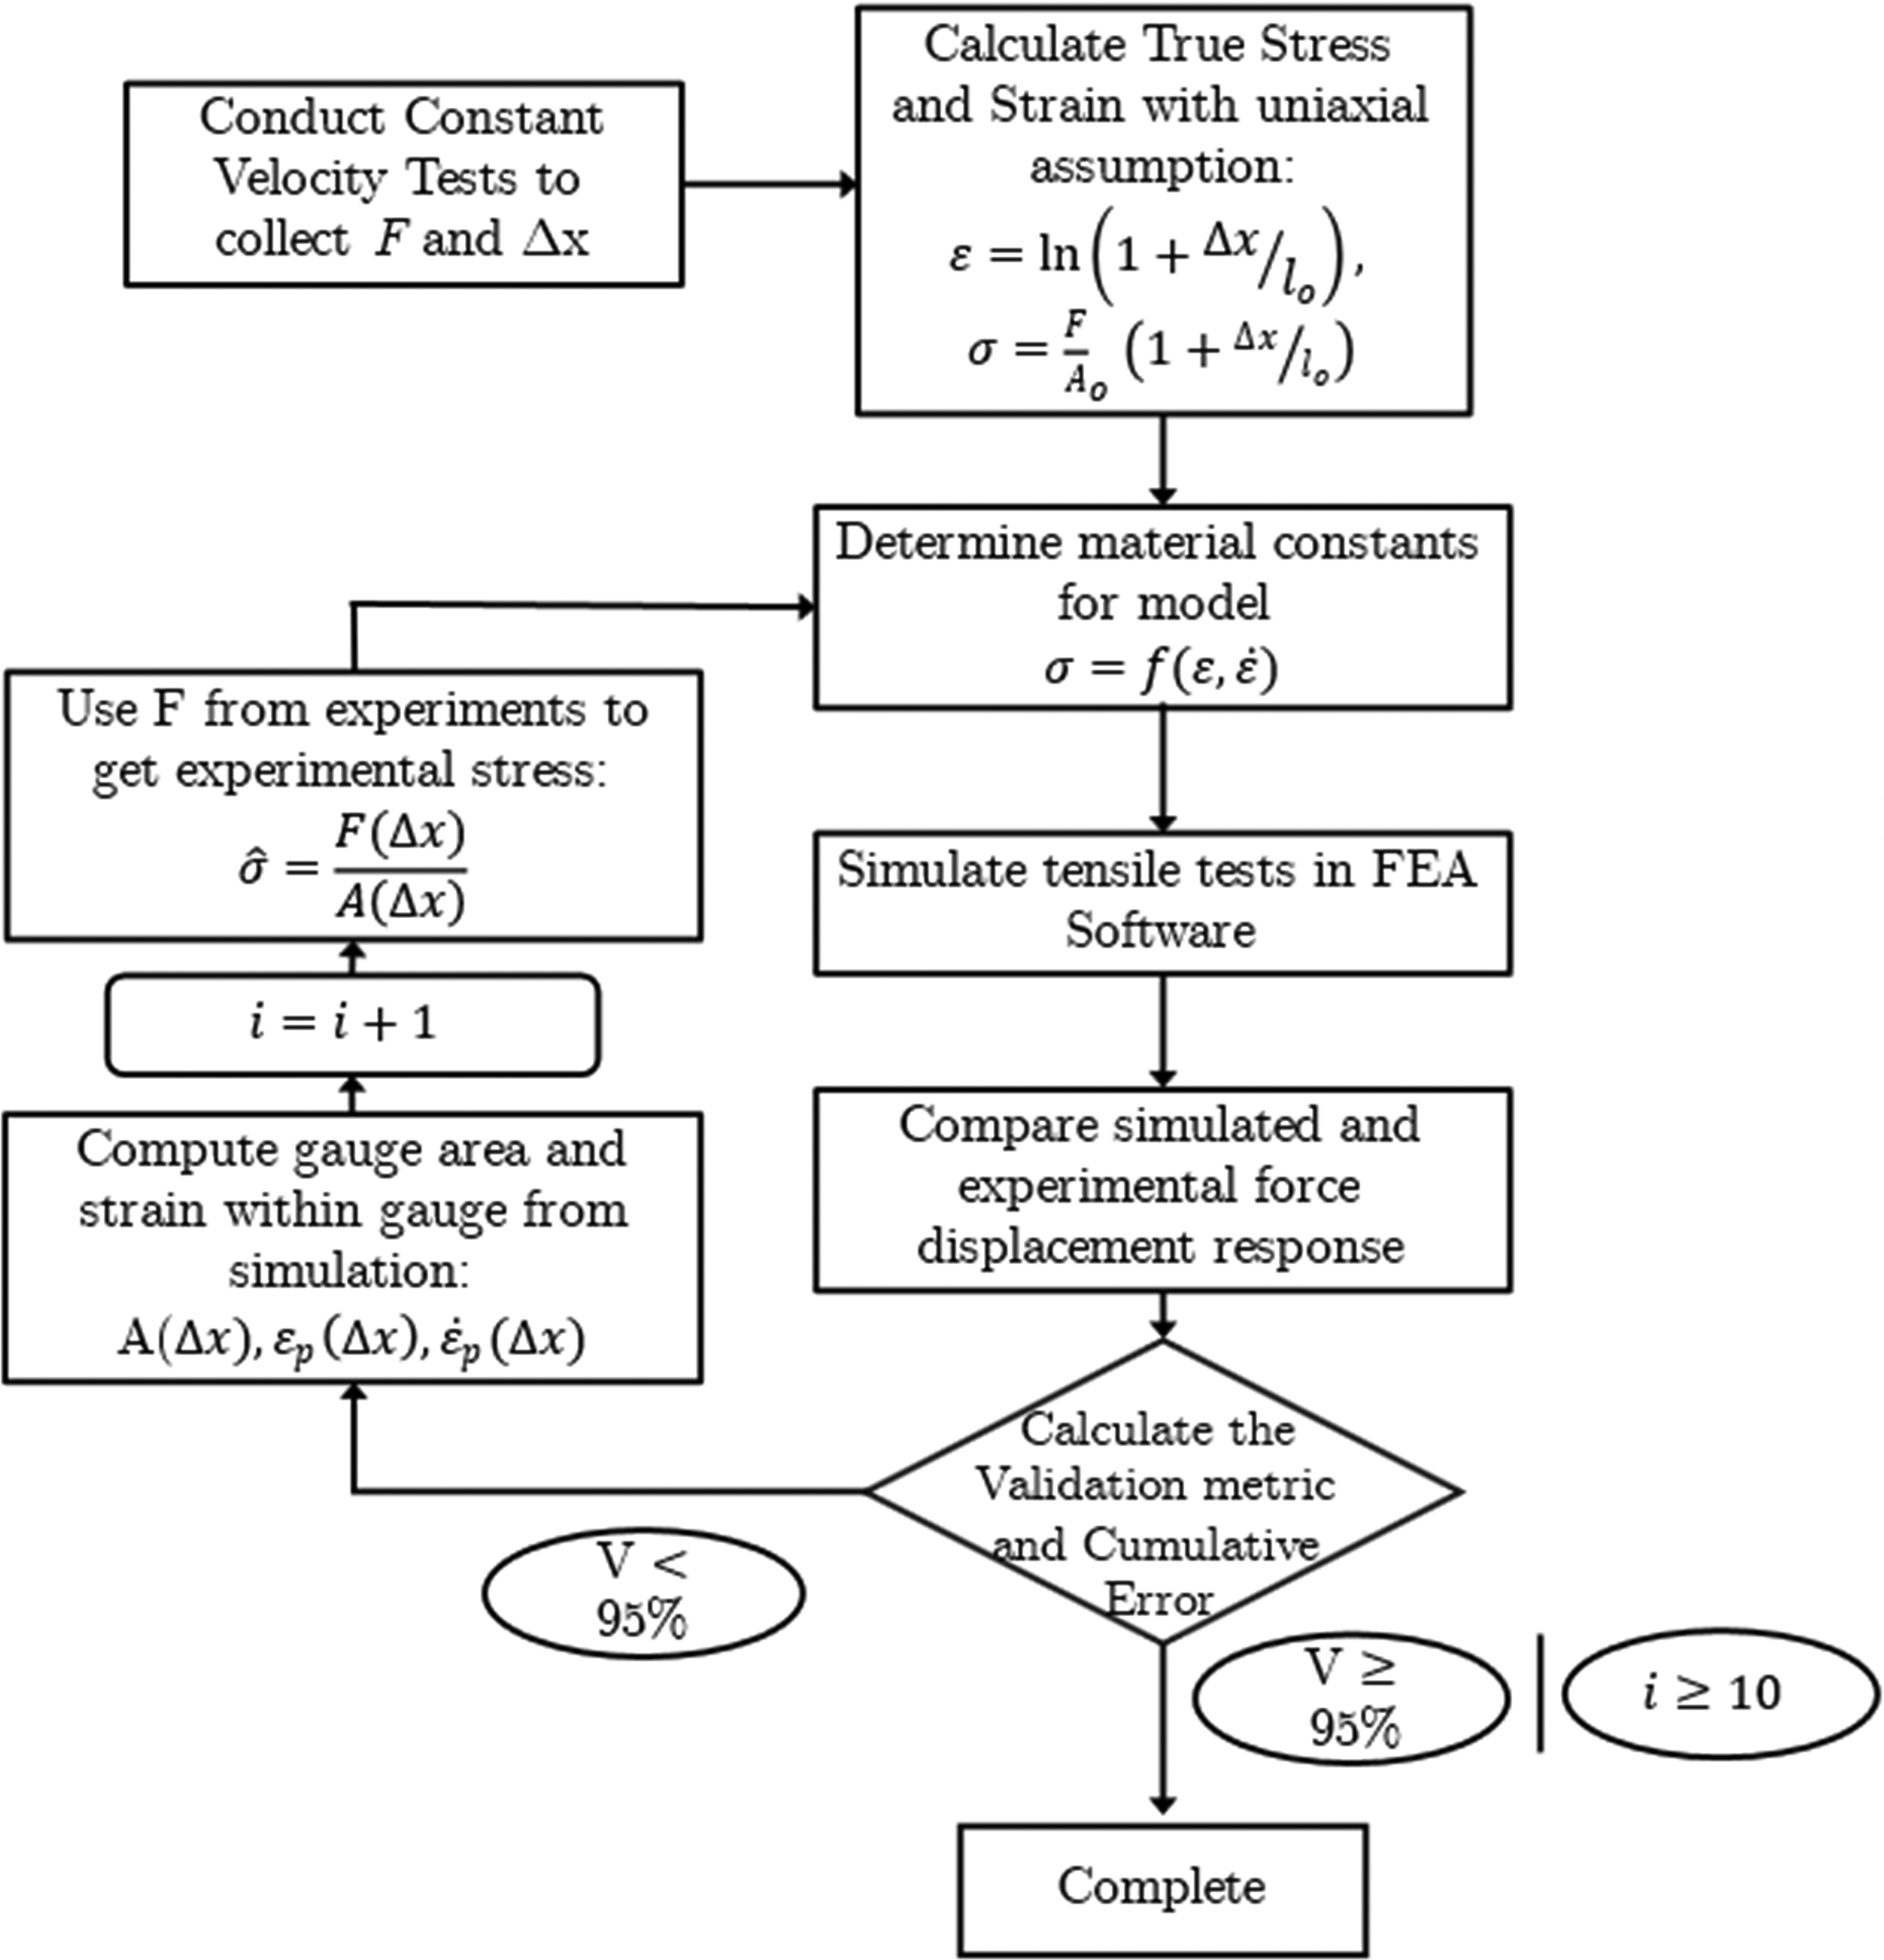
Analysis procedure for calibration of material model parameters.
The proposed model and process of analysis should allow for the modelling of high temperature deformation accurately, successfully accounting for both material deformation into the grip region and non-uniform deformation such as necking. As shown in the flow chart in Figure 11, the target validation metric is greater than 95% as an average for all the tested strain rates. Also, a model may not be capable of completely modelling the behavior and therefore the number of iterations is also capped, and in this case ten iterations was selected as a maximum.
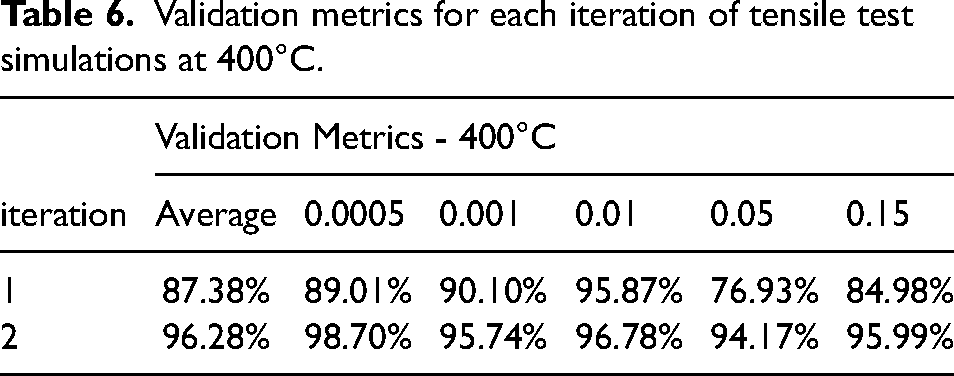
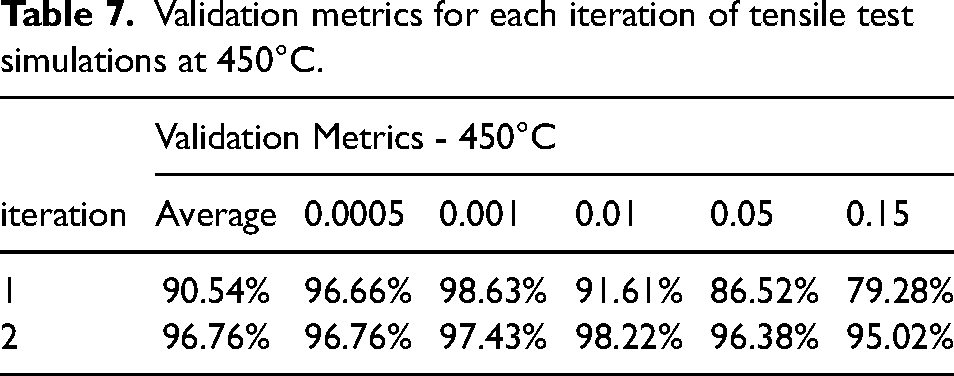
Simulations of the tensile tests were run following the model calibration, with temperatures applied only in the selection of material constants and there was no thermal-mechanical coupling and the accuracy for each temperature, strain rate and iteration is quantified by the validation metrics as outlined in Tables 6 to 8.
Validation metrics for each iteration of tensile test simulations at 400°C.
Validation metrics for each iteration of tensile test simulations at 450°C.
Validation metrics for each iteration of tensile test simulations at 500°C.
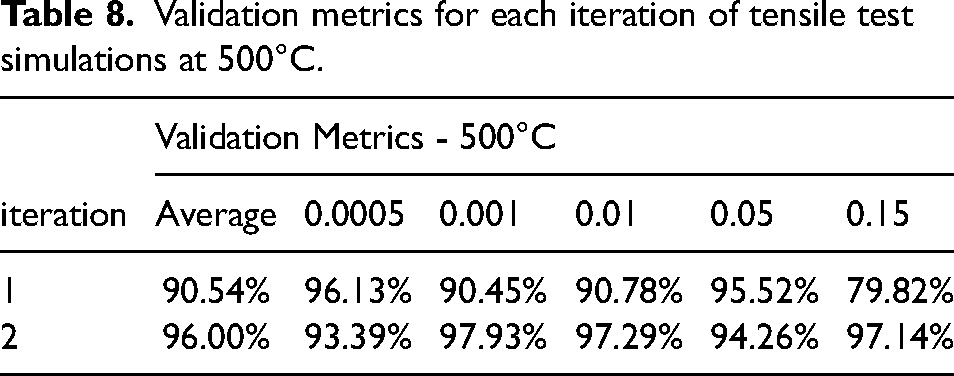
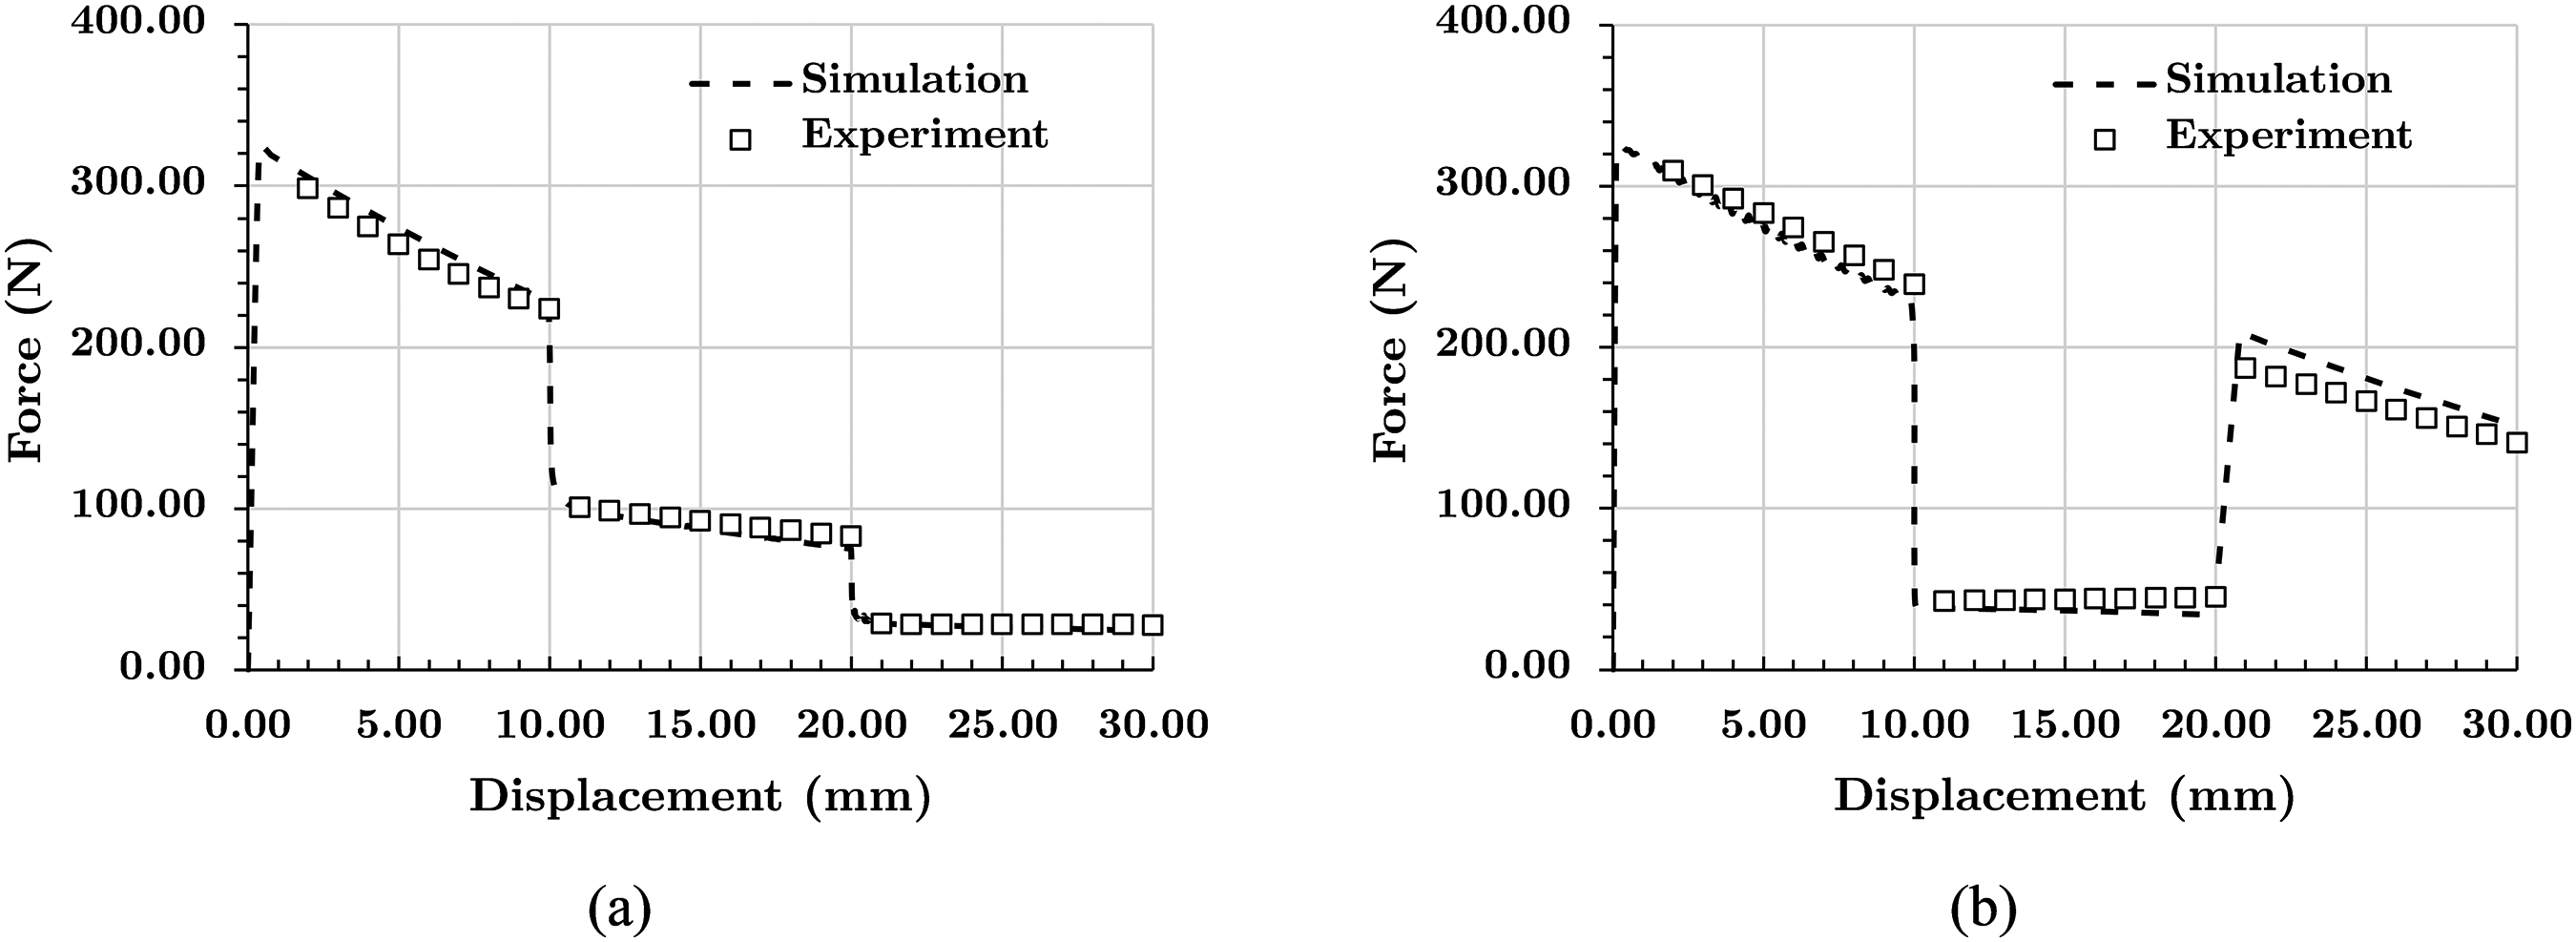
As seen in the above results, the calibration procedure successfully determines the parameters in the model for all the tested temperatures with a greater than 96% validation metric with only two iterations. If desired, the final iteration's simulation results can be used again to compute another set of material constants. The predicted force/displacement results from the simulations are compared to the experiments in Figure 13.
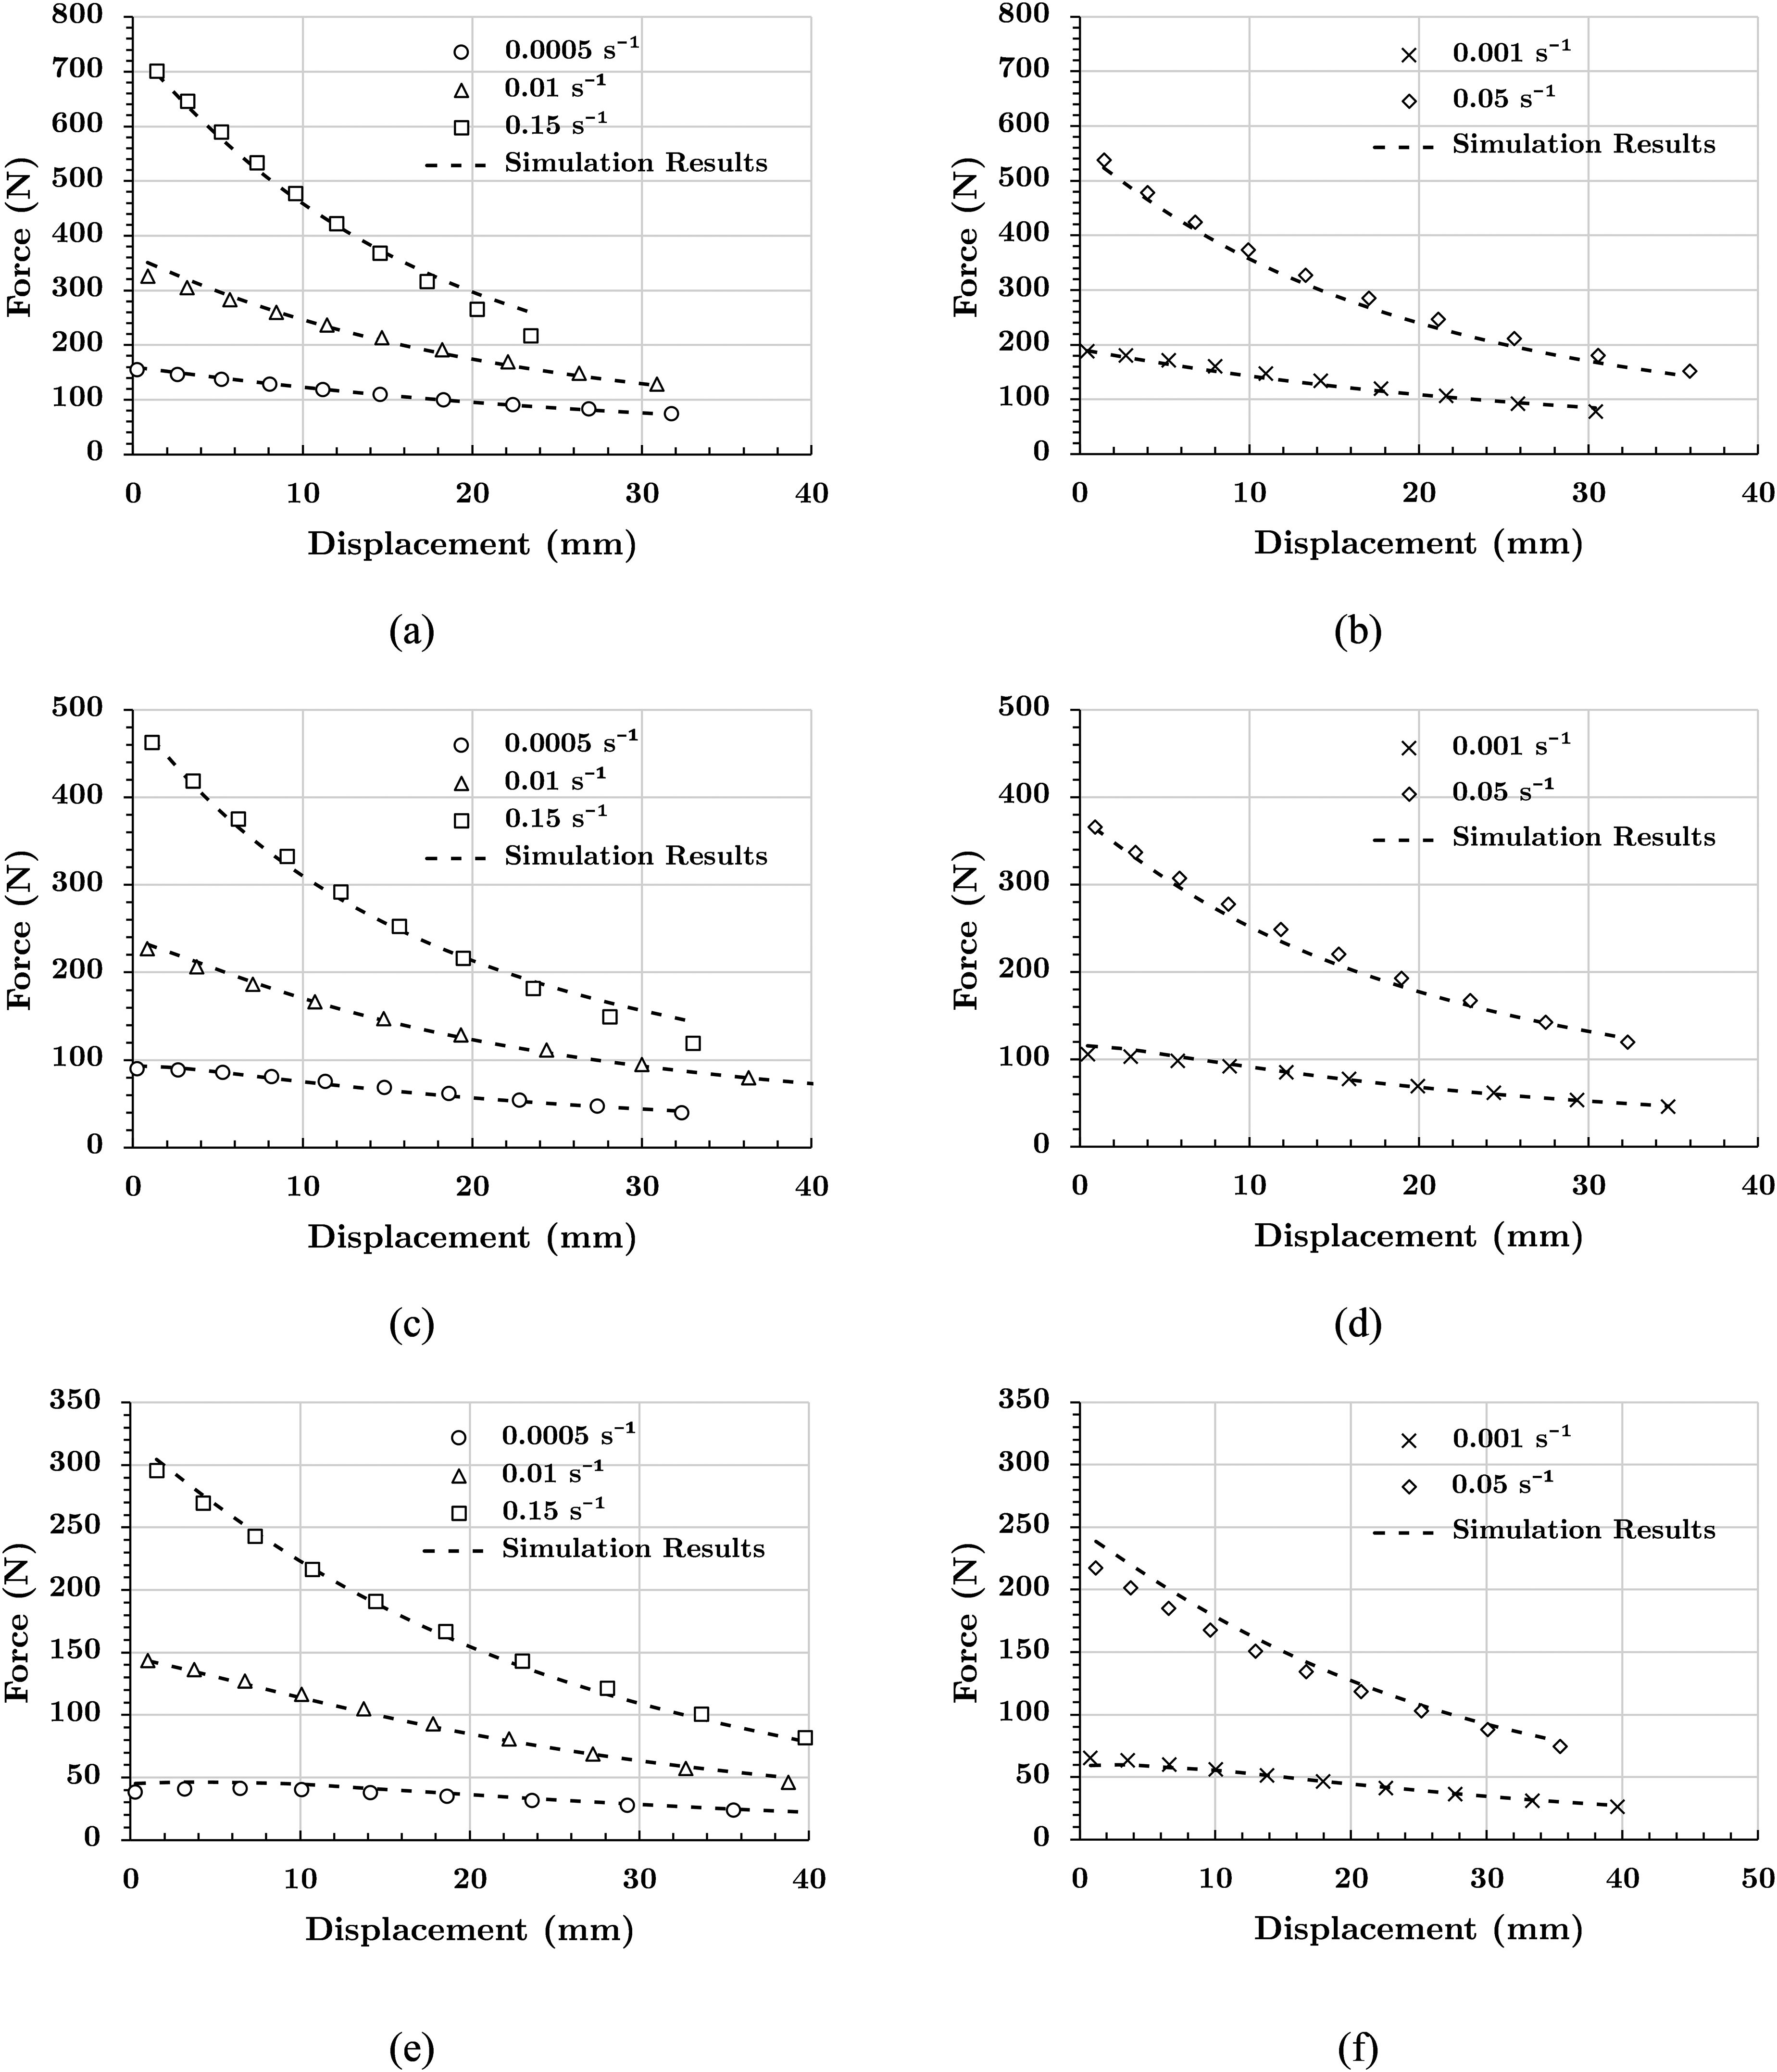
Fit of the proposed model for temperatures of 400°C (a, b), 450°C (c, d), 500°C (e, f).
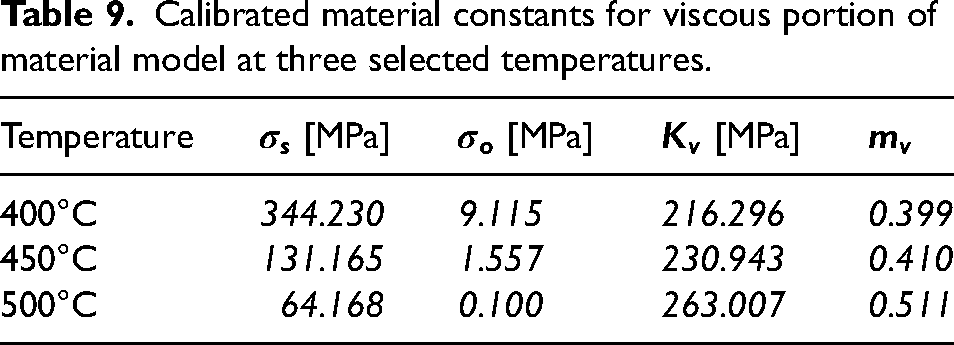
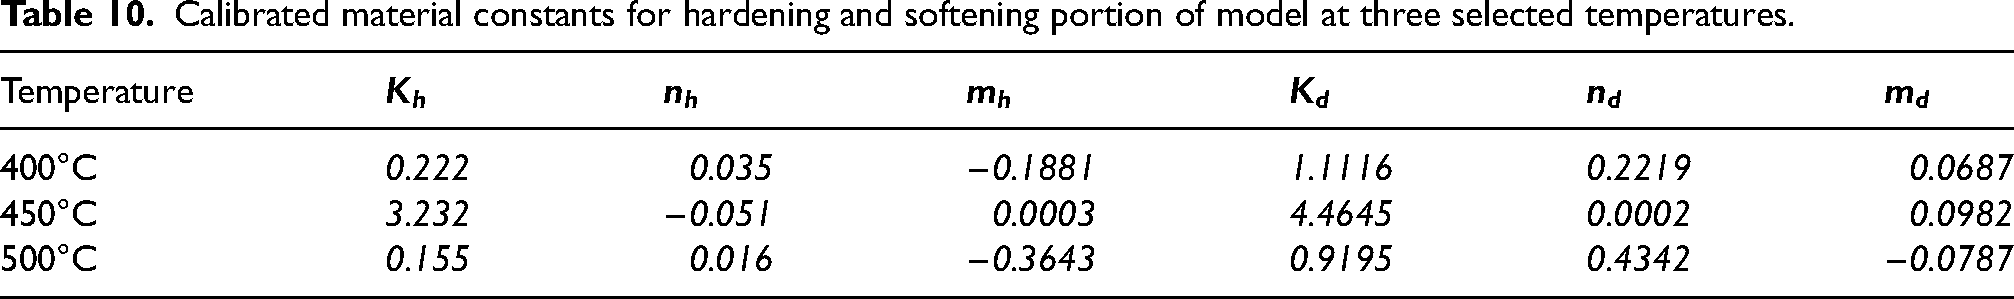
The computed material constants for each of the tested temperatures after iterations are shown in Tables 9 and 10.
Calibrated material constants for viscous portion of material model at three selected temperatures.
Calibrated material constants for hardening and softening portion of model at three selected temperatures.
To further assess the effectiveness of the developed models a series of variable velocity tensile tests were conducted using different combinations of the constant velocities previously applied. The relevance of this series of tests lies in the existence of both variable strain rate forming as well as the prevalence of different regions of the sheet undergoing different strain rates throughout the entire deformation process. As die complexity increases, it becomes more common for different areas of the sheet to deform at different and varying strain rates, even for a conventional constant strain rate SPF operation. At each temperature four different testing sequences were conducted: Fast to Slow (FS), Slow to Fast (SF), Fast Slow Fast (FSF) and Slow Fast Slow (SFS). The selected fast velocity was 3.75 mm/s (0.15 s−1 initial strain rate) and the selected slow velocity was 0.025 mm/s (0.001 s−1 initial strain rate). Additionally, an intermediate velocity of 0.25 mm/s (0.01 s−1) was used for the FSF and SFS procedures. The constructed test sequences are shown in Figure 14.
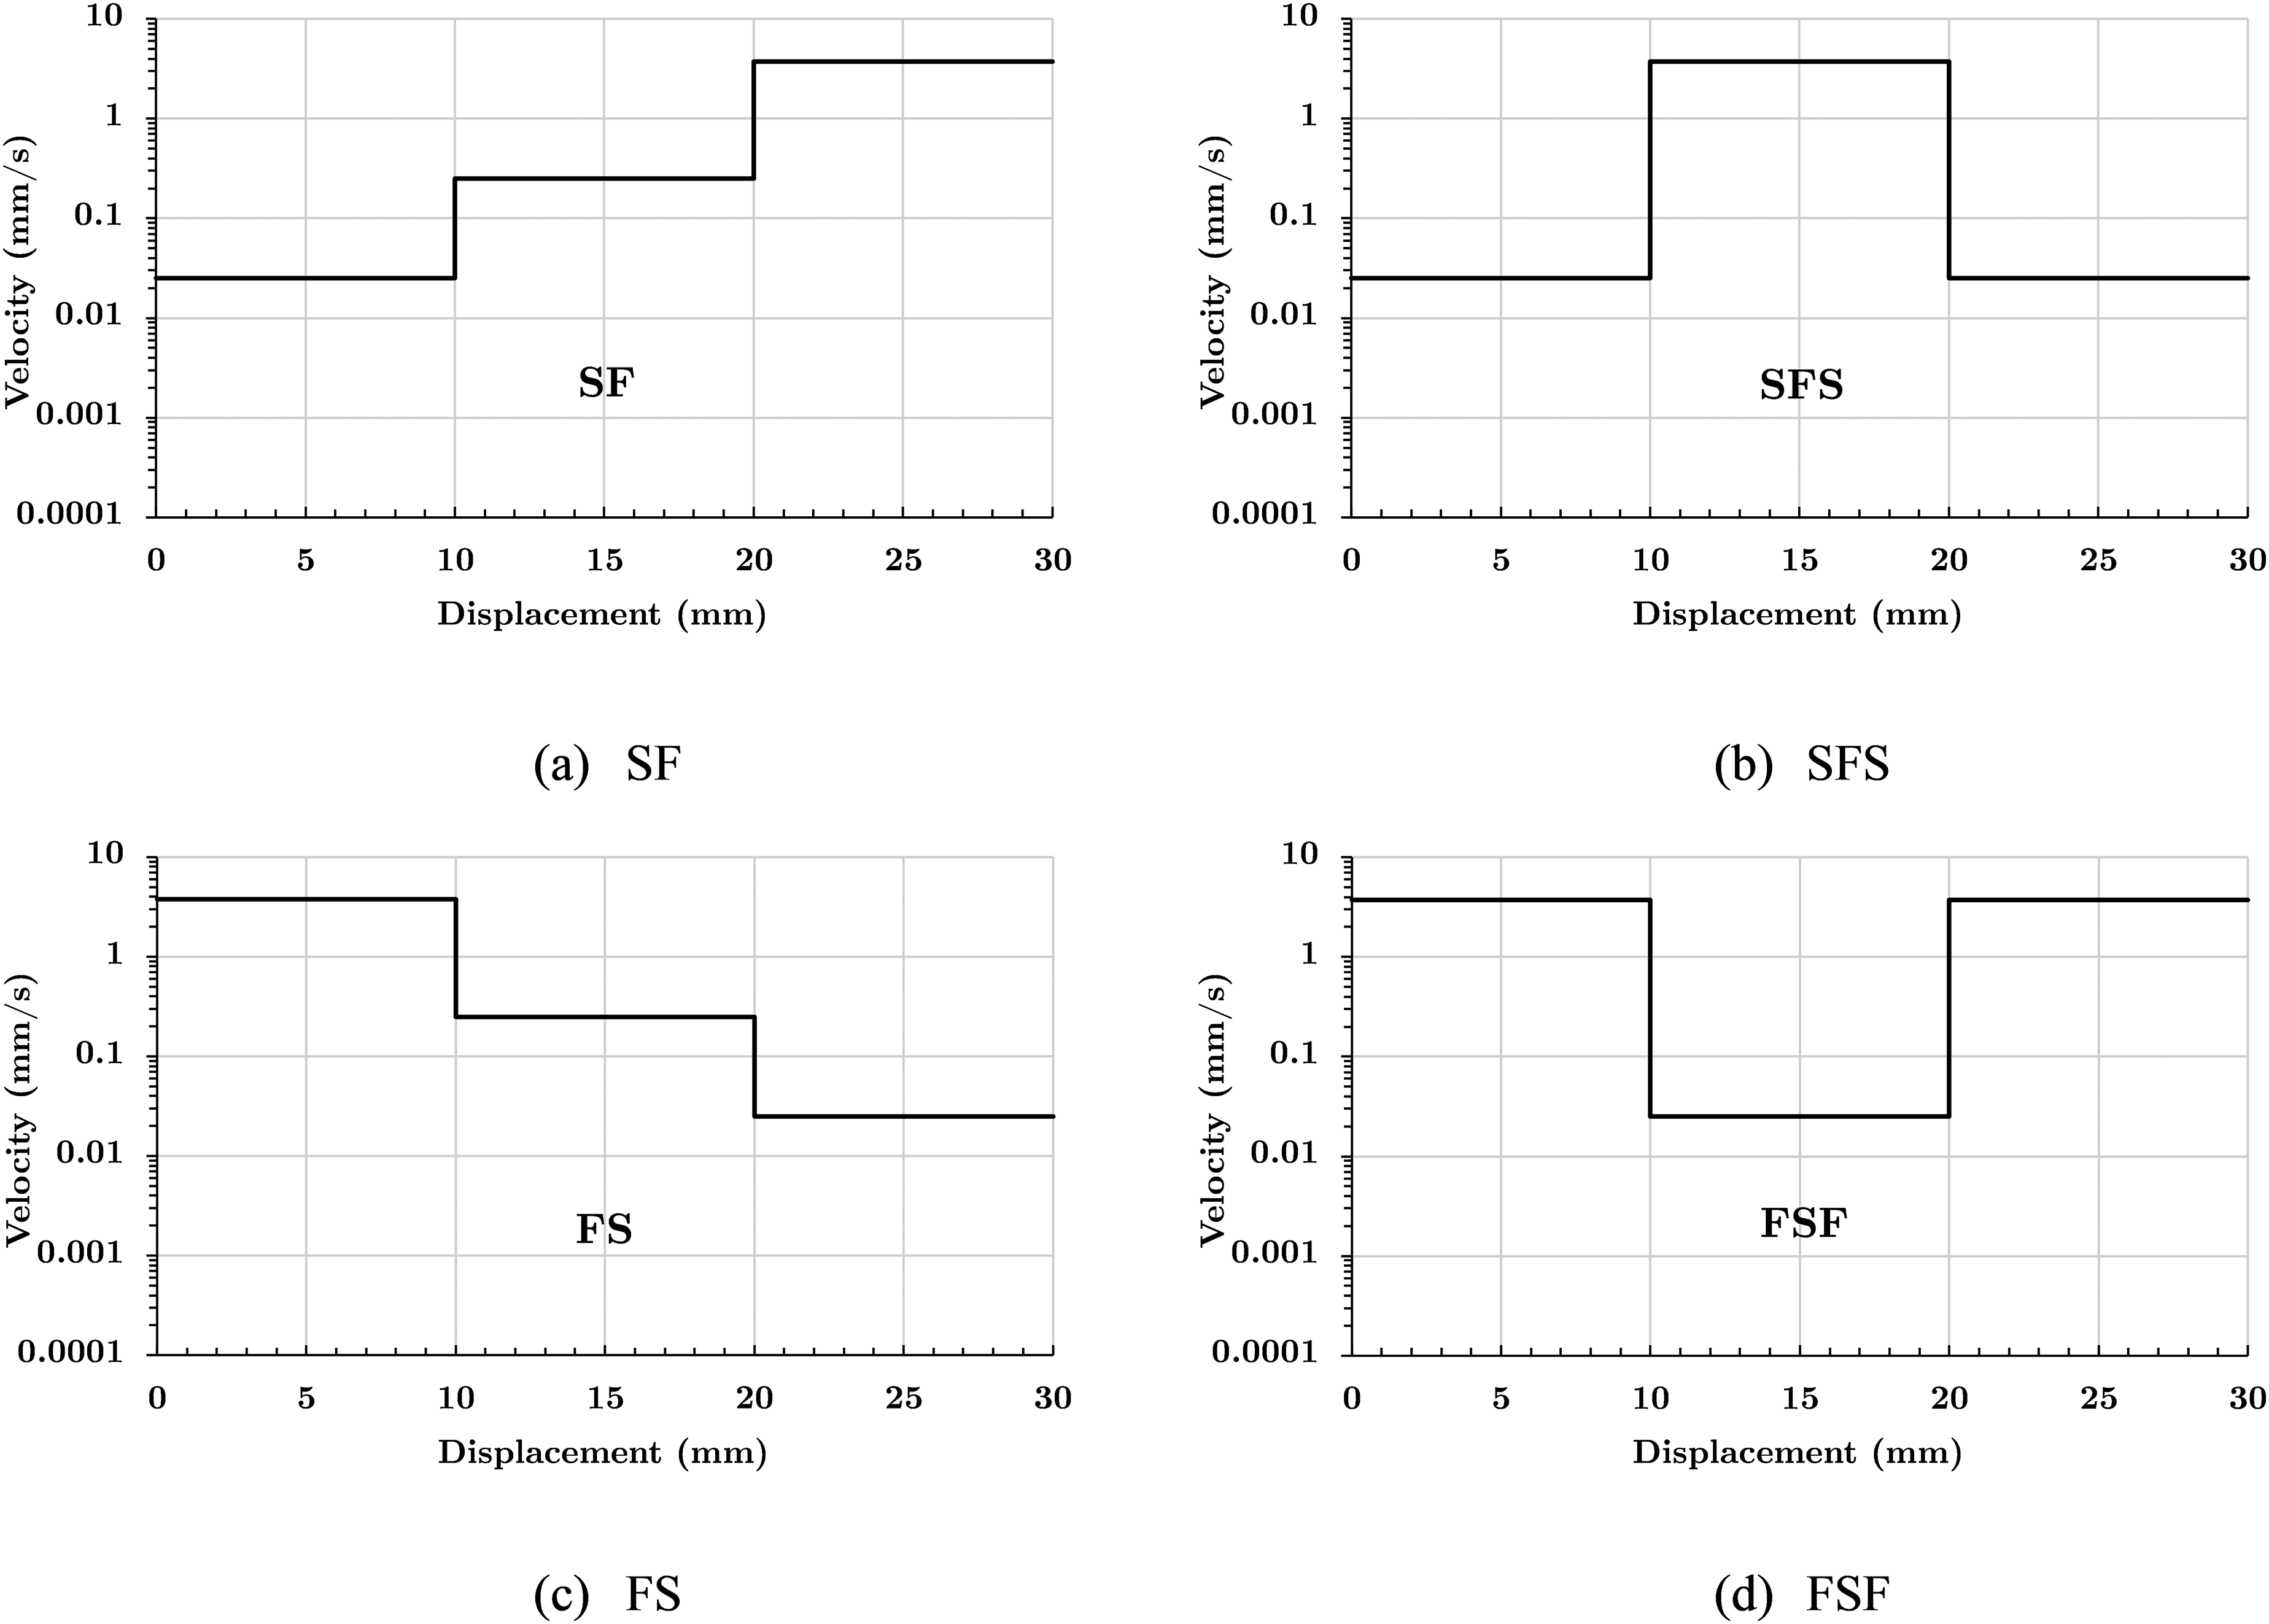
Velocity-displacement profiles of variable velocity tensile tests.
The constructed material models with proper material constant calibration are then used to simulate the tensile tests with the prescribed velocity sequences to further evaluate the model. The resultant validation metric for each of the completed tests are shown in Table 11.
Validation metrics for completed variable velocity tensile tests at three selected temperatures.
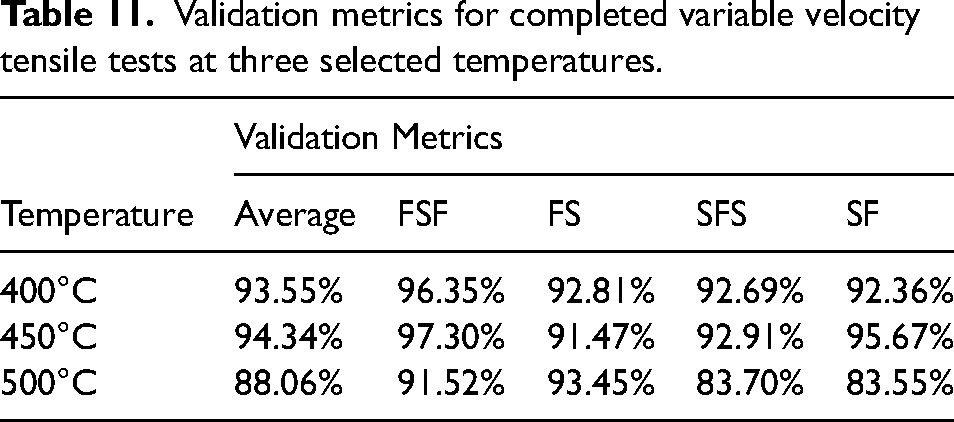
As seen in the table above, the model performs well for most of the completed tensile tests. But accuracy is substantially decreased for the 500°C tests, particularly with the SFS and SF test sequences. The results for these tests and accompanying simulations are shown in Figure 15.
Variable velocity tests compared to completed simulations at 500°C for the SFS (a) and SF (b) configurations.
Discussions
Tensile test results
A methodology for comprehensive material characterization was proposed, integrating both experimental tensile testing and numerical analysis. Given the highly viscous nature of materials deforming under creep conditions, a tensile test with stepwise decreasing velocities was performed. This approach enabled the identification of the material's viscous behavior, including the relationship between stress and strain rate, as well as the strain rate sensitivity index (m) using a selected viscous material model.
Referring to Figures 2 and 4, distinct creep regions can be identified: Region I (diffusion creep), Region II (superplasticity), and Region III (power-law creep). These regions are critical for designing tests to capture the material behavior comprehensively across different deformation mechanisms. Region I, characterized by a steep positive slope of m with respect to strain rate, is most pronounced at 500°C where m values increase from approximately 0.2 to 0.3 as strain rate increases from 0.0001 to 0.001 s−1. At 450°C a distinct Region I is present but is more pronounced for strain rates lower than those at which these tests were carried out. At 400°C Region I is significantly less pronounced.
Region II, which is defined by a plateau in the m-value is evident across all temperatures and was defined for strain rates ranging from 0.001 to 0.05 s−1. Finally, Region III is characterized by a large negative slope in m, which occurs primarily at strain rates greater than 0.05 s−1 where m begins to decline towards 0.2 for all temperatures investigated. These observations were used to guide the strain rate selection for further investigation: 0.0005 (Region I), 0.001, 0.01, 0.05 (Region II) and 0.15 s−1 (Region III).
Following this, constant crosshead velocity tests were chosen over the ASTM-standard constant strain rate tests due to their practical advantages. Unlike constant strain rate testing, which requires an accelerating crosshead, constant velocity testing is more straightforward to implement. This substitution was deemed acceptable since the model was fit with an iterative procedure.
Developed material model
A novel phenomenological model was developed to simulate the high-temperature behavior of the superplastic alloy AA5083. The model is founded on the premise that strain hardening behavior is state-dependent and cannot be adequately captured using a static surface, as is typical of phenomenological models. Another key distinction is the use of a constant strain rate sensitivity index with respect to strain, diverging from many recently proposed models in the literature and contradicting experimental results reported in prior studies.21,28,36
An often-overlooked assumption is that deformation is entirely uniform, implying that strain, strain rate, and material behavior can be accurately predicted. However, simulation results indicate this is rarely the case. To explore this, the strain rate at the necked region in the final iterations of tensile test simulations was analyzed for all temperatures studied. Figure 16 compares the strain rate measured in the simulation with the predicted strain rate, calculated using Equation (12) (strain rate ratio).
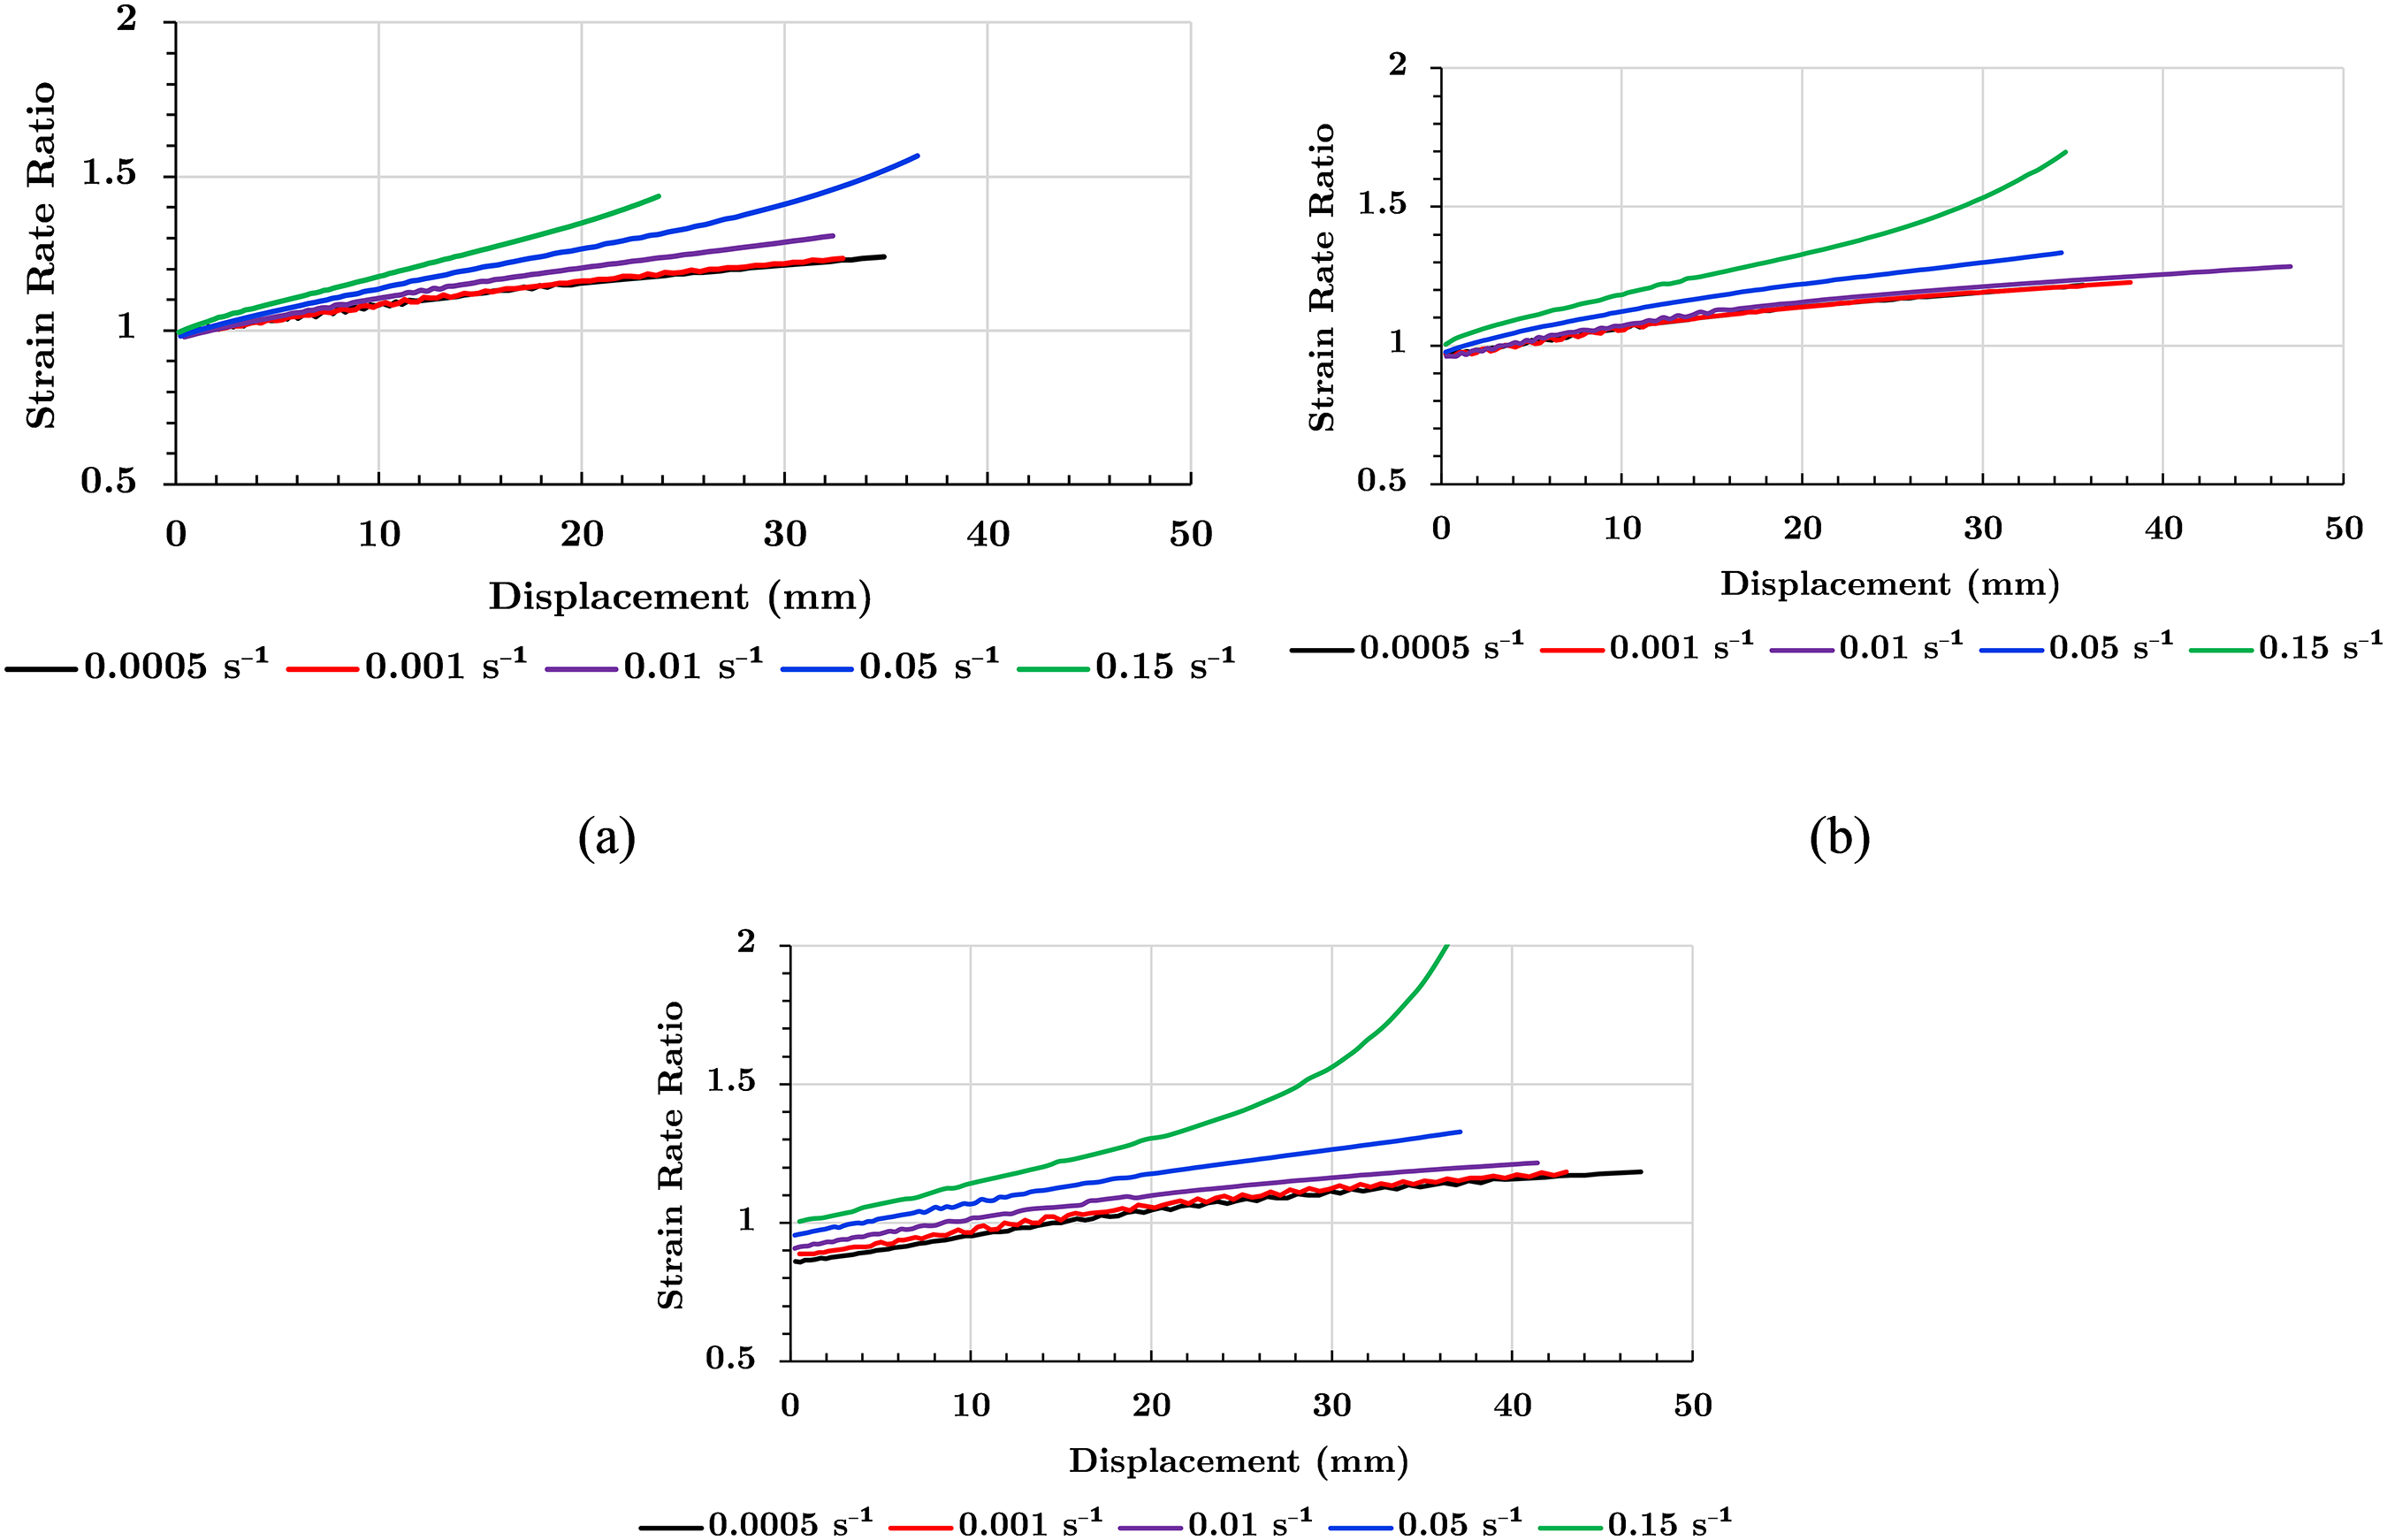
Comparison between the measured and the expected strain rate for tensile test simulations at temperatures of (a) 400°C, (b) 450°C, and (c) 500°C.
As shown in Figure 15, the strain rate is almost consistently higher than the assumed strain rate. Even at the slower strain rates, the measured strain rate is upwards of 1.18, 1.23, and 1.40 times higher than the expected at 500°C, 450°C and 400°C, respectively. At the highest strain rate of 0.15 s−1, strain localization visibly occurs, as shown in the photograph of tested specimens seen in Figure 10. In simulations, the measured strain rate is greater than 1.5 times higher at all the investigated temperatures. This observation is important because despite the strain rate sensitivity index being constant with respect to strain, since the effective strain rate is changing it is expected that the measured strain rate sensitivity index would change over the duration of the tensile test.
To capture the strain effects of the material, a state variable approach was adopted, aligning with the foundation of typical micromechanical models. Unlike models solely dependent on the current strain and strain rate, which are state-independent and path-independent, this approach accounts for the material's dependence on its deformation history. This method was chosen because the anticipated deformation mechanisms are influenced by the hardening and softening that have already accumulated. Additionally, some previous models such as the Majidi and Overstress models consider hardening and softening as solely strain dependent. In contrast, the developed model was constructed independent of strain and was heavily strain rate dependent. This approach follows the work done by Friedman and Ghosh 37 and Jin. 38
Model parameter calibration
As highlighted in the literature, the limitations of the uniform deformation assumption have increasingly been acknowledged, leading to the adoption of coupled experimental and numerical approaches for characterizing superplastic and creep deformation.30,35,39 In this study, a method was proposed to determine more accurate material constants by coupling a simple tensile test with finite element simulations of the completed tensile tests. This approach eliminates the uniform deformation assumption by incorporating local strain and stress measurements from the simulated tensile specimen for the determination of the material constants.
Two approaches were evaluated to determine the stress/strain distribution: the first involved averaging the total deformation within the defined gauge region, while the second focused on the actual cross-sectional area in the neck, identified as the location of maximum transverse contraction. As illustrated in Figure 5, the effective necked region showed a strong correlation with the effective stress derived from the applied force at the displacing shoulder. Based on this, an accurate stress value was calculated using the necked region's cross-sectional area and the corresponding measured force. To ensure an appropriate model fit, this stress value was correlated with the plastic strain and plastic strain rate values at the location of the developing neck. The confirmation of this assessment within less than 1.00% variation confirms that this region of the sample is the primary area of resistance during specimen deformation.
As shown in Table 5, this adjustment process is necessary because the numerically optimized material constants fail to achieve acceptable accuracy, particularly at Region III strain rates. This adjustment procedure demonstrated exceptional accuracy across strain rate regions, including Regions I and III. Additionally, a high degree of accuracy (validation metric > 96%) was achieved with no more than two iterations. The entirety of the process can be fully automated if sufficient resources are developed to modify keyword files, run keyword files and process the resulting d3plot files. This can yield a fully optimized material model very rapidly.
Accuracy of constructed material model
To completely phase out the typically required assumptions the accuracy of the model was first assessed using the unadjusted force/displacement behaviour from the constant velocity experiments as opposed to the predicted stress-strain behaviour. For all three of the temperatures considered, the model effectively predicted the force/displacement behaviours with an accuracy greater than 93% for all strain rates and greater than 96% on average for all temperatures, as shown in Tables 5 to 7. As previously mentioned, the accuracy of the model can likely be further enhanced by calibrating the material constants with one additional iteration. But, for the sake of this study the iteration achieving a validation metric greater than 95% was deemed acceptable.
To further investigate the effectiveness of the developed models, variable crosshead velocity tests were constructed with strain rate sequences outlined in Figure 14. The model performs well for all three temperatures for the conditions of FSF, and FS, and at 400°C and 450°C at SFS and SF with validation metrics greater than 91%. But the limitation of the modelling procedure is identified in the modelling of the SFS and SF procedures at 500°C, with validation metrics both below 85%. As shown in Figure 15, the simulation results predict a much higher force after the acceleration of the crosshead when compared to the experiments. This inaccuracy could be attributed to two different phenomena, namely, (1) hardening is not path dependent, and (2) strain rate sensitivity is not constant for equal strain rates. To fully investigate the applicability of the model at 500°C the remaining variable crosshead velocity tests at this temperature are shown in Figure 17.
Variable velocity tests compared to completed simulations at 500°C for the FS (a) and FSF (b) configurations.
As seen in the figure, the remaining tests at 500°C are predicted with high accuracy; 93.45% and 91.52% validation metrics for the FS and FSF test condition, respectively. The largest variation between the two is still seen following the acceleration from the slowest to the highest crosshead velocity in the FSF test. This phenomenon is indicative of a variable rate sensitivity for a single strain rate. Since the strain rate sensitivity index (m) is said to be dependent on the microstructure of the material, it is still believed that any variation which exists through the deformation is path dependent, as opposed to state dependent. 40 Since at elevated strain rates, the assumed deformation mechanism is dynamic recrystallization, therefore refining the grain structure and making the material better suited for uniform deformation with increasing m values.37,41 In contrast, at lower strain rates, the material is more susceptible to grain growth, therefore increasing the grain size and decreasing its ability to undergo grain boundary sliding yielding reducing m values. As expected, as temperature increases, the AA5083 material becomes increasingly susceptible to grain growth, 42 which is the likely cause for the variability being most pronounced during the 500°C tests.
Conclusions and future work
A novel approach was introduced to model the deformation behaviour of commonly used superplastic AA5083 alloy. The aim of the study was to construct, calibrate, verify and validate a numerical model effective at modelling both controlled and variable strain rate high temperature blow forming processes. From the study the following conclusions can be drawn:
A model was constructed separating viscous behaviour and the strain hardening and softening behaviour. The model predicted the stress-strain behaviour at strain rates ranging from 0.0005 to 0.15 s−1 at temperatures ranging from 400°C to 500°C with average absolute relative errors below 5.00%.
Tensile test simulations carried out with LS-DYNA illustrated a clear discrepancy between the prediction of stress strain compared to that of force/displacement, yielding inaccurate material behaviour prediction
A novel iterative method to calibrate the material model parameters was developed and implemented yielding a high accuracy of material prediction with validation metrics greater than 96%
The model's validity was further assessed using variable crosshead velocity tensile tests, demonstrating high accuracy overall. However, challenges remained in accurately modeling the transition from slow to fast crosshead speeds at 500°C.
Future work could focus on extending the viscous portion of the model to incorporate deformation path dependency for enhanced predictive capabilities.
Future work will be carried out to validate this proposed model by comparing numerical predictions of the material behaviour in a blow-forming SPF process with experimental data.
Footnotes
Acknowledgements
The authors would like to thank AEM Power Systems and MITACS for providing funding for the work under MITACS grant IT20321. The authors would also like to acknowledge the work done by Mohammad Shirinzadeh Dastgiri for assisting in the construction of the utilized test set-up.
Declaration of conflicting interests
The authors declared no potential conflicts of interest with respect to the research, authorship, and/or publication of this article.
Funding
The authors disclosed receipt of the following financial support for the research, authorship, and/or publication of this article: This work was supported by the Mitacs, (grant number IT41081).