
Abstract
Blood pumps are medical devices that can temporarily or permanently replace the heart to perform the job of blood pumping. To study the internal flow field characteristics of the centrifugal blood pump, high-speed photography (HSP) images of the internal flow in the centrifugal blood pump were taken, and the internal flow field was numerically simulated. According to the heartbeat rule, the visualization experiment method and numerical simulation method for the internal flow of the centrifugal blood pump were developed. The internal flow rule of the centrifugal blood pump during a heartbeat cycle was revealed, as well as the influence of pump construction, flow rate, and other factors on the pump’s flow field. The results indicate that the flow rate and the rotor/stator interference of the blade and volute tongue cause two periodic changes in the pump pressure and velocity. One is the cycle of the heartbeat, and the other is the cycle of the blade’s rotation. The research results are of great significance in reducing the mechanical damage of blood, optimizing the structure of the pump and improving the stability of the centrifugal blood pump.
Keywords
Introduction
Pumps are commonly utilized energy conversion machines that are used in all aspects of life.1–3 With the continual progress of science and technology, pumps have begun to reach the sectors of precision electronic machinery, space exploration, and medical treatment on a micro and nano scale. 4 In the medical field, pumps are mostly utilized as temporary or long-term blood supply devices. The centrifugal pump is simple in build and simple to install and move. When delivering blood, it will cause less blood damage compared to the conventional roller pump, and less blood damage will minimize platelet activation, hence minimizing hemolysis and increasing hemostasis. 5 Due to these benefits, centrifugal blood pumps have been the treatment of choice for emergency situations and are extensively utilized in extracorporeal membrane oxygenation (ECMO) and ventricular assist devices (VAD).6–8
Many scholars have done a lot of numerical research on the external characteristics and internal flow of blood pumps. 9 In order to reveal the interaction between the centrifugal blood pump and blood during the operation, Feng et al. 10 adopted the standard k-ω turbulence model to simulate the flow in the pump and analyzed the influence of the changes in blade height, rotating speed, and other factors on the flow field and dynamic performance of the pump. The results show that the rotating speed of the impeller has the greatest influence on the performance. In order to study the effect of center post establishment and its parameter changes on the performance of centrifugal blood pumps, Fang et al. 11 used CFD to analyze the internal flow of blood pumps with different central posts in the extensive parametric approach, and RNG k-ε model was selected as the turbulence model. Fan et al. 12 used the k-ω turbulence model to analyze the internal flow of the axial flow blood pump based on the established numerical method. The design of the pump and the flow analysis method were improved, and flow field experiments verified the correctness of the research results. In order to analyze the internal flow field and hydraulic performance of the implantable blood pump. Li et al. 13 used the SST k-ω turbulence model to simulate the internal flow field of the axial flow pump. The distribution of internal shear stress was obtained, and a hemolysis prediction model based on shear stress was established according to the calculation results. Compared with the standard k-ω turbulence model, the SST k-ω turbulence model is more accurate and reliable, and it is widely used in the research of blood pumps. Therefore, the SST k-ω turbulence model was used in this paper for numerical simulation of the internal flow in the blood pump.
Flow visualization is crucial for studying the internal flow of pumps. Hariharan et al. examined the velocity field in the blood pump model using particle image velocimetry (PIV). The experimental data were utilized to validate the results of the numerical simulation and to evaluate the blood pump. Shigemitsu et al. 14 used PIV technology to study the internal flow field of a micro centrifugal pump with a 55 mm impeller diameter. Based on the experimental results, the distribution law of the fluid’s velocity and vorticity in the region of the volute tongue was obtained. In addition to PIV technology, however, high-speed photography (HSP) has been widely used in the research of conventional pumps and blood pumps. In order to properly assess the changes in the flow field, numerous researchers utilized high-speed photography to capture images of the flow in the pump during the visualization experiment. 15 Zhao et al. 16 and Shao et al. 17 utilized HSP technology to photograph the internal flow field of a centrifugal pump in order to study the dynamic behavior of bubbles and their effect on the pump’s flow pattern. Different flow patterns were observed in the suction chamber and impeller. The link between flow patterns and the volume fraction of the incoming gas was revealed. Compared to PIV technology, HSP technology is easier to operate and produces more intuitive outcomes. In this work, HSP technology was employed to capture images of the blood pump’s internal flow.
In this paper, the flow field in a heartbeat cycle of a centrifugal blood pump during normal operation was simulated by computational fluid dynamics. The visualization experiment of the internal flow of the pump was carried out, and the external characteristics of the pump were measured. At the same time, the numerical simulation method was verified according to the experimental results. The effects of flow rate and volute tongue structure on the external characteristics, internal pressure, and velocity of the centrifugal blood pump at a constant rotating speed were studied in detail. The visualization experiment method and the numerical simulation method of the internal flow of the centrifugal blood pump according to the law of heartbeat were established. The internal flow rule of the centrifugal blood pump in a heartbeat cycle was revealed. The research results are of great significance in reducing the mechanical damage of blood, optimizing the structure of the pump, and improving the stability of the centrifugal blood pump.
Numerical simulation method for the centrifugal blood pump
Geometric model and grid generation
The size of the centrifugal blood pump studied in this paper is relatively small. The inlet pipe and outlet pipe diameters are 15 and 20 mm respectively, and the impeller diameter is 47 mm. The specific structural parameters of the pump are listed in Table 1. The three-dimensional geometric model of the centrifugal blood pump was built through the software Pro E. Because of the small size of the pump, the length of the inlet section was appropriately extended in order to better simulate the flow in the pump and reduce the influence of the boundary on the internal flow of the centrifugal blood pump.
Structural parameters of the centrifugal blood pump.

In order to better analyze the internal flow characteristics of the centrifugal blood pump during the unsteady numerical simulation, monitor points were set inside the volute to monitor the changes of the pressure, velocity, and other parameters at key positions. The locations of monitor points and sections are shown in Figure 1. shows the specific coordinates of each monitor point.
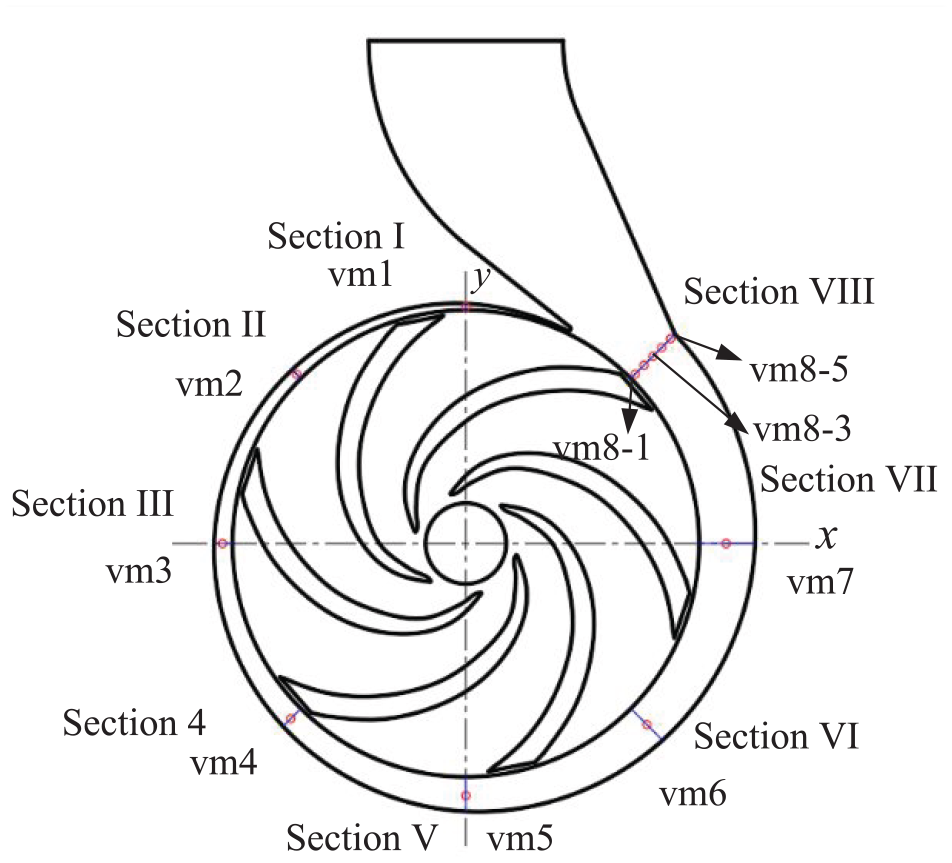
Monitor points and volute sections in the centrifugal blood pump.
ICEM software was used to mesh the three-dimensional geometric model of the centrifugal blood pump, the structured grid was used to mesh the inlet and outlet sections of the centrifugal blood pump, and the unstructured grid was used for the impeller and volute of the pump. This is because the inlet and outlet sections of the centrifugal blood pump have a reasonably simple structure, the quality of the division using a structured grid is quite high, and the numerical simulation results are relatively accurate. The impeller and volute of the centrifugal blood pump have a relatively complex structure, and the unstructured grid is highly adaptable to this structure and has excellent boundary processing capabilities. Due to the complex structure and large curvature of the volute tongue part of the centrifugal blood pump, it needs to be locally densified when meshing. The grids of the fluid domain of the centrifugal blood pump are shown in Figure 2.

Meshing of fluid domain of centrifugal blood pump.
In order to save computational costs and account for the accuracy of numerical simulation results, the models with different grid numbers were verified for grid independence. Figure 3 shows the relationship between the head and efficiency of the pump and the number of grids. It can be found that when the number of grids increases from 781,352 to 1,056,465, the head and efficiency increase greatly. When the number of grids increases from 1,149,938 to 1,562,003, the fluctuation amplitude of the head and efficiency is relatively small. It can be considered that the number of grids meets the accuracy requirements within this range. Therefore, the number of grids for the centrifugal blood pump is determined to be 1,149,938.

Grid independence verification.
For the SST k-ω model, the value of

Distribution of
Calculation method and boundary conditions
Fluent 16.0 software was used to simulate the flow field of a centrifugal blood pump in the heartbeat cycle. SST k-ω model was used as the turbulence model, which was widely used in the flow field simulation of the centrifugal blood pump and other types of pumps.19,20 The sliding grid method was used to simulate the relative motion between the impeller and the volute. The flowing medium is blood, which can be regarded as an incompressible fluid. At normal human temperature, the density of blood ρ = 1.05 kg/L and the dynamic viscosity of blood μ = 0.0035 Pa·s. The ideal blood pressure range is 80–120 mmHg. The blood flow rate of the natural human heart is not a constant but fluctuates periodically. In general, a heartbeat cycle is 0.8 s, and the flow rate range is 2–7 L/min. Velocity inlet was used as the inlet boundary condition, and the user define function (UDF) was used to edit the inlet flow rate fluctuation function. 21 The flow rate fluctuation curve is shown in Figure 5. The outflow was used as the outlet boundary condition. The rotating speed of the centrifugal blood pump is generally 2000–5000 r/min. 22 The rotating speed of the impeller was set as 2100 r/min to meet the requirements of human blood pressure. In the numerical simulation, the SIMPLE algorithm was used to solve the equations of pressure and velocity coupling, and no-slip boundary conditions were used for the wall. For unsteady simulation, the time step size was set as 0.0004 s, the impeller rotated 5.04° for each time step, the time steps were set to 4000, and the total time was 1.6 s for two heartbeat cycles. The impeller rotated 28 cycles per heartbeat cycle. Because the purpose of this study is to research the internal flow field of the centrifugal blood pump under normal operating conditions and does not consider the change in the flow field during the start-up phase, only the numerical simulation results of the last 0.8 s are selected for analysis.

Flow rate fluctuation curve.
Experimental device and method for the centrifugal blood pump
Experimental device
The internal flow experimental device of the centrifugal blood pump is shown in Figure 6. The experimental device is mainly composed of four parts: centrifugal blood pump, pipeline system, power system, and high-speed photography system. The flow rate was adjusted and measured by the rotameter, and the rotating speed of the centrifugal blood pump was controlled by the control cabinet. In order to better observe the internal flow of the centrifugal blood pump, the centrifugal blood pump model in the experiment was made of polymethyl methacrylate. In order to get clearer pictures when shooting with high-speed photography (model: i-speed 3), a cold light source device (model: HLS-30, power: 250 W) was used for light compensation.
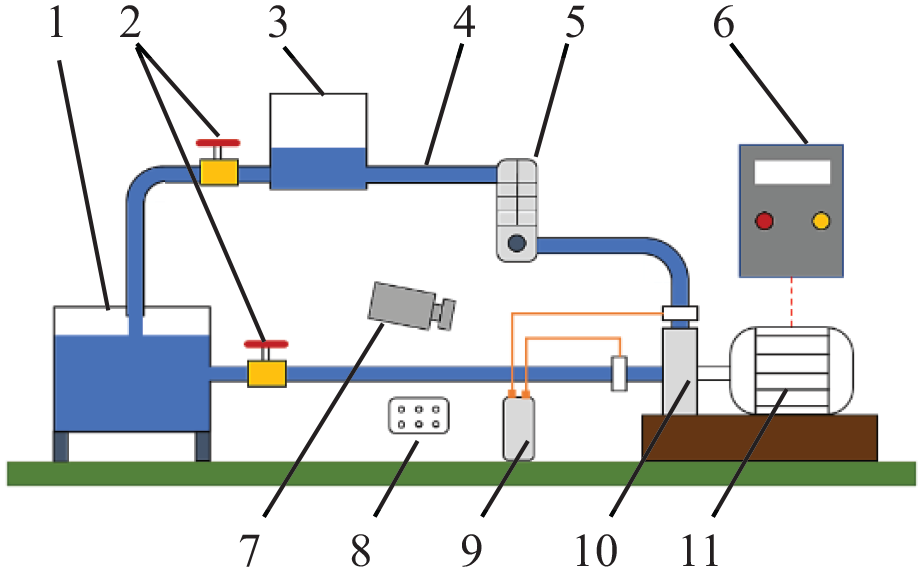
Schematic diagram of the centrifugal blood pump experimental device: 1. storage tank, 2. inlet and outlet control valves, 3. flow calculation tank, 4. delivery pipe, 5. rotameter, 6. control cabinet, 7. high-speed camera, 8. cold light source, 9. U-tube manometer, 10. centrifugal blood pump, 11. motor.
Experimental methods
The density and viscosity of a 33.3% glycerol water solution at room temperature are comparable to that of human blood, 23 hence this solution was employed to replace blood as the delivery medium. To get the external characteristics of the centrifugal blood pump under varied flow rates, the centrifugal blood pump’s external characteristics experiment was done under the working conditions of rotating speed n = 2100 r/min and inlet flow rate Q = 2∼7 L/min. Utilizing high-speed photography, images of the flow in the volute of the pump were captured. Tracer particles were added to the glycerol-water solution, which is transparent, to better observe the flow in the pump. Fluorescent particles with a diameter of 0.7 mm were used for this experiment due to the comparatively small cross-section of the volute flow path of the centrifugal blood pump. During the visualization experiment, high-speed photography was used to capture the flow near the volute exit. The arrangement of the high-speed camera and the cold light source is shown in Figure 7. The high-speed camera and the shooting area are in the same horizontal plane, and the vertical distance between the camera lens and the front plane of the pump is about 330 mm. In order to capture clear images, the camera shooting frequency was set to 2000 frames/s, and the image resolution was 1280 × 1024.

Arrangement of experimental devices.
The main experimental steps are as follows:
(1) Arrange the high-speed camera system to ensure that the camera and pump are in the appropriate position.
(2) Select an appropriate amount of tracer particles and sprinkle them into the water storage tank to ensure that the test medium has a suitable particle concentration.
(3) Start the pump to make it run under the required working conditions. Adjust the rotational speed of the pump by the control cabinet, and adjust the flow rate by the control valve.
(4) Determine the shooting frequency of the high-speed camera.
(5) Start the high-speed camera system and shoot the flow field.
(6) Transmit the recorded data to the computer.
(7) Clean up the experimental site.
Comparison of experimental and simulated results
Comparison of the external characteristics
The internal flow of the centrifugal blood pump was tested and simulated under the conditions of rotating speed n = 2100 r/min and inlet flow rate Q = 2, 3, 4, 5, 6, and 7 L/min, respectively. Figure 8 shows the head of the centrifugal blood pump obtained by the experiment and simulation under different inlet flow rates. The error of the head obtained in the experiment and numerical simulation is less than 6.9%, which is within the acceptable range. It can be observed from Figure 8 that the experimental results are always slightly lower than the numerical results. This is because only hydraulic loss was considered in the numerical simulation of the flow field in the pump. However, the mechanical losses caused by the bearing and disk friction of the pump were not fully considered. In order to improve the quality of the grid, the geometric model of the centrifugal blood pump was properly simplified without considering the volume loss. In addition, there were some errors in the measurement during the experiment.
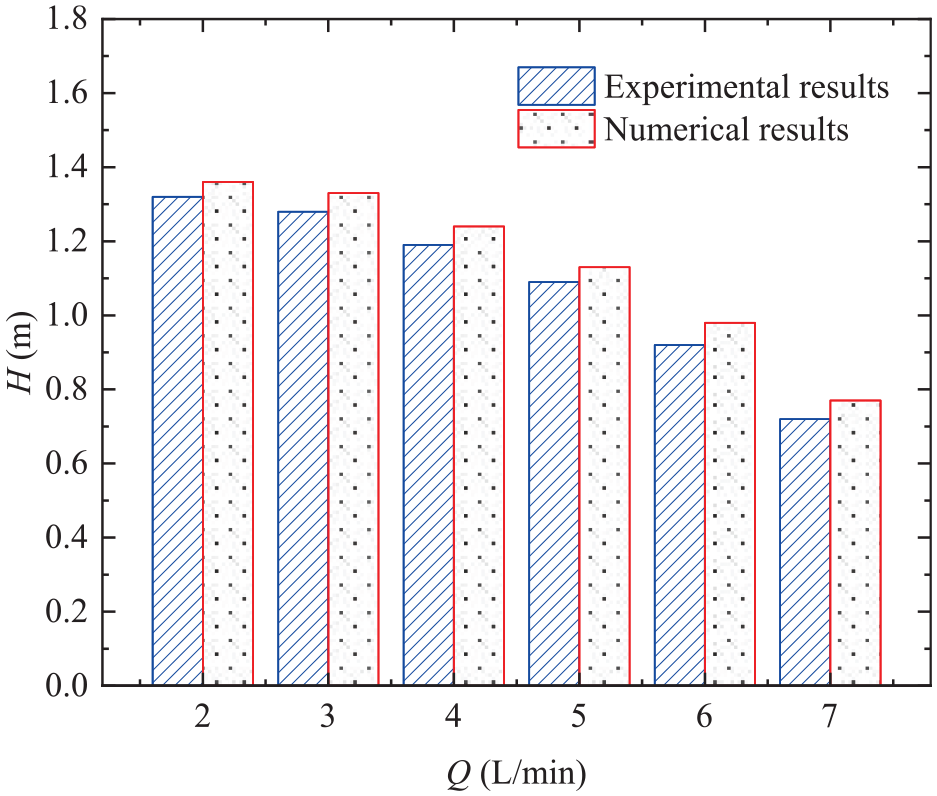
Head obtained by experiment and simulation.
Comparison of the internal flows
Figure 9 shows the velocity contour and the flow trajectory near the volute outlet area of the centrifugal blood pump under the rated condition. Due to the sudden increase of the volute section and the influence of the volute tongue, the blood flow at the volute outlet is more complex. It can be found from the figure that backflow occurs at this position, and the flow velocity in the backflow area is low.

Velocity contour and the flow trajectory (m/s).
Through visualization experiments, the trajectory of particles was obtained. Observed were four typical particles, which were numbered 1, 2, 3, and 4 accordingly. As demonstrated in Figure 10, the longer the track of a particle, the greater its velocity. Using the i-SPEED software suite, the velocity magnitude was determined by measuring the length of the track of four tracer particles over the same time interval. The values are 0.51, 0.43, 1.32, and 2.06 m/s, which are comparable to the values at the same location in Figure 9. Simultaneously, it can be noted that the experimentally determined track of the tracer particles is relatively consistent with the numerical simulation’s flow field trajectory. In light of this, it can be concluded that, given the conditions of this study, the numerical simulation may effectively substitute the experiment when studying the internal flow field of the centrifugal blood pump.

Tracer particle trajectory.
Analysis of internal flow of the centrifugal blood pump
Change rule of the head and flow rate with time
During the operation of the centrifugal blood pump, fluctuation curves of the head and flow rate in a heartbeat cycle are shown in Figure 11. It can be found that during the period of 0–0.04 s, the time-averaged head gradually increases with the slow decrease of flow rate. During 0.04–0.38 s, the flow rate increases rapidly with time, and then decreases rapidly. The time-averaged head decreases rapidly at first and then increases rapidly. The fluctuation amplitude of the head also increases with the increase of flow rate. At 0.18 s, the flow rate reaches the maximum value. At this time, the time-averaged head reaches the minimum value, and the fluctuation amplitude is maximum. During 0.38∼0.55 s, as the inlet flow rate rises slowly, the time-averaged head gradually decreases, and the fluctuation amplitude of the head curve gradually increases. During 0.55∼0.8 s, the trend of flow rate with time is relatively gentle. At this time, the time-averaged head and the fluctuation amplitude of the head curve also maintain a relatively stable state. From the fluctuation curve of the head with flow rate, it can also be judged that the change of flow field in the pump is timely, and the centrifugal blood pump can meet the pressure required for normal human blood delivery under the condition of fluctuating flow throughout the heartbeat cycle. When the rotating speed is a fixed value, the energy obtained by blood per unit volume decreases due to the increase of flow rate, and the pump head decreases accordingly. Therefore, under the working condition of this study, the head is inversely proportional to the flow rate.

Fluctuation curves of head and flow rate in a heartbeat cycle.
Pressure change in the centrifugal blood pump
Pressure change at sections I to VIII of the volute
The pressure in the pump was analyzed at four time points: t = 0.04, 0.18, 0.38, and 0.55 s. Figure 12 shows the pressure distribution at the middle section of the volute and impeller at different times. In order to reduce the influence of blade phase angle on the research results, the flow field in the pump under the same blade phase angle was selected for analysis (the actual time is t = 0.038, 0.1808, 0.3808, and 0.5476 s). From Figure 12, it can be found that the pressure distribution in the centrifugal blood pump changes with the change of inlet flow rate. From the overall pressure distribution of the volute, the pressure at t = 0.18 s is lower than that at t = 0.04, 0.38, and 0.55 s, but the pressure at the volute tongue area is relatively high. This is because when t = 0.18 s, the inlet flow rate reaches the maximum value. When the rotating speed is constant, with the increase of the flow rate, the energy obtained by the unit mass of blood decreases when the blood flows from the impeller to the volute. Therefore, when the flow rate is high, the pressure in the volute area generally decreases. However, when the blood moves circumferentially in the volute under the rotating drive of the impeller, the flow channel section at the volute tongue suddenly decreases, causing the blood to impact the volute tongue. With the increase of the flow rate, the impact force on the volute tongue also increases, so the pressure in the volute tongue area is high when the flow rate is high.

Pressure distribution in the centrifugal blood pump at different times (Pa). (a) t = 0.04 s, (b) t = 0.18 s, (c) t = 0.38 s, and (d) t = 0.55 s.
Within the working conditions in this study, the changes of the internal pressure and velocity in the volute are mainly related to the blade-volute tongue interference, the sectional area of the volute and the flow rate. In the process of numerical simulation, the pressure at the monitor points of sections I to VIII was monitored over time, and the trend is shown in Figure 13. When blood flows in the volute, it will impact the volute tongue, which will increase the complexity of the flow in this area, and also increase the amplitude of pressure fluctuations. It can be observed from Figure 13 that the fluctuation amplitude of pressure decreases first and then increases from monitor point vm1 to monitor point vm8-3. This is because the monitor points vm1 to vm8-3 are gradually away from the volute tongue and then close to the volute tongue in the counterclockwise direction, so the influence of the volute tongue on these monitor points also changes accordingly. This trend is particularly obvious when the flow rate is high (when t = 0.18 s). As the flow rate increases, the impact of blood on the volute tongue also increases, resulting in a more complex flow in the volute tongue area. Because the monitor point vm1 is closest to the impeller, it is greatly affected by the impeller disturbance. Therefore, the pressure fluctuation amplitude at this monitor point is the largest.
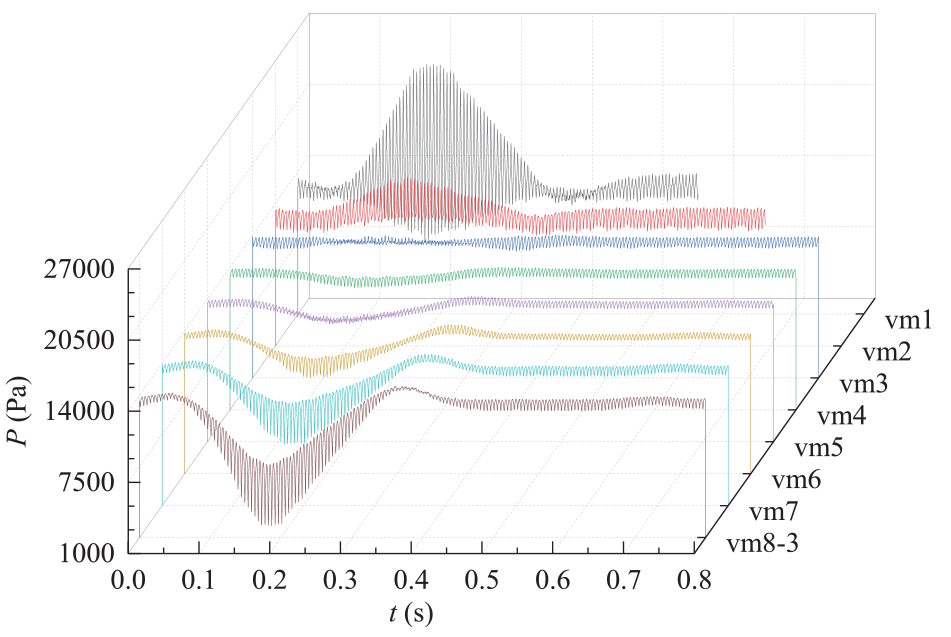
Pressure fluctuation at each monitor point in a heartbeat cycle.
Figure 14 shows the fluctuation curve of pressure at each monitor point in different time periods within a heartbeat cycle. It can be observed that the pressure at each monitor point fluctuates with time, and the fluctuation cycle is the same, about 0.00476 s. This is mainly because the rotating speed of the impeller is fixed. Although the impeller has different effects on the flow field in a certain area of the volute, the impact cycle is the same.

Pressure fluctuation at each monitor point in different time periods. (a) 0.04∼0.09 s, (b) 0.16∼0.21 s, (c) 0.35∼0.41 s, and (d) 0.55∼0.6 s.
It can be observed from Figures 13, 14(a) and (b) that when t = 0.04∼0.18 s, as the flow rate starts to rise, not only the fluctuation amplitude of pressure at each monitor point at the volute changes, but also the time-averaged pressure starts to change significantly. The time-averaged pressure at monitor points vm1 and vm2 began to show an upward trend, and the time-averaged pressure at monitor points vm3 to vm8-3 began to decrease gradually. When t = 0.18 s, with the flow rate reaching the maximum value, the time-averaged pressure at monitor points vm1 and vm2 reaches the maximum value, and the time-averaged pressure at monitor points vm3 to vm8-3 reaches the minimum value. This is because with the increase of flow rate, the impact force of high-speed blood on the volute tongue area increases, so the time-averaged pressure at monitor points vm1 and vm2 starts to rise. The time-averaged pressure at monitor points vm3 to vm8-3 is less affected by the volute tongue. When the flow rate is high, the time-averaged pressure at monitor points vm3 to vm8-3 decreases successively at the same time due to the influence of the gradual increase of the volute section, as shown in Figure 14(b).
When the inlet flow rate begins to decline, the pressure curve at each monitoring point undergoes a substantial change. As depicted in Figure 14(c), when t = 0.38 s, that is, when the inlet flow is at its lowest, the time-averaged pressure at monitor points vm1 to vm8-3 gradually increases. When t > 0.55 s, the inlet flow rate is stable. Figure 14(d) demonstrates that the time-averaged pressure at each monitoring station remains rather steady over this period. However, the relationship between the time-averaged pressure and the position of the monitoring point is obscure. This phenomenon is due to the fact that the actual flow rate of the centrifugal blood pump was lower than the rated flow rate at this time, and that the volute has a poor ability to convert kinetic energy, resulting in a relatively complex flow in the volute and a relatively complex pressure distribution. And because the flow rate is low, the fluid’s influence on the volute tongue is minimal, hence the volute tongue has less of an effect on the pressure.
Pressure change at section VIII of the volute
Figure 15 shows the pressure trend at each monitor point of section VIII of volute with time in a heartbeat cycle. The trend of pressure at each monitor point with time is basically the same, and the time-averaged pressure is inversely proportional to the inlet flow rate. The pressure at each monitor point in this section fluctuates periodically. The large fluctuation cycle is a heartbeat cycle, which is 0.8 s. The small fluctuation cycle is the time required for the impeller to rotate 60°, which is 0.00476 s.

Pressure fluctuation of each monitor point in section VIII of volute.
Figure 16(a) to (d) shows the pressure change curve of each monitor point on section VIII in different time ranges during a heartbeat cycle. Combined with the pressure change curve shown in Figure 15, it can be found that the pressure fluctuation period and amplitude at each monitor point are similar, and the pressure fluctuation amplitude increases with the increase of flow rate. The time-averaged pressure at each time period drops sequentially from monitor point vm8-1 to vm8-5, as shown in Figure 16, and the pressure at monitor point vm8-5 reduces dramatically. This is because, when blood travels from monitor point vm8-1 to vm8-5, energy continues to be lost, causing the blood pressure to continue to fall. Due to the proximity of monitor point vm8-5 to the volute wall, the shear stress along the wall has a significant impact on the pressure drop at this monitor point.

Pressure fluctuation at each monitor point in section VIII in different time periods. (a) 0.04∼0.09 s (b) 0.16∼0.21 s, (c) 0.35∼0.4 s, and (d) 0.55∼0.6 s.
As the distance between the monitor point and the impeller gradually increases from vm8-1 to vm8-5, the influence of the impeller’s rotational disturbance gradually reduces. Since the volute tongue has the same effect on the pressure fluctuation at each monitoring point in this section, the influence of the impeller rotation disturbance is primarily considered. Therefore, the pressure fluctuation is more complex the closer the monitor point is to the impeller. In addition, the pressure fluctuation at monitor point vm8-1 is more complex than that of other monitor points, which is compatible with reality, as shown by the pressure fluctuation curves of each monitor point at different times in Figure 16.
Velocity change in the centrifugal blood pump
Velocity change at volute sections I to VIII
In a heartbeat cycle, as the flow rate changes with time, the blood velocity will also change constantly. The movement of the blood in the pump is complex. On the one hand, the blood moves with the rotation of the impeller, and on the other hand, the blood continuously flows from the impeller to the volute area. Figure 17 shows the velocity distribution of blood in the pump at different times. It can be seen from Figure 17 that the absolute velocity distribution of the blood in the impeller area is similar in each time period. That is, the kinetic energy obtained by the blood from the impeller inlet to the impeller outlet under the driving effect of the impeller rotation increases continuously, and the blood velocity reaches the maximum at the junction area between the impeller and the volute. When the blood enters the volute area, the velocity starts to decline due to the lack of driving effect of impeller rotation. At t = 0.18 s, the flow rate achieves the maximum value, and the velocity in the outlet pipe of the volute is clearly greater than at previous periods, in accordance with the flow continuity principle. Moreover, the blood flow velocity at the outer edge region of the impeller is now relatively low. This is due to the fact that when the traction velocity remains constant, the relative velocity of the flow in the impeller region increases as the flow rate continues to rise. According to the analysis of velocity triangle, this will cause the absolute velocity of the fluid to decrease instead.

Velocity distribution of the centrifugal blood pump at different times (m/s). (a) t = 0.04 s, (b) t = 0.18 s, (c) t = 0.38 s, and (d) t = 0.55 s.
The trend of velocity with respect to time was monitored on sections I to VIII of the volute, and the velocity change at the monitor points for each section is shown in Figure 18. As a result of the impeller rotation disturbance, the velocity at each monitoring point fluctuates periodically with a cycle of approximately 0.00476 s. Contrary to the link between pressure and flow rate, the velocity change curve of each monitor point in the volute reveals that the change in blood velocity is proportionate to the change in flow rate. According to the continuity principle of flow, when the inlet flow rate increases, the blood flow rate in the volute also increases, therefore the findings of the numerical simulation are consistent with the actual condition. The flow separation phenomenon will occur when the high-velocity flowing blood impacts the volute tongue, resulting in a low-velocity area near the volute tongue. In addition, the increase of flow rate will enhance of flow separation, so the time-averaged velocity of blood at the monitor point vm1 near the volute tongue decreases with the increase of flow rate. At the same time, because the monitor point vm1 is closer to the impeller, the fluctuation amplitude of velocity is relatively large.
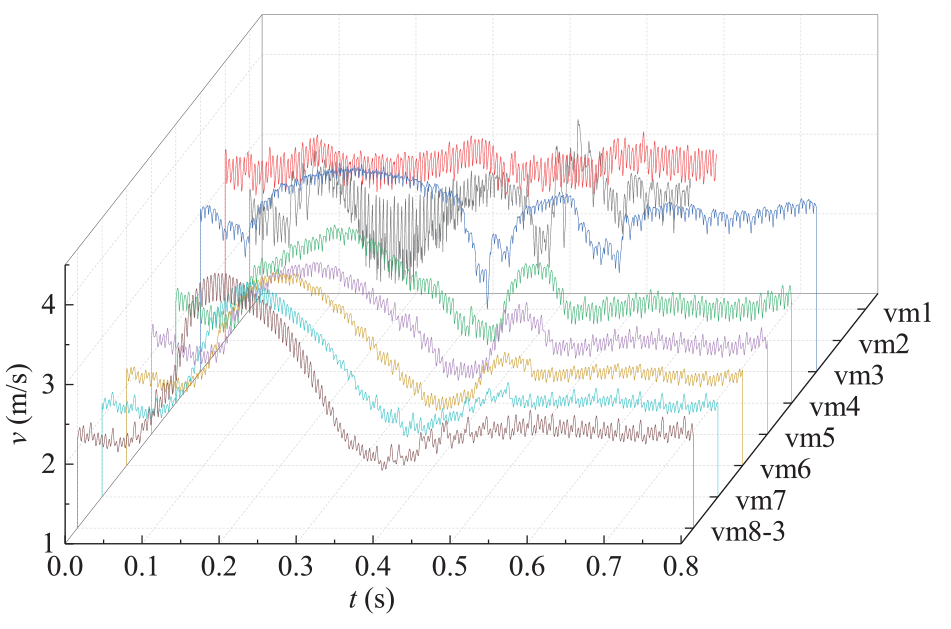
Velocity fluctuation at each monitor point in the volute.
Figure 19 shows the velocity change curve at each monitor point in different time ranges, and Figure 19(a) and (c) show the velocity change with time when the flow rate is low. It can be observed that when the flow rate is low, the change of the velocity curve at each monitor point is relatively complex with the change of the flow rate. However, Figure 19(b) shows that when t = 0.18 s, that is, when the flow rate is high, the velocity change curve at each monitor point has obvious regularity with the change of the flow rate. This is because when the flow rate is relatively low, it does not reach the rated flow of the centrifugal blood pump in this study. The kinetic energy obtained by the unit mass of blood increases under the rotating drive of the impeller. When the blood flows into the volute from the impeller, the velocity is too high, and it is not easy to generate circumferential movement in the volute, which will impact the volute wall surface, making the flow relatively complex. At this time, the sudden increase or decrease in flow rate will also cause the flow in the volute tongue region to change. Under the combined influence of the above factors, the velocity change curve of the monitor points at each section of the volute is more complex when the flow rate is low.

Velocity fluctuation at each monitor point in the volute in different time periods. (a) 0.04∼0.09 s, (b) 0.16∼0.21 s, (c) 0.35∼0.40 s, (d) 0.55∼0.6 s.
When the inlet flow rate is relatively stable, the change of time-averaged velocity at each monitor point in the volute is relatively small, as shown in Figure 19(d). However, because the flow rate is relatively low at this time when the blood flows from the impeller to the volute area, there will be multiple high-velocity areas in the volute due to the relatively high velocity. Because some monitor points are not in the high-velocity area, the time-averaged velocity of the blood from the monitor point vm1 to vm8-3 is sometimes high and sometimes low, with no regularity. The monitor points vm1 and vm2 are close to the impeller, so the velocity fluctuation amplitude is also large. Moreover, according to the comparison between the fluctuation curve of blood velocity at monitor point vm1 shown in Figure 19(b) and (d), it can be found that the fluctuation amplitude will be greater when the flow rate is higher.
Velocity change at section VIII of the volute
Figure 20 shows the blood velocity change over time at each monitor point in section VIII of the volute in a heartbeat cycle. The trend of velocity with time at each monitoring point in this section is similar to that of the flow rate with time. In this section, since the distance between the monitor point vm8-1 to vm8-5 and the impeller is getting farther and farther, the impact of the blade rotation disturbance is gradually reduced. Therefore, the amplitude of blood velocity fluctuation from monitor point vm8-1 to vm8-5 decreases in turn.

Velocity fluctuation at each monitor point in section VIII in a heartbeat cycle.
In order to better reveal the blood flow rule in this section, the velocity changes at different times during the heartbeat cycle were analyzed. Figure 21 shows the change curve of blood velocity at each monitor point on section VIII of the volute. It can be observed that at different times, because of the proximity to the impeller, the fluctuation amplitude of blood velocity at monitor point vm8-1 is the largest, and the periodic fluctuation of velocity is more complex. In addition, due to the driving effect of impeller rotation on blood, the time-averaged velocity value of blood at this monitor point always remains relatively stable and is less affected by the flow rate. From monitor point vm8-2 to monitor point vm8-5, the pressure of the flow field gradually decreases, resulting in the gradual increase of the time-averaged velocity of the blood. Figure 21(a), (c) and (d) show the velocity fluctuation curve at each monitor point when the flow rate is low, and Figure 21(b) shows the velocity fluctuation curve at each monitor point when the flow rate is high. Through comparison, it can be found that when the flow rate is low, the time-averaged velocity of blood at each monitor point in this section is relatively low, which is consistent with the flow continuity principle.

Velocity fluctuation at each monitor point in section VIII in different time periods. (a) 0.04∼0.09 s, (b) 0.16∼0.21 s, (c) 0.35∼0.4 s (d) 0.55∼0.6 s.
Conclusion
(1) There are two cycles of pressure fluctuation and velocity fluctuation in the pump. One is the heartbeat cycle, which is 0.8 s. This cycle is related to the change of flow rate. Another is the blade rotation cycle, which is about 0.00476 s. This cycle is related to the rotating speed of the impeller and is mainly affected by the dynamic and static interference between the blade and the volute tongue.
(2) When the rotating speed of the centrifugal blood pump is constant, the change rule of the head and flow rate of the centrifugal blood pump with time is opposite in a heartbeat cycle. At the same time, within the fluctuation range of the blood flow rate, the pressure in the volute generally decreases, and the velocity generally increases with the increase of the flow rate. The volute tongue’s influence on the pump’s flow field was studied. The results show that the blood will impact the volute tongue area, and the impact will increase with the increase of the blood flow rate. This will cause the pressure of the flow field in the volute tongue region to increase and the velocity to decrease, and the fluctuation amplitude of pressure and velocity will also increase. In addition, by observing the fluctuation of blood pressure and velocity at each monitor point in the pump, it can be found that the closer to the volute tongue, the greater the fluctuation amplitude of pressure and velocity.
(3) Since the centrifugal blood pump does not reach its rated flow rate, when the blood flow rate is low, the pressure and velocity change curve of the blood in the volute is relatively complex compared to the flow field characteristics of the pump at a high flow rate. If the flow rate fluctuates constantly at this time, it will further increase the complexity of the blood flow inside the volute.
(4) In section VIII of the volute, with the change of blood flow rate, the trend of pressure and velocity with time at each monitor point is the same. However, due to the influence of impeller rotation disturbance, the fluctuation amplitude of pressure and velocity in the flow field near the impeller is relatively large, and the periodic fluctuation curve will be more complex. At the same time, with the increase of the distance from the impeller, the time-averaged pressure gradually decreases, and the time-averaged velocity gradually increases. Near the impeller, the blood will be affected by the rotating drive of the impeller, so the time-averaged velocity in this area will remain relatively stable.
Footnotes
Appendix
Handling Editor: Jianjun Feng
Declaration of conflicting interests
The author(s) declared no potential conflicts of interest with respect to the research, authorship, and/or publication of this article.
Funding
The author(s) disclosed receipt of the following financial support for the research, authorship, and/or publication of this article: The work was supported by the National Natural Science Foundation of China (Grant No. 51306087), the Natural Science Foundation of Jiangsu Province of China (Grant No. BK20191361), and Postgraduate Research & Practice Innovation Program of Jiangsu Province (Grant No. KYCX24_1613)