
Abstract
Flexural behavior of a concrete slab system with an optimal weight-to-strength ratio comprising layered and hollow-core slab structures was investigated using two-layered slabs with hollow cores (LS/HCS). Six slabs with dimensions of 180, 450, and 1600 mm were tested experimentally and numerically using ANSYS software. Each layered slab comprises a 90-mm-thick lightweight concrete bottom layer and a 90-mm-thick high-strength concrete top layer. Three parameters were studied: core diameter (58, 86, and 110 mm), reinforcement ratio (0.37%, 0.53%, 0.95%), and treatment type (bonding agent, nails). Treatment types were analyzed via push-out testing; both nails and agents connected the slabs with sufficient bond strength. A control slab with 86-mm core diameter, shear-span-to-effective-depth ratio of 4, reinforcement ratio of 0.53%, and agent material was used. Concrete, steel bars, and loading support plates were modeled using SOLID65, LINK180, and SOLID185 elements, respectively. Analytical results were validated experimentally. A parametric study analyzed other parameters affecting LS/HCS behavior, including compressive strength, opening numbers, core shape, applied loading type, added top steel reinforcement, slab type, and slab height. Core diameter reduction, increased reinforcement ratios, and using nails enhanced the failure load. The LS/HCS gives an optimum weight-to-strength ratio with a 33.672% reduction compared with solid slabs.
Introduction
Bubbled slab, waffle slab, and hollow-cored slab (HCS) structures are commonly applied to reduce the weight of large-span-length slabs. 1 The HCS system was developed in the 1950s and is still widely used in long-span structures such as discount stores, semiconductor factories, and distribution centers.2,3 Polyvinyl chloride (PVC) pipes are used to provide longitudinal voids in the HCS structure. The type and diameter of these voids affect the structural behavior of the slab and can reduce its weight by up to 24%; in addition, the voids can be used for mechanical and electrical runs. 2 Use of an HCS system offers many advantages, including reduced overall weight and cost, easier free space partitioning, the ability to use polystyrene foam to fill voids for thermal and sound insulation, the capacity of the high-strength HCS to bear heavy loads, ease of use for mechanical, electrical, and plumbing services, and reduced vibration when HCS structures are used in tall buildings.4–8 The flexural performance of the HCS has been studied with respect to several different parameters, and the results indicate that the maximum load and deflection of a circular HCS are greater than those of a square-shaped HCS; in addition, increasing the compressive strength improves both the ultimate and cracking loads of the structure; the ultimate capacity improves and the deflection is reduced for these slabs when tested under uniform loads when compared with slabs tested under two-point loads; and elimination of the top steel reinforcement also reduces the ultimate load. 9 The behavior of a bubbled slab with dimensions of 1850×460×110 mm3 was studied when recycled plastic balls were used to prepare the bubbles, and the results illustrated that the stiffness reduction factor of the bubbled slabs was approximately 0.87, which reduced its failure load; the cracking load was also reduced simultaneously by increasing yield deflection, and use of plastic balls weighing 1 kg eliminated 460 kg of concrete, thus reducing material consumption. 10 A hybrid HCS with two ultra-high-performance concrete sides that was cast without any steel reinforcement (RFT) established satisfactory flexural strength and its structural performance remained linear up to the ultimate cracking load, with improved ultimate deflection. 11 Increasing the slab depth or the topping layer thickness of a prestressed HCS improved its ultimate deflection and load; additionally, the interface bond strength between the topping and the slab was found to be more than 2 MPa, which indicates that an effective bond can be created by roughening the surface at the interface. 12
Continuously graded concrete and layered concrete are two types of functionally graded nonhomogeneous concrete that can be cast in the same section. 13 Use of different types of concrete with different properties in layered elements can provide material consumption savings of up to 40% while also providing acceptable strength.14,15 Appropriate arrangement of the cross-sectional layers in layered elements can lead to perfect physical and mechanical properties. 16 Two-layered sections with normal concrete (NC) in the tensile area and high-strength concrete (HSC) in the compressive area were investigated.17–20 These layered systems can be used to form bridge decks, floors, structural roofing, and walls. 21 The effects of varying the layer depth and the strength of the concrete in a two-layered section with an NC layer and a high-performance concrete (HPC) layer have also been studied. 22 The layer depth and the reinforcement ratio both have major effects on the bonding strength between the concrete layers. 23 The flexural strength of the two-layered beam increased nonlinearly with increasing layer thickness.24,25 The compressive strength of a layered section is close to that of the weakest material in the section, and the layered section stiffness is the average of the values of the two materials used. 26 Increasing the layer thickness also enhanced the maximum strength of the layered section. 27 The maximum strength of a four-layered section was more than 50% higher than that of a corresponding single-layered section. 28 The ductility index of a layered section was also more than that of a section with only one concrete layer. 29 Although their flexural load capacities are approximately similar, the deflection of a layered section is reduced when compared with that of a monolithic section. 30 The finite element method (FEM) is regarded as one of the most popular numerical methods for investigation of crack growth and coalescence. 31 Use of a lightweight aggregate fibrous concrete bottom layer with a normal-density concrete topping layer in two-layered beams reduced the beam weight by 42% when compared with a single-layered beam formed using normal-density concrete with similar bending resistance. 14 Replacing the cement in the bottom layer of a two-layered beam with 35% fly ash saved on cement consumption while maintaining both acceptable durability and strength properties. 15
Over the last 30 years, HSC has been used commonly in different fields of construction, including long-span bridges and tall buildings. 32 According to IS 456-2000, HSC with a compressive strength of more than 110 MPa has been used for prestressed and cast-in applications, but HSC has recently become well-known as a concrete with compressive strength of approximately 250 MPa, depending on the pozzolanic materials used. 32
Three types of lightweight concrete have been produced: no-fines concrete, aerated concrete, and lightweight aggregate concrete (LWAC). 33 Lightweight concrete is commonly used because of advantages that include savings on reinforcements, scaffolding, and overall costs, in addition to its superior fire, heat, sound, and frost resistance capabilities.
From well-known reviews of the field, many studies have investigated the structural behavior of HCS systems only or layered slab (LS) systems only with various parameters, but there has been little research into this new two-layered slab with hollow cores (LS/HCS) system. In this work, six specimens were concreted to investigate the flexural performance of an LS/HCS system with an optimal weight/strength ratio. Push-out samples were combined to determine the most suitable bonding method for the two-layered slab. Cracking and failure capacity, cracking and ultimate deflection, the load-deflection curve, ductility, energy absorption, failure modes, strain characteristics, and crack patterns have been discussed for the two-layered slabs in this study. The findings obtained using ANSYS software were similar to those from the experimental studies. Another sixteen models were developed to investigate additional parameters that can affect the behavior of the LS/HCS, including the upper and lower concrete compressive strengths, the number of openings in the structures, the core shape, the applied loading type, the addition of a top steel reinforcement, the slab weight, and the slab height.
Research significance
The HCS is commonly used to reduce the weight of structures by reducing their cross-section.
The LS system is commonly used to combine the advantages of multiple concrete types within the same structure. The LS system can be used to reduce the overall weight of a structure by using lightweight concrete.
This study investigated the reduction in self-weight caused by both the cross-sectional area when using longitudinal voids and the material when using a lightweight concrete layer in a new system composed of a two-layered slab with hollow cores (LS/HCS) to attain a slab system with an optimal weight/strength ratio that reduces both construction costs and cement consumption. Then, the flexural behavior of this system was studied experimentally and numerically using different parameters.
Application of HSC in the compressive area of a layered section is mandatory to resist bending moments with higher values, while the economic benefits of increased strength must also be considered.
Use of lightweight concrete (LWC) in the tensile zone can reduce the overall weight of the layered element.
Details of the experimental test
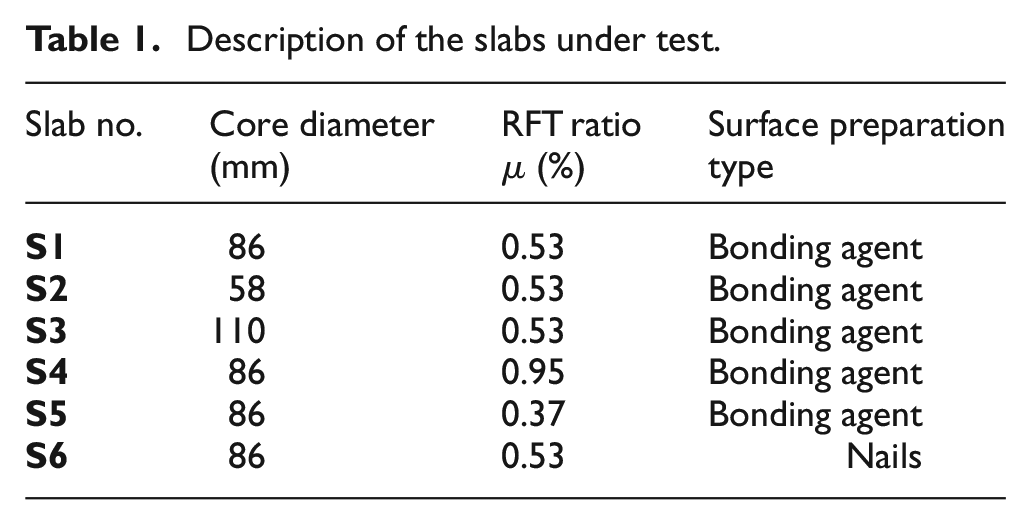
Six full-scale two-layered slabs with hollow cores (LS/HCS) have been cast in this experimental program with variations in three different variables, as listed in Table 1, to study their flexural performance during a four-point loading test.
Description of the slabs under test.
Specimen details
The tested slabs have the same cross-section, with a width, depth, and length of 450 mm, 180 mm, and 1600 mm, respectively, and they span over 1400 mm, as shown in Figure 1. Each specimen consisted of a bottom layer of LWC with compressive strength of 21.8 MPa and a top layer of HSC with compressive strength of 62.5 MPa, and these layers were bonded using either a bonding agent material or nails. The control slab has three circular cores with the same diameter of 86 mm and was tested with a shear-span-to-effective-depth (a/d) ratio of 4. Push-out tests were performed on the samples to determine the bond strength (fb) at the interface between the two concrete types used for the LWC and HSC under different surface preparation conditions. The dimensions of the push-out specimens are given in Figure 2.

Dimensions of the slabs under test (S1–6): (a) S1, S4, S5, and S6 with core diameter = 86 mm, (b) S3 with core diameter = 110 mm, and (c) S2 with core diameter = 58 mm (all dimensions are in mm). LWC: lightweight concrete; HSC: high-strength concrete.

Dimensions of the push-out specimens (mm). LWAC: lightweight aggregate concrete.
Material properties and mix design
The specimens examined in this work included a control slab (S1) reinforced using three steel bars with a diameter of 12 mm as a bottom main reinforcement (RFT) with a reinforcement ratio of 0.53%, and with eight bars with a diameter of 10 mm as a bottom secondary RFT with a 20-mm-thick concrete cover. Plain steel bars with a diameter of 8 mm were used as nails to bond the two slab layers together. The arrangement of the net RFT and the nails is shown in Figure 3. Perlite aggregate was used to produce the lightweight concrete. Addibond-65 adhesive was used according to the manufacturer data to connect the new HSC to the old LWC materials of the samples. 34 Table 2 shows the characteristics of the materials used.

Arrangements of (a) net steel reinforcement and (b) nails (mm).
Characteristics of slab materials used.

Mold preparation and casting
For the push-out test, the mold for the samples was arranged from a wooden material. The casting and molding processes for the push-out samples are illustrated in Figure 4.
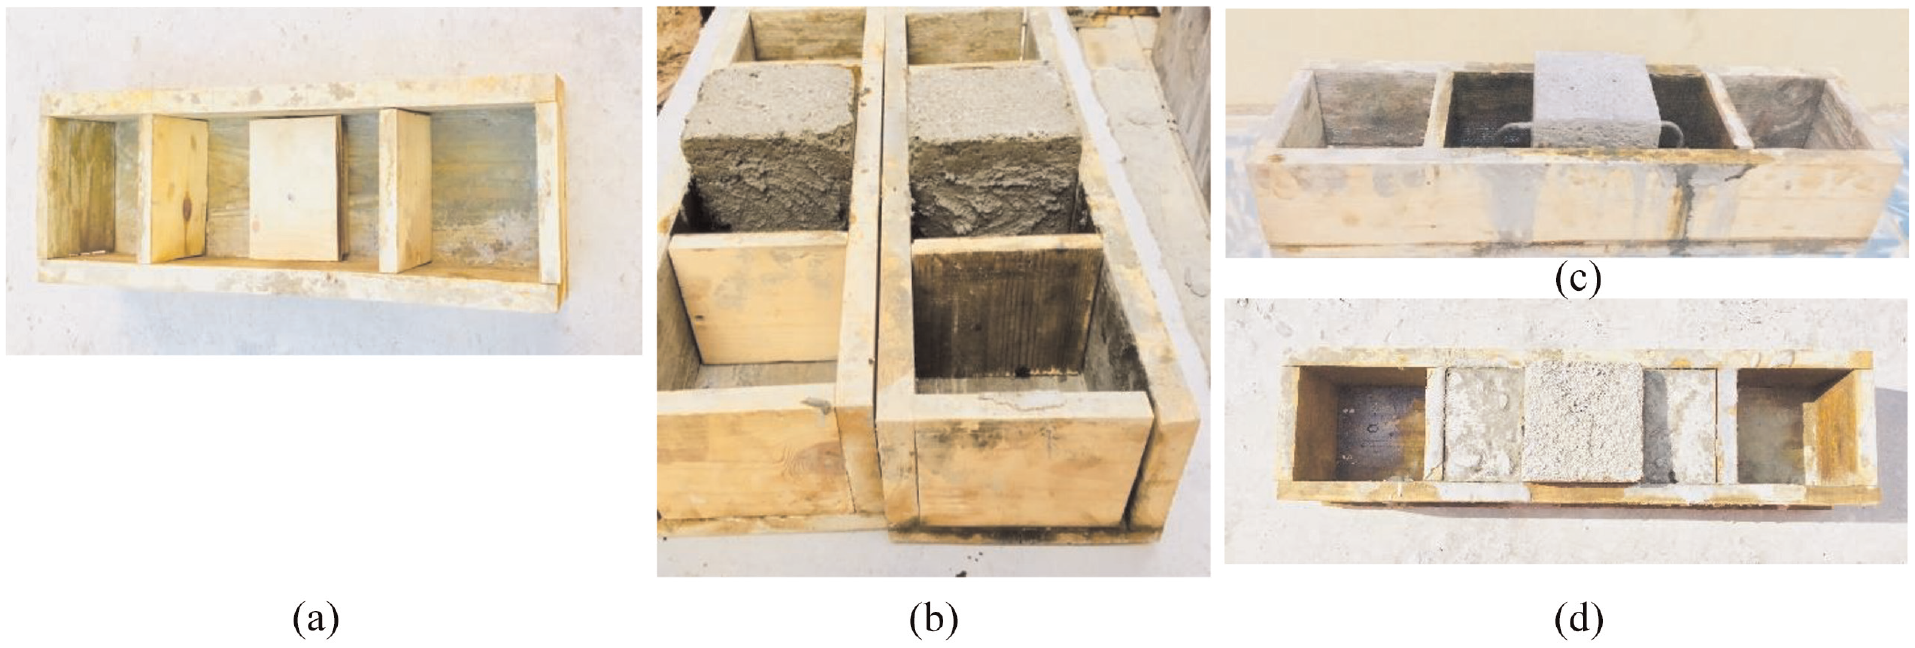
Molding and casting processes for the push-out specimens: (a) timber mold, (b) after casting of the LWC cube with the bonding agent material, (c) after casting of the LWC cube with nails, and (d) after casting of the two HSC rectangular samples.
A slab wooden mold with a thickness of 18 mm was used for casting of the samples. PVC pipes with diameters of 2, 3, and 4 inches were used to prepare the circular cores; these pipes were selected because these pipe diameters were available in the marketplace. In addition, these core diameters satisfy the prearranged ratios for concrete removal. After the surface mold was cleaned and oiled, the PVC pipes were installed longitudinally inside the mold to form the circular hollows and the steel reinforcement mesh was placed inside the mold with or without addition of nails. A concrete cover with a thickness of 20 mm, as measured from the soffit of the slab to the center of the reinforcement bars, was used in all slabs as a protective layer. Casting of the slab samples was performed according to the fresh-on-hardened method. The first LWC layer was cast at the specified thickness (90 mm) and hardened for 24 hours; then, the surface was cleaned and the bonding agent slurry was applied before casting of the upper fresh HSC layer at the specified thickness (90 mm). The specimens were covered and cured for 28 days before testing. The casting and molding processes for the slab specimens are illustrated in Figure 5.
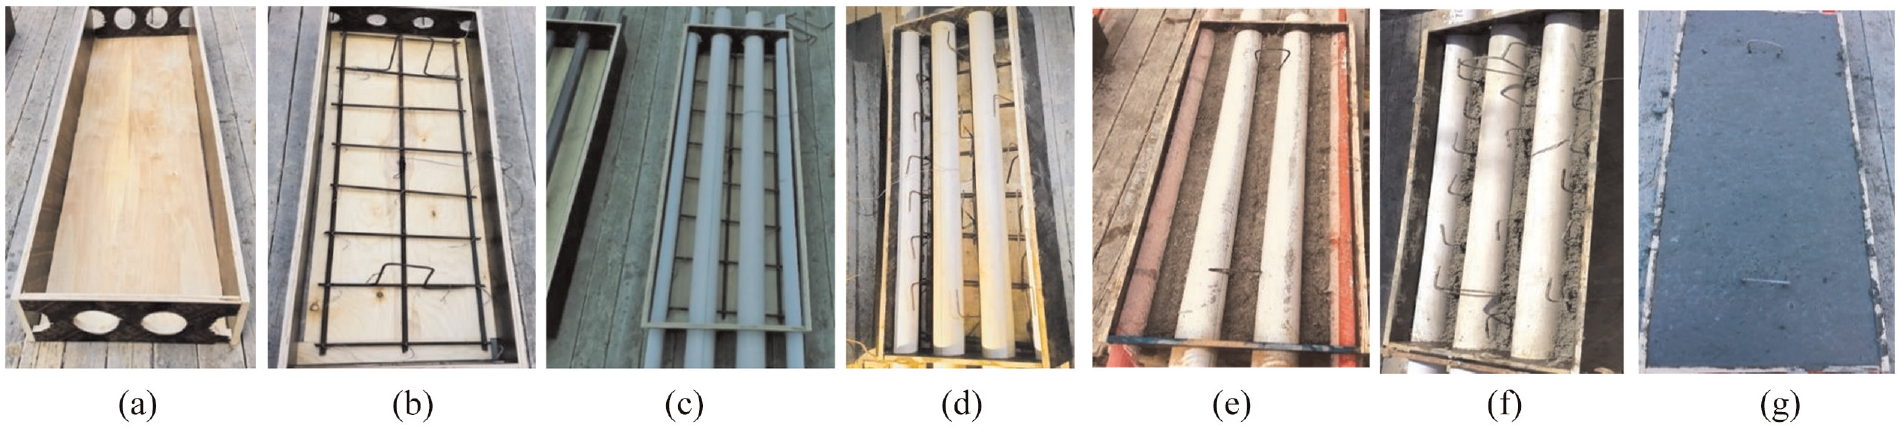
Molding and casting of the test slabs: (a) timber mold, (b) mold with net steel RFT with steel strain installation, (c) mold with PVC pipes and the net steel RFT without nails, (d) mold with PVC pipes and the net steel RFT with nails, (e) after casting of the first layer with bonding agent material, (f) after casting of the first layer with nails, and (g) after casting of the second layer.
Testing of the slab specimens
A hydraulic universal machine was used to examine six simply supported two-layered slabs with hollow cores via a four-point loading flexural test. First, the specimen was installed over two steel supporting plates with a clear span length of 1400 mm; then, two steel circular loading plates were set to apply the loads through a load cell with increments of 5 kN per min, and the bottom mid-span deflection was recorded using a linear variable distance transducer (LVDT) until the failure load was obtained, as shown in Figure 6. A data logger scheme was used to obtain the results required at all loading steps for the measurement instruments. The test configurations for the control slab are shown in Figure 7. Installations of strain gauges to measure the concrete strain in the compression zone (top face of the slab) and the steel strain in the tensile zone (middle bar of the net RFT) are shown in Figure 8.

Slab testing set-up: (a) load cell, (b) LVDT, (c) loading plates, (d) supporting plates, and (e) data logger.

Loading configurations for the control slab.

Strain gauge installations for (a) steel strain and (b) concrete strain.
Finite element model development
The FEM can be used to explain many engineering problems through use of numerous computer programs, such as the ANSYS finite element analysis program. This method is able to simulate reinforced concrete constituent materials as a nonhomogeneous material with a nonlinear effect and can simulate nonmetallic materials. The FEM can also predict and display the cracking patterns of the structure. The ANSYS WORKBENCH software for structural analysis problems was used to analyze the numerical model of the LS/HCS specimen under static loading and perform several parameter studies. The general steps for finite element analysis (FEA) using the ANSYS program are as follows: definition of the material properties; model configuration; application of boundary conditions and loads prior to obtaining the solution; and finally, study of the data obtained.
Model generation
FEA is primarily used for mathematical recreation of physical structures. The numerical model usually includes all elements and nodes, the material properties, the boundary conditions, and the real constants required to simulate the model physical structure. When using the ANSYS program, the model generated in this study contains all processes required to represent the geometric configuration of the elements and nodes of the slab under study.
Types of elements
The LS/HCS specimens were modeled using the following elements:
The eight-node
The 3D
The eight-node
The concrete, steel plate, and steel RFT properties used to develop the FE models are listed in Table 3.
Properties of the materials used to develop the FE models.

Modeling of the reinforced concrete layered hollow-cored slabs
The concrete model was simulated using finite elements by drawing areas in the x-y plane and then subtracting the hollow core areas before extruding them to create the slab size in the z-direction, as shown in Figure 9(a). The reinforcement model was simulated by creating line elements that were connected to the concrete nodes to ensure perfect bonds between the concrete elements and the steel RFT bars, as illustrated in Figure 9(b). Six three-dimensional geometries were created with three different core diameters, two different reinforcement ratios, and two surface treatment types in accordance with the experimental study parameters, and the outcomes were then related to the experimental data.
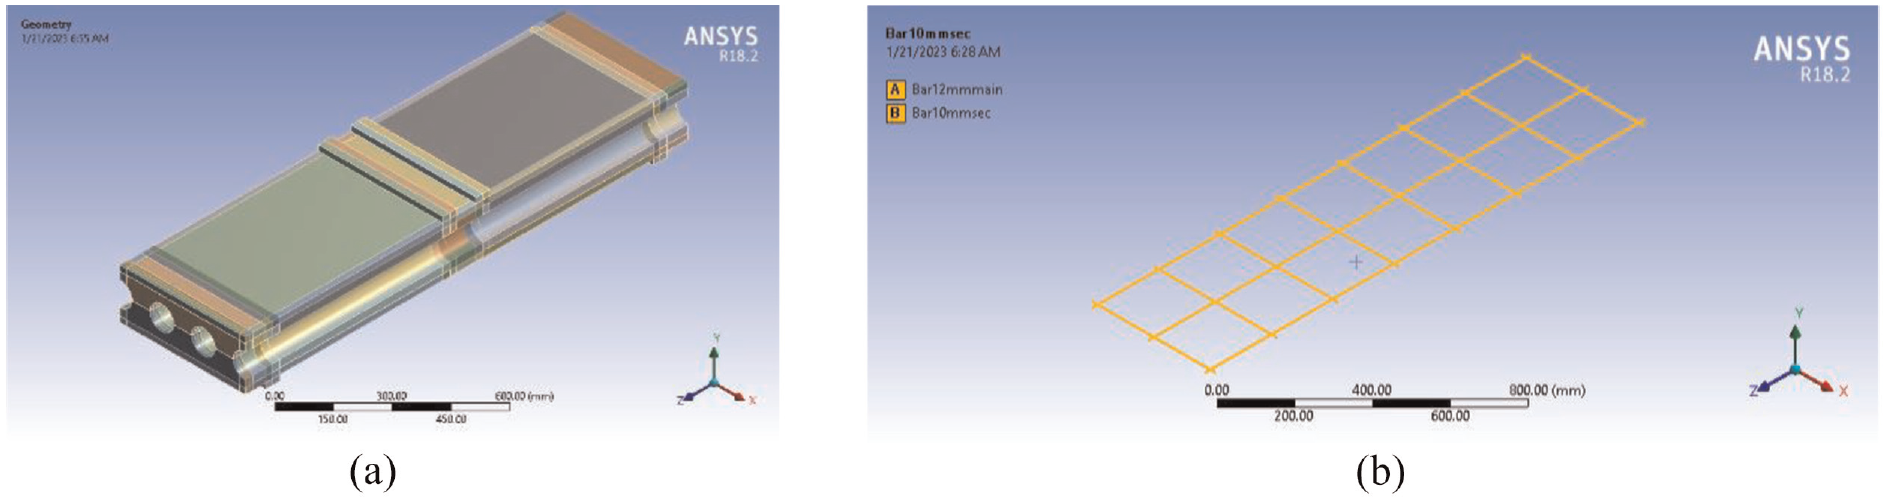
Modeling of (a) the two-layered control slab with hollow cores and (b) the main and secondary reinforcement net bars.
Contact interfaces
Because two surfaces made from different materials are connected to each other in ANSYS, contact interfaces were formed. The following five contact interface options were offered by ANSYS: no separation, and bonded, frictional, rough, and frictionless contact. The bonded contact option was used to model the slabs using a combination of a multipoint constraint (MPC) with a short run time and good convergence. Contact regions are created automatically between every separate body in the ANSYS software and these regions have been defined using the contact and target surfaces. The surfaces of the lightweight concrete layer are the contact bodies, while the surfaces of the high-strength concrete layer represent the target bodies, as illustrated in Figure 10.

Contact interface between the two concrete layers.
Meshing process
Selection of the mesh size is regarded as a primary stage in finite element modeling. Convergence of the results usually occurs when the appropriate number of elements is used in the model; increasing the mesh size has an insignificant effect on the results. The convergence study was performed on the control slab to determine the most suitable mesh size. Three mesh size values of 50, 20, and 10 mm were used, with corresponding numbers of elements of 2776, 17982, and 115695, respectively, and the same boundary conditions, loading, and materials shown in Figure 11. In accordance with the convergence study, 20 mm was selected as the optimal mesh size for analysis of all other slabs by dividing it into 17982 elements using the SOLID65 element for concrete, and reduction of the mesh size increased the simulation runtime. Meshing of the reinforcement was not required because the separate elements were formed by using the LINK180 element, which connected to the concrete element nodes.
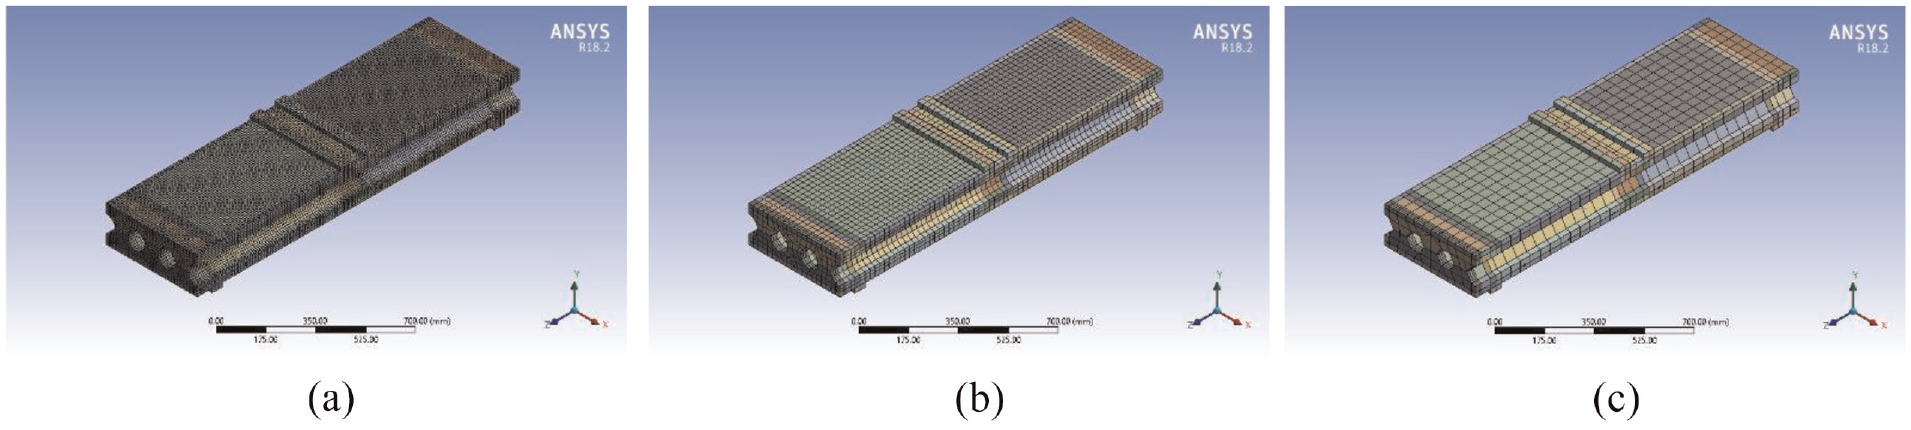
Selection of mesh sizes of (a) 10, (b) 20, and (c) 50 mm.
Loading and boundary conditions
To verify that the FE model duplicates the experimental boundary conditions of the sample, boundary conditions were applied at two steel plate supports with dimensions of 450×50×20 mm3 using the SOLID185 element, which was placed below the slab to avoid stress concentration and prevent concrete local failure. The two supports were modeled together as a hinged support by taking the displacement degrees of freedom values for the X, Z, and Y directions to equal zero. Hinged supports have the ability to resist both horizontal and vertical loads while also satisfying two equilibrium equations. A four-point loading mechanism with two loading points and two support points was used to model the static structural system, as shown in Figure 12. The displacement conditions were required to constrain the finite element model and obtain a single solution. A vertical displacement load in the Y direction with a magnitude of 20 mm acting along the top face of the two loading plates, which have the same geometry as the supports at a specified support distance, is considered according to the selected a/d ratio. The displacement was applied with slight increments after cracking of the specimen to avoid convergence problems until slab failure occurs.
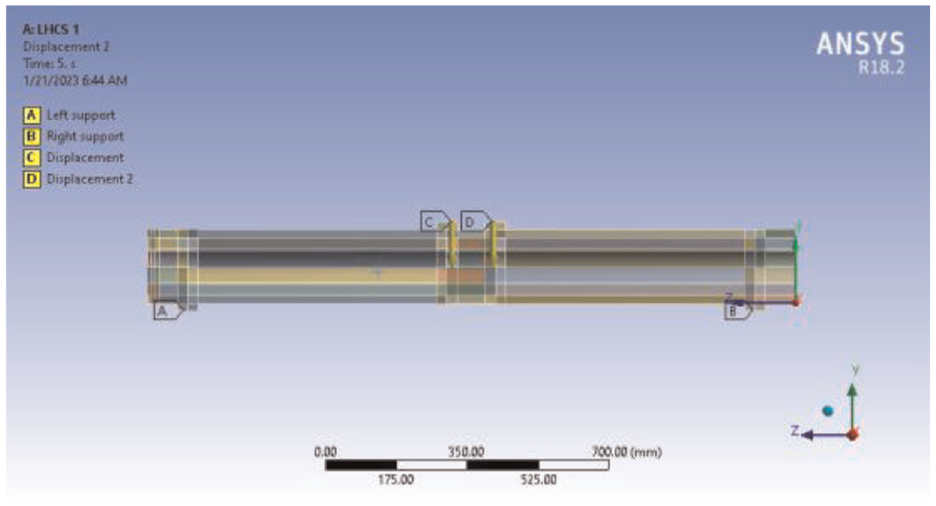
Slab static loading and boundary conditions.
Analysis termination criterion
In this study, the total load is generally applied as a sequence of load increments called “load steps,” as required by the modified Newton-Raphson method. Convergence was obtained before reaching the maximum of 100 iterations. The initial time step was set at 1 s, with a maximum time step of 20 s. The model failed when convergence failed with large deflection values (signifying rigid body motion).
Experimental and numerical results
The experimental and numerical results are discussed in this section. The failure load (Pu), the mid-span deflection (Δu), the cracking load (Pcr), the cracking deflection (Δcr), the load-deflection curves, the crack patterns, the energy absorption, the ductility ratio, the strain load diagram, and the mode of failure were obtained by testing six slabs. Table 4 compares the numerical and experimental data to confirm the capability of the planned numerical simulation with respect to the examined slabs, and other parametric parameters were then studied numerically based on the flexural performance of these samples. The experimental data agreed well with the numerical data, with a maximum 10% difference. The numerical ultimate capacity represents the failure load prior to divergence, and the numerical ultimate deflection represents the Y-direction mid-span deflection.
Experimental and numerical results for the tested specimens.

RFT: reinforcement; Pcr: cracking load; Pu: failure load; Δcr: cracking deflection; Δu: mid-span deflection; FEM: finite element method
Results for bond strength test
Specimens treated with nails or a bonding agent showed good bond strength values of 1.73 MPa and 1.67 MPa, respectively, and damage in the form of a crack passed through the LWC cube without any particle failure; therefore, these methods are considered to be suitable surface treatments for use in the tested slabs. Specimens that were treated with friction on the surface only, without any other treatment method, showed a bond strength value of 0.84 MPa (not more than 1 MPa) and failed by separation at the interface; therefore, that method is not considered an appropriate surface treatment. The results of bond strength testing are given in Table 5.
Bond strength test results.

Failure load of the slabs
The data given in Table 4 indicate that increasing the core diameter to 110 mm reduced the failure load by 23.40% because it reduced the section moment of inertia, whereas reducing the core diameter to 58 mm increased the failure load by 11.14% when compared with the control slab with the core diameter of 86 mm. Increasing the reinforcement ratio to 0.95% increased the failure load by 8.0% because of the increase in the stresses, and reducing the reinforcement ratio to 0.37% reduced the failure load by 30% when compared with the control specimen with a reinforcement ratio of 0.53%. Use of nails enhanced the failure load by 5.8% when compared with that of the control sample with the bonding material because of the good bond formed between the two concrete layers that prevents horizontal sliding.
Mid-span deflection of the slabs
As indicated in Table 4, increasing the core diameter to 110 mm reduced the mid-span deflection by 42% and reducing the core diameter to 58 mm increased the mid-span deflection by 37% when compared with the control slab. Increasing the reinforcement ratio to 0.95% increased the mid-span deflection by 56.6% and reducing the reinforcement ratio to 0.37% reduced the mid-span deflection by 28% when compared with the control slab. Use of nails increased the mid-span deflection by 97% when compared with the control specimen using the bonding material. The results show that the experimental data for the deflections were almost all within the same range until the appearance of the first crack. This occurred because the topping layer acted as part of the slab and thus no shear slip occurred during application of the load as a result of the appropriate treatment of the bottom slab surface at the interface with the topping layer.
Load deflection curves of the slabs
The numerical and experimental load-deflection curves are illustrated in Figure 13. As expected, there were three stages for the curves, which initially showed an elastic relationship until the occurrence of the first cracking load; then, they showed a pseudo-elastic relationship, and finally showed a plastic relationship until occurrence of the failure load. The control slab behaved as an under-reinforced section. The first crack in this slab appeared at the 8.9 kN loading point, and the load-deflection curve then extended to reach its failure load of 34.1 kN after yielding of the reinforcement. The load-deflection curves for the slabs treated with nails are stiffer than those obtained with bond materials with a good composite action among the layers. The numerical and experimental load-deflection comparisons confirmed the accepted relationship among these parameters for all loading steps. The numerical models are used to calculate the vertical displacement as a mid-span deflection in the Y-direction at the lower face of the slab. The analytical simulation predicted acceptable results and it can thus be used to perform future parametric studies. It is obvious from the results that all slabs performed similarly, with slight variances in their ultimate deflection values. Figure 14 compares the slab core diameter with the slab’s weight and ultimate capacity, and the results show that the optimum hole diameter for such layered systems is approximately equal to 81 mm, where the increasing value of the ultimate capacity equals the decreasing value of the slab weight at the point of intersection between the two relationships. The deflection contour of the control slab is shown in Figure 15.

Comparison between numerical and experimental load-deflection curves with (a) core diameter variation, (b) reinforcement ratio variation, and (c) surface treatment type variation.

Core diameter versus ultimate load and weight of the slabs.

Deflection contours for the control slab.
Failure mode of the tested slabs
The distances from the loading point to the supports have a significant effect on the failure shape. All the tested specimens showed flexural ductile failure because the tensile stress exceeded the tensile strain value. The first vertical crack began at the bottom slab face. As the applied capacity value increased, additional cracks appeared and developed with a wide range toward the compression zone area with yielding of the reinforcement. After that stage, several cracks propagated in an inclined direction toward the loading point. Finally, the samples were damaged at the flexural failure load value. The FEM analysis predicted similar failure modes.
Crack pattern for the tested slabs
Figure 16 shows the cracking patterns for all slabs. As expected, the main flexural crack for the control slab was observed within the middle third from the lower tension zone for all samples at the area of constant moment. The initial crack divided into two directions, having previously reached the higher slab face, and flexural failures occurred in the tested slabs. No concrete crushing was observed in the compression zone for all specimens, and they showed little sign of damage. The presence of the cores, which lower the moment of inertia significantly, reduces the failure capacity. After failure, cracks were observed at the interface surfaces of the slabs, but no shear slip occurred under the applied loading. A complete composite action among the two slab layers was observed during loading that corresponded to the uncracked state of the slab cross-section, with a linear relationship between the mid-span deflection and the load being observed up to the appearance of the first crack. The ANSYS program showed circles at the cracking concrete position. The numerical simulations predicted similar failure modes to the experimental failure mode.
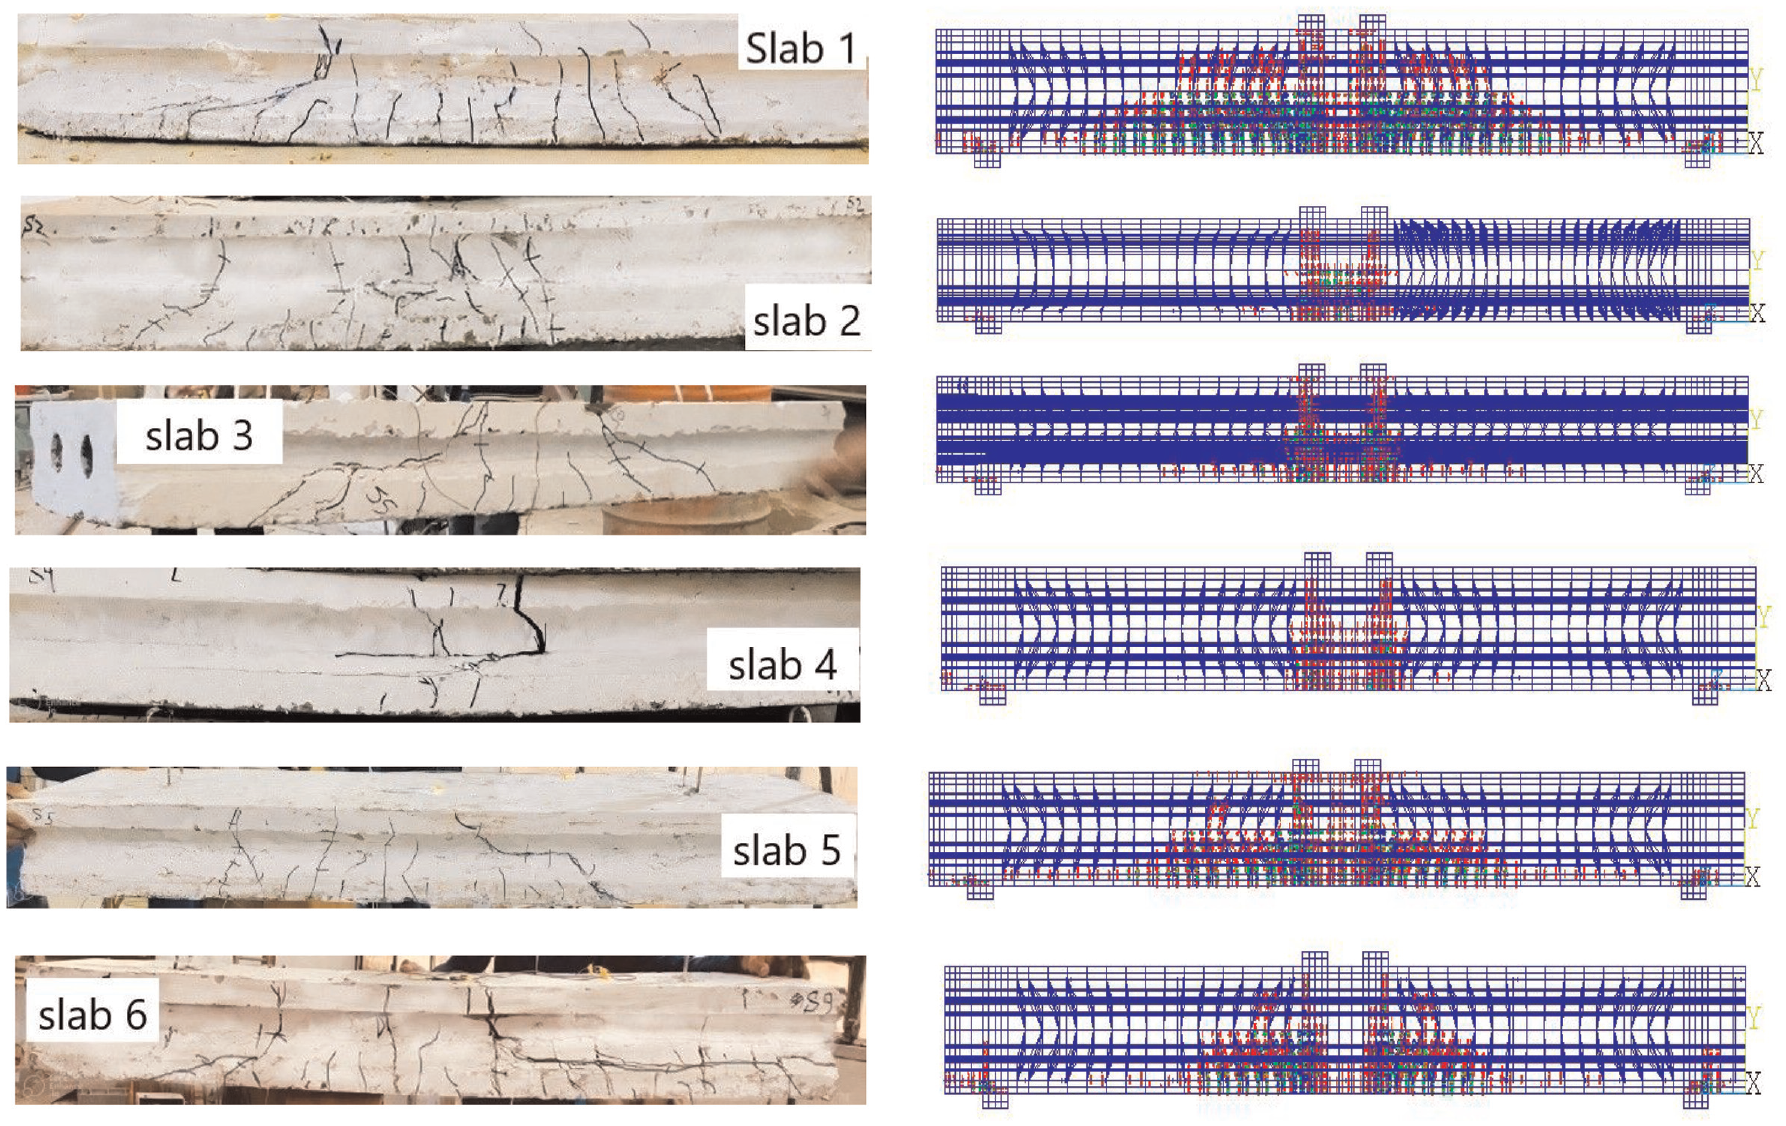
Crack patterns for the tested slabs.
Energy absorption for the tested slabs
The energy absorption or flexural toughness of a structure refers to the capability of that structure to dissipate or absorb input energy from external loads without damaging its component parts. Energy absorption is affected by factors such as the material characteristics, the loading conditions, the connection details, and the structural arrangements. The energy absorption can be determined by calculating the area below the load–deflection curve, as given in Table 4 and shown in Figure 17. The energy absorption of the control specimen was found to be 3444.8 J. It was concluded from the analysis that reducing the core diameter of the slab increased its energy dissipation because it caused an increase in the web of the slab cross-section, which needs to absorb more energy during loading. Reducing the reinforcement ratio also increased the energy dissipation characteristics of the specimen. Specimens that were treated with nails showed a greater increase in the energy absorption value when compared with specimens that were treated with bonding material because of the good bond that occurs at the interface between the two layers, which needs to absorb additional energy during loading.

Energy absorption results for the different slabs.
Ductility of the tested slabs
The ductility ratio of a structure is the capability of that structure to allow increased deflection before fracture occurs. The ductility ratio was determined for each of the specimens by dividing the mid-span deflection value by the cracking deflection value, with results as shown in Figure 18. Using the data given in Table 4, the ductility ratio of the control specimen was found to be 10.7, which is considered to be a good ductility value. It was concluded from the results that reducing the core diameter of the specimens also reduced their ductility ratios. Specimens tested with a 0.53% reinforcement ratio showed more ductile behavior than the specimens that were tested with the 0.37% and 0.95% reinforcement ratios. The specimens that were treated with the nails showed increases in their ductility ratio values when compared with those that were treated using a bonding material because of the sufficient bonding that occurs between the two layers, which act as a single ductile layer.

Ductility ratio results for the different slabs.
Strain load diagram for the tested slabs
The strain of the concrete in the compressive area and the strain of the steel in the tensile area were analyzed with respect to the load, with results as shown in Figure 19. The results showed linear relationships between the strain and the load until the occurrence of the cracking load; then, the strain increased at a higher rate with increasing applied loading until fracture occurred. Reducing the hole diameter of the specimens improves the strain in both the concrete and the steel because it increases their ultimate strength and stiffness. For the control slab, the strain was unclear until the occurrence of the cracking load at 8.9 kN, and the reinforcement then yielded with increasing applied loading before reaching an ultimate strain value of 0.038 mm/mm. Slabs that were treated with nails showed stiffer performances than slabs treated with bonding materials and failed before the yielding of the reinforcement.

Steel and concrete strain characteristics for the slabs under test: (a) with core diameter variations, (b) with RFT ratio variations, and (c) with variation in the surface treatment type.
Parametric study
The numerical data were compared with the experimental data. The comparison showed reasonable agreement of the numerical results with the experimental data. Therefore, the numerical test program was extended further to the study of other parameters by developing and analyzing sixteen additional FE models, with results as shown in Table 6. The calculated data for the models are given in Table 7. Results for the following parameters were obtained for each model: failure load, cracking load, maximum deflection at mid-span, and cracking deflection.
Specimen details for use in the parametric study.

Test results from the parametric study.

Eight parameters were studied, and are described as follows:
The results of changing the compressive strength of the topping concrete layer (HSC) (55 and 50 MPa, as compared with 62.5 MPa).
The results of changing the compressive strength of the bottom concrete layer (LWC) (20 and 19 MPa, as compared with 21.8 MPa).
The effects of changing the number of openings with the same core shape and the same core percentage (four and five openings, as compared with three openings).
The effects of changing the core shape with the same number of openings and the same core percentage (open edge square, circular, and square shapes, as compared with the open edge circular shape).
The effects of different loading types (uniform load, as compared with a concentrated load).
The effect of adding a topping reinforcement (three bars, 10 mm diameter, transverse direction (3Φ10/b) for the main RFT, and eight bars, 10 mm diameter, longitudinal direction (8Φ10/L) for the secondary RFT).
The results of changing the slab type on the weight and on the strength of the tested specimens (solid slab (SS), hollow core slab (HCS), and layered slab (LS), as compared with the LS/HCS).
The effect of changing the slab height (160 and 200 mm, as compared with 180 mm).
Effect of changing the compressive strength of the topping concrete layer (HSC)
As shown in Table 7, when the compressive strength decreases, the stiffness also decreases, the ultimate capacity decreases, and the ultimate mid-span deflection increases. When compared with that of slab S1, the ultimate loads for slabs S7 and S8 decreased by 8.64% and 16.25%, and their ultimate deflections increased by 25% and 48.29%%, respectively. Figure 20(a) shows the load-deflection curves of the slabs under study for various topping concrete compressive strengths.

Load-deflection curve for the slabs under study with (a) variations in the Fcu of the HSC layer and the Fcu of the LWC layer, (b) variations in the number of openings and the core shapes, (c) variations in the loading type and in addition of a topping reinforcement, and (d) variations in the slab type and slab height.
Effect of changing the compressive strength of the bottom concrete layer (LWAC)
As shown in Table 7, when the compressive strength decreases, the stiffness also decreases, the ultimate capacity decreases, and the ultimate mid-span deflections also decrease. When compared with slab S1, the ultimate loads for slabs S9 and S10 are reduced by 8.73% and 22.41%, and their ultimate deflections decrease by 2.6% and 14.18%, respectively. Figure 20(a) shows the load-deflection curves for the slabs under study when their bottom concrete compressive strengths are changed.
Effect of changing the number of openings with the same core percentage and with the same core shape
As the results in Table 7 show, when the number of openings rises, the ultimate load values decrease, whereas the ultimate deflections increase. When compared with slab S1, the ultimate loads for slabs S11 and S12 are reduced by 15.62% and 34.26%, and their ultimate deflections increase by 135.26% and 170.5%, respectively. Figure 20(b) shows the load-deflection curves of the slabs considered here for different numbers of cores with the same core percentage and the same core shape.
Effect of changing the core shape with the same core percentage and same number of openings
The circular core shape has a core diameter of 86 mm, and the square core shape has dimensions of 76.215 × 76.215 mm2. The results presented in Table 7 show that use of S13 reduces the ultimate load by 9.62% and increases the ultimate deflection by 115.5%. Use of S14 reduces the ultimate load by 14.41% and increases the ultimate deflection by 201.17%. Use of S15 reduces the ultimate load by 20.98% and increases the ultimate deflection by 214.95% when compared with S1. The data obtained show that the ultimate capacity and the deflection of slabs with circular holes are greater than the corresponding values for slabs with square holes. This may be the result of a stress concentration occurring at the square corner and of the open edge core providing better results than the other shapes. The load-deflection curves and a comparison with the shapes of the slabs are presented in Figure 20(b).
Effect of changing the loading type
Slabs with a concentrated load were tested in the laboratory because they are easier to simulate than slabs with a uniform load. In this study, the ANSYS program was used to analyze a specimen under a uniform load to simulate the way that the specimen would be loaded on site. The results indicated that slab S16, when tested under a uniform load, can bear a greater load than slab S1 when tested under a concentrated load. The ultimate capacity was improved from 30.93 kN under four-point loading to 43.24 kN under the uniform load conditions, with a reduction in the ultimate deflection of approximately 10.22%, as indicated in Table 7. Therefore, this loading type variable can be regarded as a safety factor when designing such slabs on site. A comparison of the load-deflection curves obtained for slabs tested under concentrated and uniform loads is given in Figure 20(c).
Effect of adding a top layer of reinforcement
The results in Table 7 also show the effects of applying top and bottom steel RFTs. Using a top RFT with a bottom RFT enhanced both the ultimate deflection and load. The ultimate slab capacity increased by 4.95% as a result of the addition of a top RFT. This may be caused by the presence of the top RFT layer, which increases the section moment of the resistance and distributes the stresses around the hole, thus avoiding damage. Use of the top and bottom RFT gives an ideal load-deflection curve for the tested specimen when compared with that of the slab with the bottom RFT only. Figure 20(c) compares the load-deflection curves for the specimens when using either a bottom RFT or top and bottom RFTs.
Effect of changing the slab weight on behavior of the tested slabs
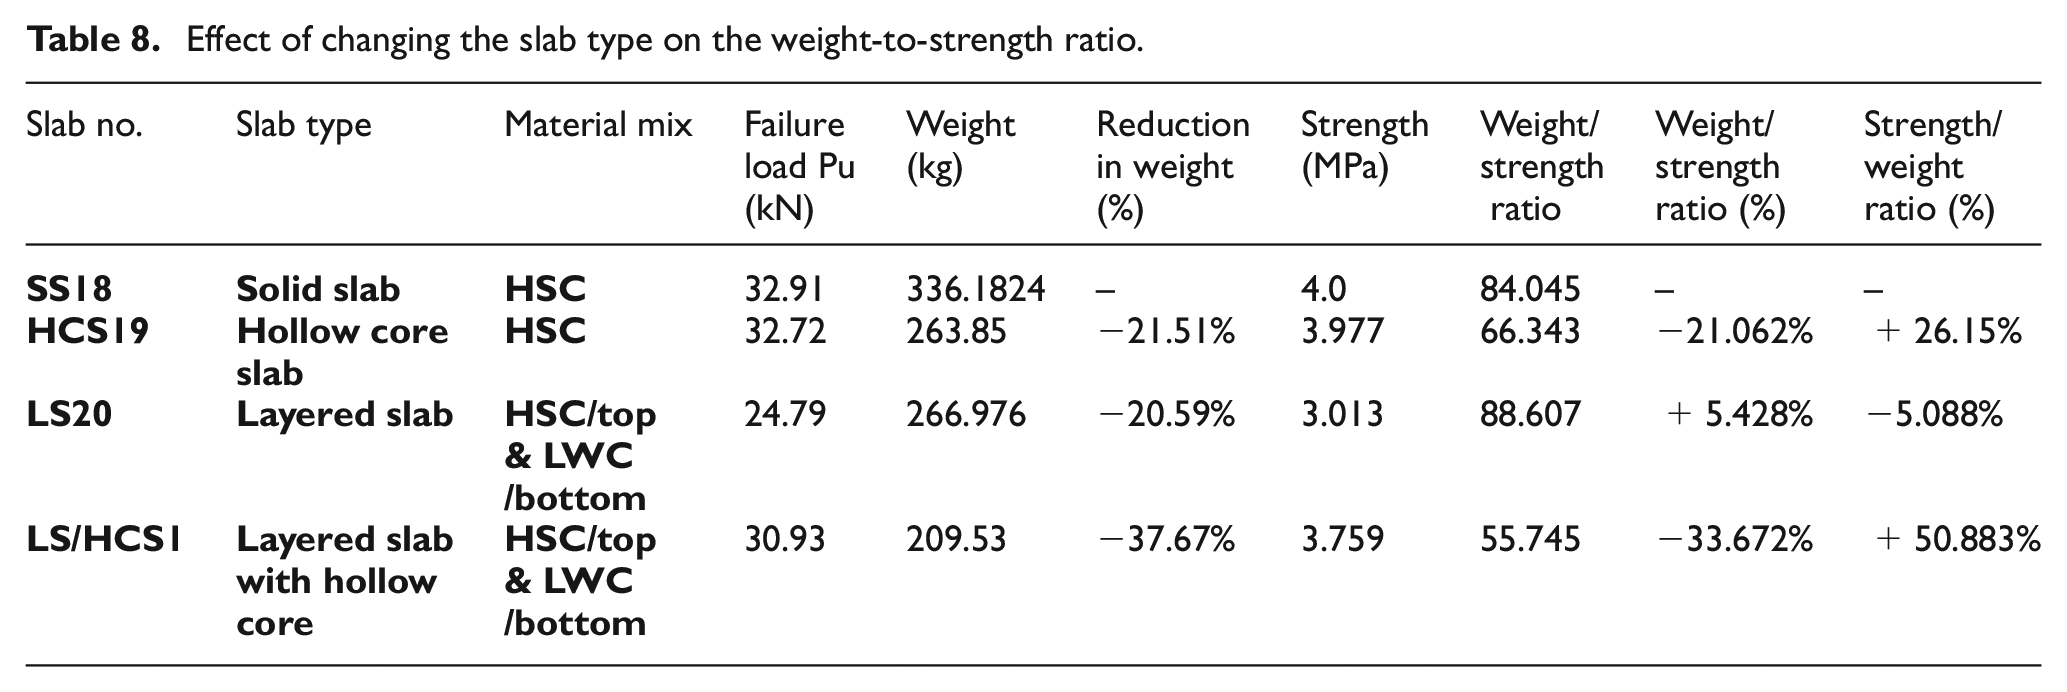
The effects of variation in the slab type on the slab weight and the strength of the test specimens are shown in Figure 21 and Table 8. The effects of the variation in the slab type on the weight-to-strength ratio of the slabs under test are shown in Figure 21. As expected, the weights of samples LS20, HCS19, and LS/HCS1 decreased by 20.59%, 21.51%, and 37.67%, respectively, when compared with that of sample SS18. Reducing the material consumption allows us to accelerate the construction time and reduce the overall cost of the slab. In addition, this approach reduces the dead weight, which allows for fabrication of a smaller building foundation. The strengths of slabs LS20, HCS19, and LS/HCS1 decreased by 24.675%, 0.575%, and 6.025%, respectively, when compared with that of SS18. The LS/HCS1 system gives the optimum weight-to-strength ratio with a reduction of 33.672% when compared with the SS18 solid slab system. Additionally, the HCS19 hollow core slab system showed an acceptable weight-to-strength ratio with a reduction of 21.062%, while the reduction in the strength of the LS 23 layered slab system was very large based on the reduction in its slab weight, although its weight-to-strength ratio was increased by 5.428% when compared with SS18. The load-deflection curves for the slabs under test are shown in Figure 20(d). The bending moment diagram (BMD) and the test arrangements for the SS, HCS, LS, and LS/HCS with a/d=4 are shown in Figure 22.

Effect of variation of the slab type (a) on the weight and strength of the tested slabs, and (b) on the weight-to-strength ratio of the tested slabs.
Effect of changing the slab type on the weight-to-strength ratio.
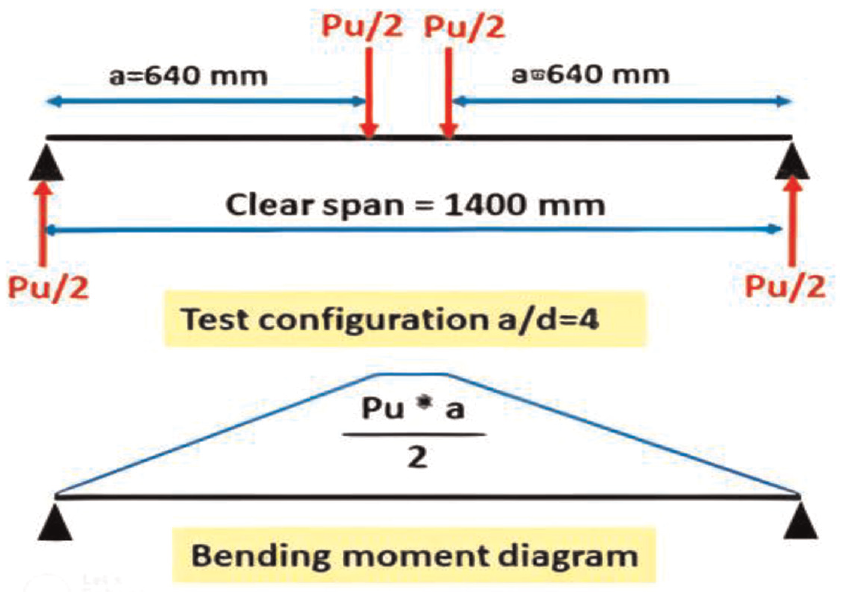
Test configuration and bending moment diagram for slabs with a/d =4.
Effect of changing the slab height
The results show that when the slab height increased, the ultimate load and the cracking load also both increased. With increasing slab height, the ultimate deflection and the ultimate load also increased. Reducing the slab height of S21 leads to reduced ultimate load and ultimate deflection values of 9.53% and 14.94%, respectively, when compared with S1. Increasing the slab height of sample S22 leads to increases in both the ultimate load and the ultimate deflection of 16.65% and 89.22%, respectively, when compared with S1, as shown in Table 7. Increasing the specimen height enhanced both its capacity and its ductility. The load-deflection curves for the tested slabs are presented in Fig. 20(d).
Conclusions
From the analysis of all studied layered slab models with hollow cores, including the experimental and numerical simulation results, the significant conclusions are drawn as follows:
Push-out specimens treated with nails or bonding materials showed good bond strength values of 1.73 MPa, and 1.67 MPa, respectively, and damage with a crack passed through the LWC cube without particle failure; therefore, these processes are considered suitable surface treatment types for use in treating the tested slabs.
Push-out specimens that were tested with friction at the interface only, i.e., without any other treatment type, showed a 0.84 MPa bond strength value (not more than 1 MPa) and failed on separation of the elements; therefore, this is not considered to be an appropriate practical surface treatment type.
Experimental results coincide well with the numerical data, and the load-deflection curves also fit well with each other.
Reducing the hole diameter of the specimens increased their failure loads and mid-span deflections because of their increased section moment of inertia properties. Additionally, the energy dissipation increased because of the increase in the web of the slab cross-section, which must absorb more energy during loading.
The optimum core diameter for these slabs is approximately equal to 81 mm because the increasing ultimate load value equals the decreasing slab weight value at the intersection point between the two relationships.
Increasing the reinforcement ratio of the specimens enhanced their failure loads and mid-span deflection, and reduced their energy dissipation because of the increase in stress. Slabs with a 0.53% RFT ratio showed more ductile behavior than the slabs with the 0.37% and 0.95% RFT ratios.
Use of nails enhanced the failure load, the deflection, the energy absorption, and the ductility ratio of the specimens because of the good bond between the two concrete layers that prevented horizontal slide and it is necessary for the bond to absorb more energy during loading.
The experimental values of the deflections were almost all within the same range until the appearance of the first crack in each case. This was related to the fact that the topping layer acted as a part of the slab and the fact that no shear slip occurred during load application because of the appropriate treatment of the bottom slab surface at the interface with the topping layer.
The load-deflection curves generally showed three stages of loading: first, an elastic relationship until the occurrence of the first cracking load; then, a pseudo-elastic relationship occurred, and finally, a plastic relationship occurred until the occurrence of the failure load.
The load-deflection curves for slabs treated with nails are stiffer than those treated with bonding materials with a good composite action among the layers.
It is obvious from the results that all slabs have similar performances with slight variances in their ultimate deflection values.
No concrete crushing was observed in the compression zone for all specimens, and they showed only small signs of damage. The FE models also predicted similar crack patterns to the experimental patterns.
The specimens all showed a linear relationship between strain and load until the appearance of the cracking load; then, the strain increased with increasing applied loading at a faster rate until fracture occurred.
Reducing the concrete strength of the topping layer (HSC) and maintaining a constant strength in the bottom layer (LWC) enhanced the slab ductility and led to good performance in terms of the flexure behavior of the studied slabs.
Increasing the number of openings in the slab reduced its capacity and increased its deflection.
Specimens with a circular core shape with open edges provided better results than those with a square core shape. This may be related to the effects of stress concentration at the corners of the square.
A specimen tested under a uniform load can bear more loading than a slab tested under a concentrated load. Therefore, this load variable can be regarded as a safety factor when designing such a slab on site.
Using top and bottom RFTs gives a more ideal load-deflection curve for the specimen under test than a slab with a bottom RFT only, and also leads to enhanced capacity and deflection because of the presence of the top reinforcement, which distributes stresses round the hole and prevents damage.
The weights of specimens LS23, HCS22, and LS/HCS1 were reduced by 20.59%, 21.51%, and 37.67%, respectively, when compared with that of SS21. Reduced material consumption enables us to accelerate construction times and reduce overall costs. In addition, this approach reduces dead weight, which allows use of a smaller building foundation.
The two-layered slab with hollow cores (LS/HCS) system gives an optimum weight-to-strength ratio with a reduction of 33.672% when compared with the SS21 system.
Furthermore, the HCS22 system showed an acceptable weight-to-strength ratio with a reduction of 21.062%, although the reduction in the strength of the LS23 system was very large based on the reduction in its slab weight, and its weight-to-strength ratio was improved by 5.428% when compared with the SS21.
Increasing the slab height enhanced the slab’s capacity and ductility.
Recommendations for future work
The LS/HCS system can be used in various structural applications, including bridge decks, economical floors, structural roofing, and walls, and can be considered for applications as sound barriers. The hollow sections can also be used for mechanical or electrical runs. The HCS can be used to distribute heated air over the cores. This system can also be used as a part of business, private, auto parking, or unaired development projects.
The results of the present study could be complemented with additional research in the following areas:
Further investigations must be performed to devise convenient parameters for layered slabs with hollow cores based on a parametric study using nonlinear finite element software, where the parameters include the span-length-to-effective-depth (L/d) ratio parameter and the concrete grade parameter, and the case of horizontal loading is considered.
Future work can focus on connection methods with other epoxies and their effects on the structural behavior of the LS/HCS.
Future work can also include study of the structural behavior of prestressed, precast, and layered slabs with hollow cores.
Future work can also involve study of the effect of applying fibers to the two concrete layers.
Future work can include study of the shear behavior of these slabs.
Future work can involve study of the effects of changing temperature and environmental conditions on the behavior of these slabs.
Footnotes
Declaration of conflicting interests
The authors declared no potential conflicts of interest with respect to the research, authorship, and/or publication of this article.
Funding
The authors received no financial support for the research, authorship, and/or publication of this article.
Ethical statement
The authors declare that they have not submitted the manuscript to any other journal for simultaneous consideration. The work is original and not published elsewhere.