
Abstract
Summarized in this article are the major findings from a detailed damage investigation of an instrumented ductile reinforced concrete moment frame building subjected to a design-level earthquake. The building sustained widespread damage during the 2016 M-7.8 Kaikoura earthquake and was subsequently demolished. Prior to demolition, the structural system was extensively surveyed to document the severity and distribution of the damage sustained in the reinforced concrete frames and the flooring system. Furthermore, the building response during the earthquake was reconstructed from the acceleration records obtained from instruments installed throughout the building. The site seismic demands were also obtained from a local free-field instrument. The data collected from this damage investigation provide a high-quality dataset that is valuable to researchers investigating different parameters related to the seismic performance of reinforced concrete moment frame buildings. The dataset is published and publicly available on DesignSafe-CI (project PRJ-3444); https://www.designsafe-ci.org/data/browser/public/designsafe.storage.published/PRJ-3444v2. The data collection methodology is described, and a roadmap for navigating the dataset is presented to support future use of the archived dataset.
Keywords
Introduction
Learning from structural damage observations in previous earthquakes has played a pivotal role in enhancing the knowledge and practices of structural design, leading to the progressive improvement of holistic design standards and building codes, reaching more resilient structures. Typically, our understanding of the expected seismic performance of different structural components is primarily based on individual structural components laboratory investigations. However, the behavior of these individual components within an integrated structural system during an earthquake is not always predictable. This discrepancy between an individual component behavior and the component behavior within a system is attributed to many reasons, including, but not limited to, size effects, three-dimensional (3D) interaction with multiple structural and nonstructural components, and dynamic characteristics of earthquakes. Recognizing the significance and benefits of learning from the response of real-life buildings during seismic events, multiple buildings have been instrumented throughout New Zealand over the recent years (Kaiser et al., 2017b; Uma et al., 2011; Van Houtte et al., 2017) to capture quantitative data describing the motion of the ground and the response of structures.
The 2016 M-7.8 Kaikoura earthquake resulted in seismic demands exceeding the design-level demands for buildings with periods of 1–2 s at some locations in Wellington (Bradley et al., 2017a; Henry et al., 2017). The building investigated in this study was one of six instrumented buildings in Wellington and the Upper South Island that experienced design-level shaking during the Kaikoura earthquake.
The building sustained widespread damage after the earthquake, prompting a structural damage assessment to assist in understanding the condition of the structural system following the earthquake. Subsequently, the building was deemed to be demolished.
As part of the demolition program, all nonstructural components were removed prior to demolishing the structure, leaving the entire damaged structure exposed. In this study, after removing the nonstructural components, the structure was extensively surveyed to document the severity and distribution of damage resulting from the earthquake. Detailed damage documentation and crack mapping were undertaken utilizing terrestrial laser scanning, 360 imaging, and high-resolution imaging to capture the structural damage sustained in the building. Furthermore, the data recorded from the instrumentation installed in the building were used to provide an estimate of drift demand, which could be correlated with observed damage.
This article highlights the key damage observations in the building, describes the methodology of data collection, and provides a roadmap for navigating the dataset to support future use of the archived dataset. The recorded documentation and data collected throughout this investigation provide a high-quality dataset that is now published on DesignSafe-CI with D.O.I (10.17603/ds2-7gcm-ga59; https://www.designsafe-ci.org/data/browser/public/designsafe.storage.published/PRJ-3444v2). The published dataset is titled “A Detailed Damage Investigation of an Instrumented Ductile Reinforced Concrete Building with Precast Hollow-core Floors Following the 2016 M-7.8 Kaikoura Earthquake.”
Scope
The damage investigation was conducted to provide detailed damage data to address a number of objectives primarily relevant to the seismic behavior of precast prestressed hollow-core (HC) floor units supported by ductile reinforced concrete moment frames. The data collected included acceleration records from 14 strong-motion recording instruments within the building and 1 on-site (free-field) instrument recording local site response, detailed crack maps of the floors, 3D laser scans of the bare damaged structural system, and high-resolution photographs of the beam–column and floor–column joints damage.
Data significance
The extensive dataset discussed in this article provides detailed insights into the seismic performance of a reinforced concrete building that was designed according to up-to-date seismic design and detailing requirements. Given that the building was instrumented when subjected to design-level shaking and detailed damage information throughout the building was recorded, such information makes this dataset unique. Furthermore, having a free-field accelerometer capturing the local site seismic response meant that the effects of the local site conditions on the ground shaking were directly accounted for.
The data collected and generated make this dataset a valuable resource to researchers investigating different aspects and parameters related to the seismic performance of ductile reinforced concrete moment-framed structures. Specifically, the dataset could be used to validate and compare different nonlinear numerical modeling approaches of the moment frames with the actual building response, improve assessment criteria for buildings within this archetype, correlate structural demands derived from both instruments and numerical models to observed damage levels, using the laser scans and damage images as a training database for artificial intelligence and machine learning algorithms related to concrete damage detection, and further data interrogation of laser scans.
Building description
The building investigated was a five- to six-story commercial office building with ductile reinforced concrete moment-resisting frames and precast flooring system constructed in 2009. The building (Figure 1) was located on the waterfront of New Zealand’s capital city, Wellington, with GPS coordinates 174°46′54″E, 41°16′45″S. The Wellington waterfront consists of reclaimed land on the shores of Wellington Harbor. The reclamations were conducted in multiple stages over time, with each reclamation stage differing in fill thickness and method of construction (Figure 2). The building had an approximately 25,000 m2 footprint traversing reclamations of two different ages (Figure 2). The reclamation fills beneath the building vary in thickness and overlay a thin discontinuous layer of marine deposits which are underlain by the Wellington Alluvium (Semmens et al., 2010).
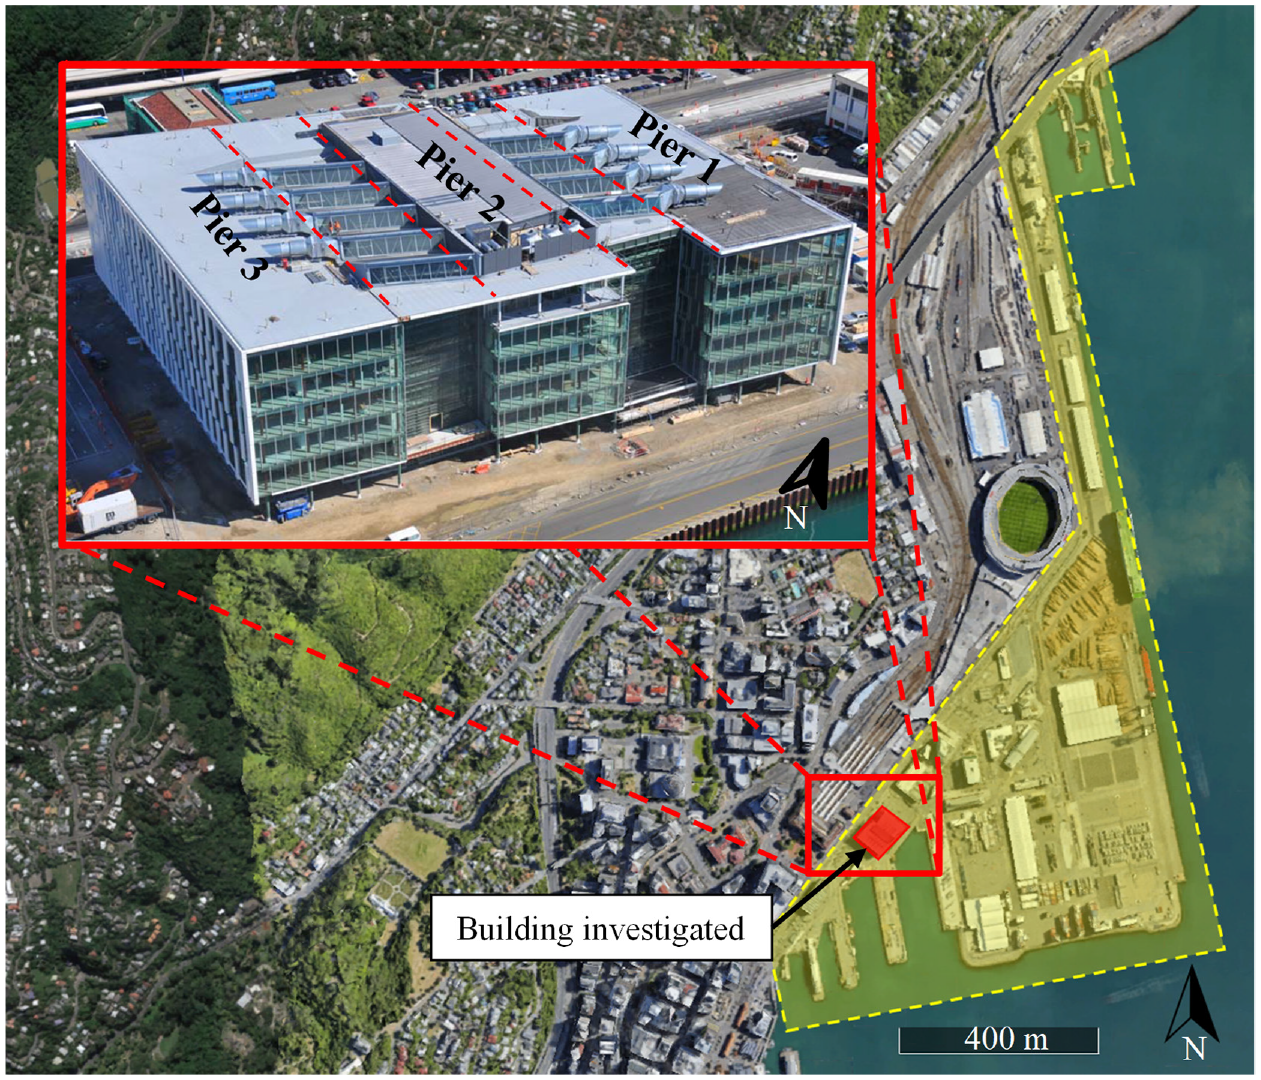
Ariel view highlighting the location of the building studied shown in red and port area shaded in yellow (base image from Google Earth™); photograph of building investigated (Uma et al., 2010).
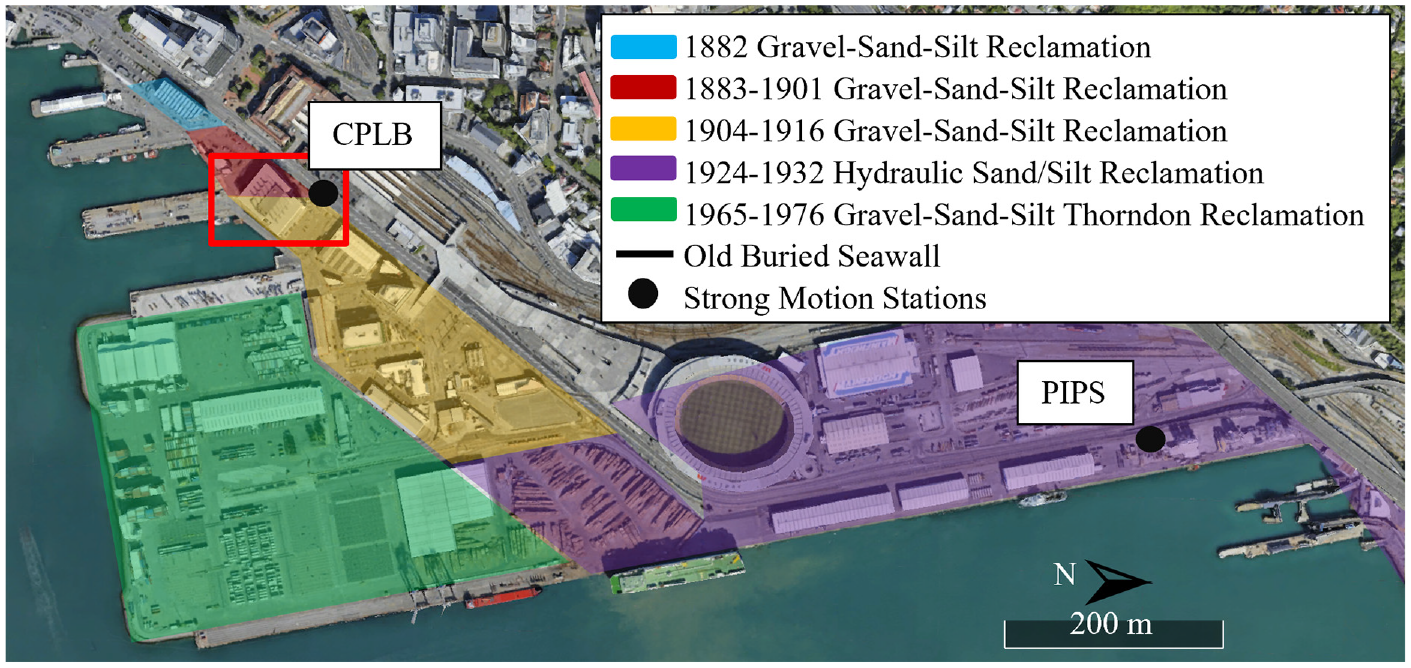
Arial view of the port showing approximate reclamation zone locations and highlighting the building investigated and location of strong-motion stations CPLB and PIPS, modified from Dhakal et al. (2020); base image from Google Earth™.
The site’s soil was determined as subsoil Category D seismic class as defined by NZS 1170.5 (Standards New Zealand, 2016). Soil class D is assigned to deep soft soils where the low-amplitude natural period is greater than 0.6 s. The site was reclaimed with end-tipped quarry fill that predominantly consisted of sandy–silty gravels with some brick and shell fragments. This material is relatively weak and prone to liquefaction, as was observed during the Kaikoura earthquake (Cubrinovski et al., 2017). Additional details about the geotechnical aspects of Wellington’s waterfront can be found in Murashev and Palmer (1998), Semmens et al. (2010), and Vantassel et al. (2018).
The foundation system of the building consisted of a combination of bored and driven piles, ground improvement, and seawalls. The structure was supported on a combination of bored belled piles under each column and driven steel tube piles along the eastern and western edges of the structure. Piles of four different diameters were used with bored piles of three different diameters with a minimum depth of 12 m and driven piles with a minimum depth of 9 m and laid out as shown in Figure 3.
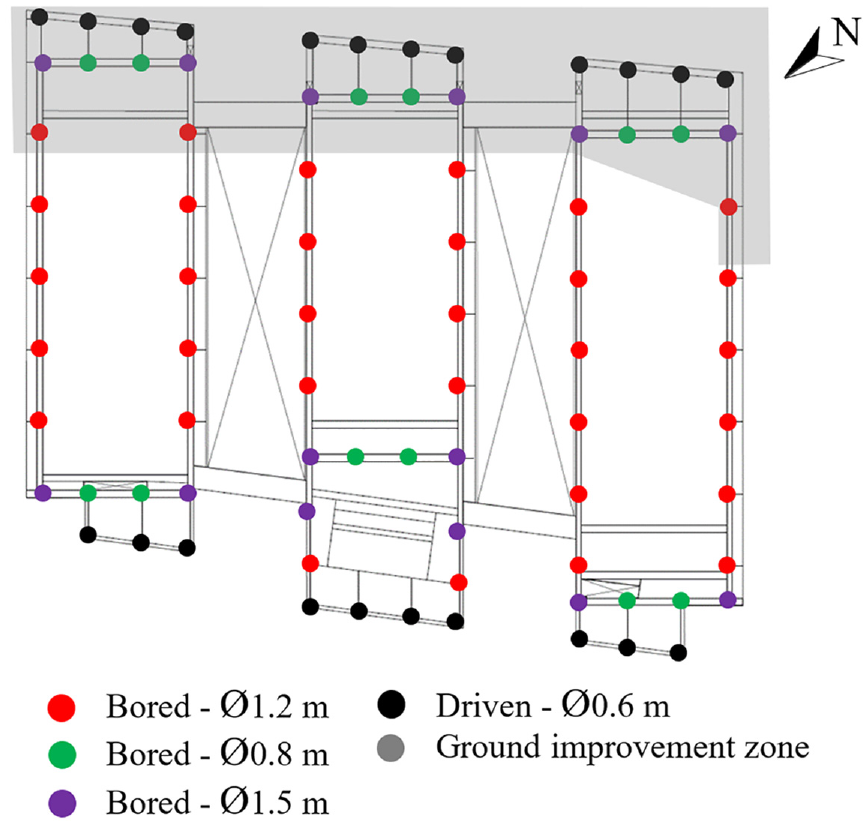
Sketch for pile layout of the building and approximate extent of ground improved zone.
The layout of the building consisted of three seismically linked buildings, referred to as “piers”, via steel pedestrian “link bridges” and separated by two atrium spaces (Figure 4). Piers 1 and 3 were five stories tall, while Pier 2 had an additional sixth story to house mechanical equipment. The link bridges were designed with sufficient strength to tie the piers together in the longitudinal direction. In addition to the link bridges on each floor, Piers 2 and 3 were connected with a floor diaphragm at Level 1 (Figure 9).
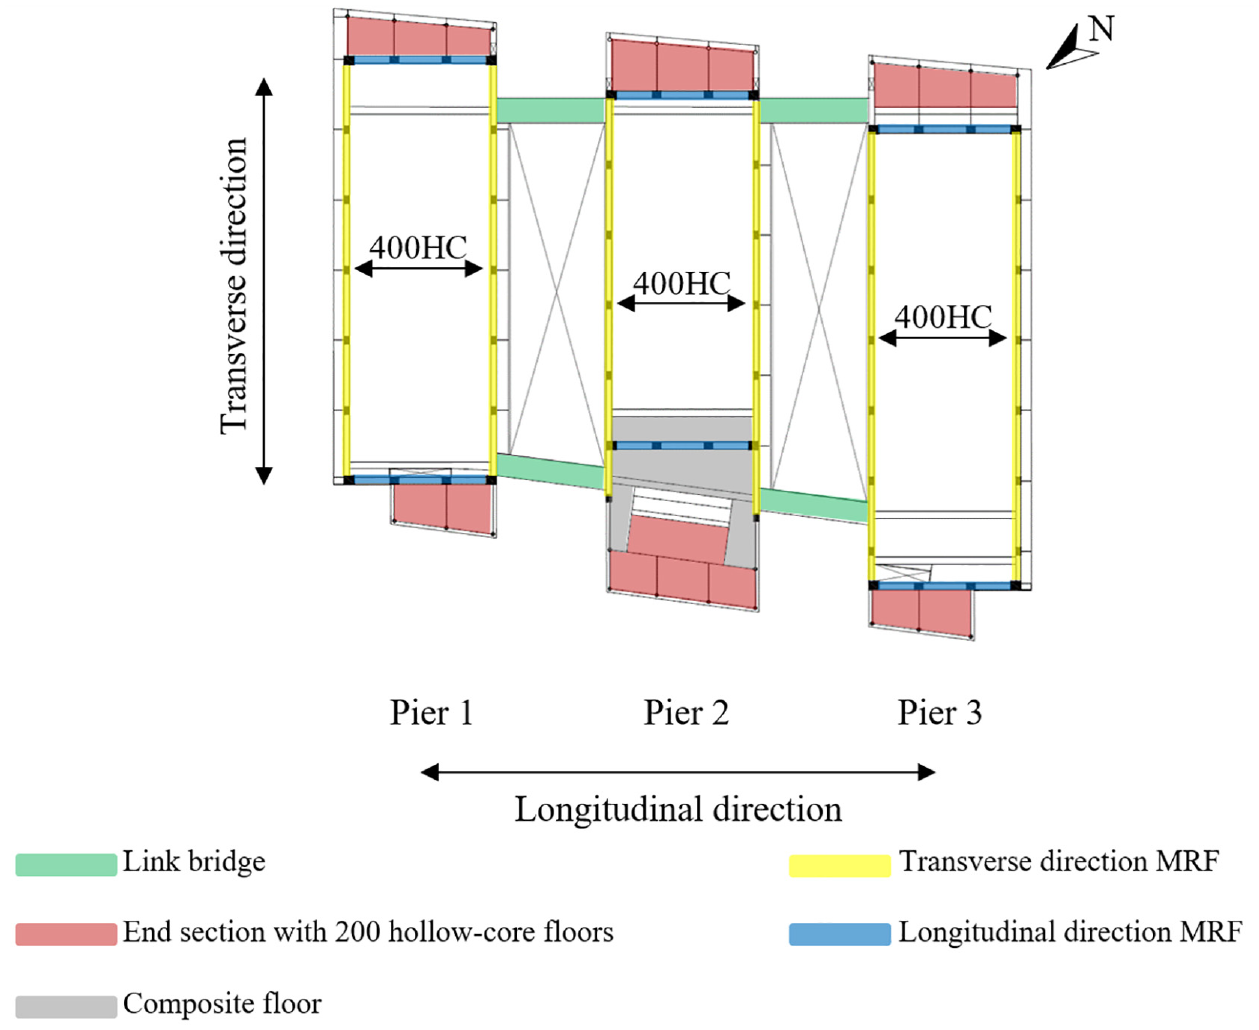
Schematic plan describing structural system details and connections between piers.
Ductile reinforced concrete perimeter moment resisting frames (MRF) were used to serve both the gravity load carrying system and the lateral load resisting system. The frames consisted of precast concrete beams with in-situ columns and joint elements designed and detailed for high ductility in both directions. Despite the construction method of the MRF, these frames emulate the performance of cast-in-place monolithic construction and possess stiffness, strength, and ductility similar to that of cast-in-place reinforced concrete MRF (Park, 1995; Restrepo-Posada, 1992). The MRF, in-turn, supports a system of precast prestressed HC floor units.
The characteristic strength of concrete used for precast elements as well as the columns was 40 MPa, while the characteristic concrete strength of the in-situ concrete was 30 MPa, and generally, most reinforcements had a minimum yield strength of 500 MPa. Typical beam and column cross-section profiles are shown in Figures 5 and 6. While the overall dimensions of the beams and columns remain constant up the height of the building, the tie reinforcement details vary slightly for columns and beams on different floors. More information can be found in the data repository (10.17603/ds2-7gcm-ga59) under the “Building Drawings” section.
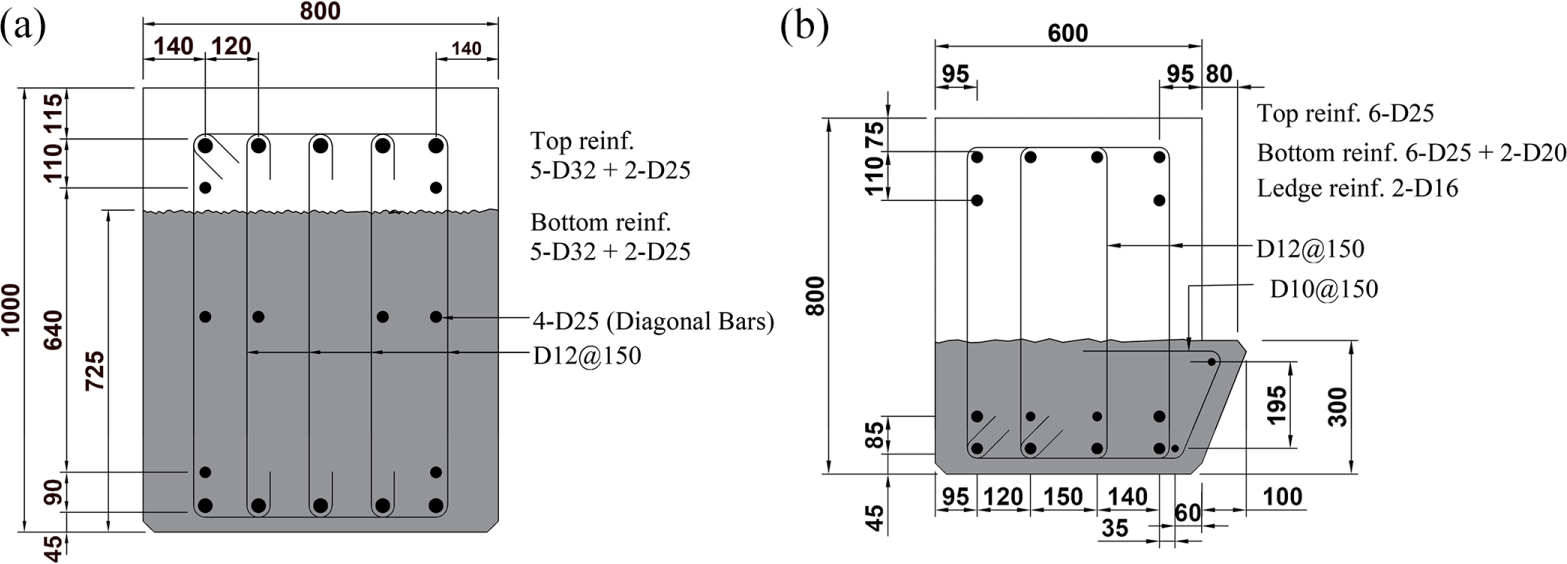
Typical cross-sections of primary frame beams where gray shading indicates the precast portion of the beam. (a) Longitudinal frame beam. (b) Transverse frame beam. All dimensions are in millimeters.
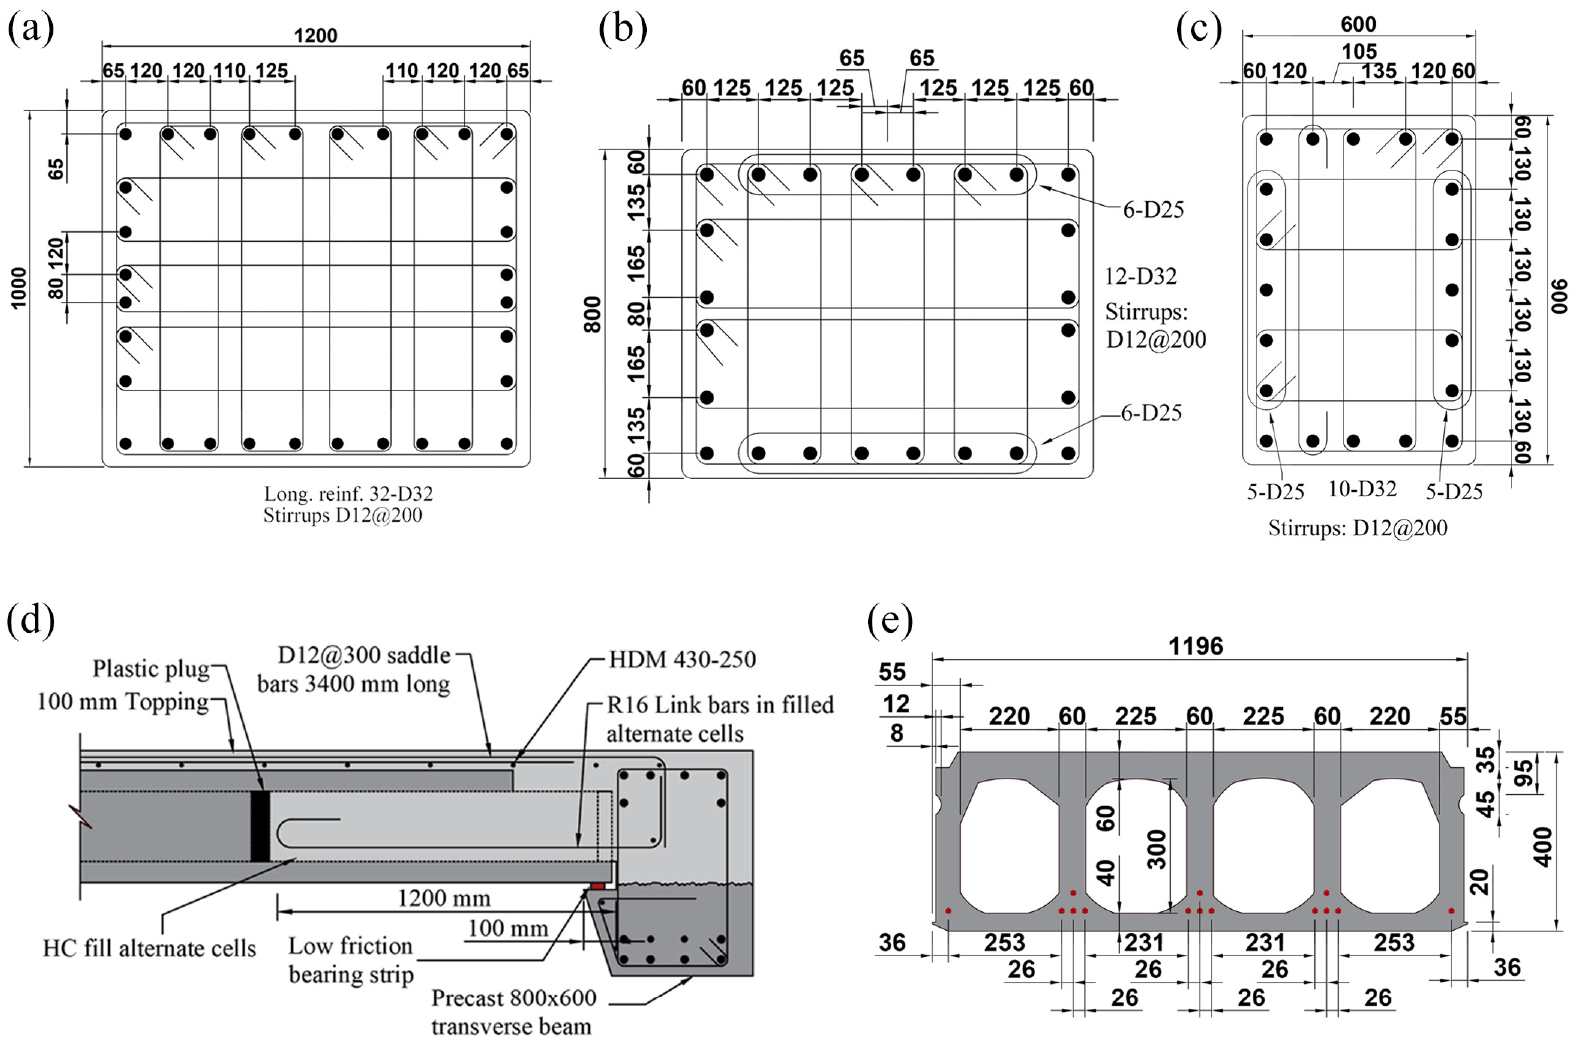
(a) Typical corner columns section. (b) Typical intermediate columns section in longitudinal frame. (c) Typical intermediate columns section in transverse frame. (d) Typical floor to support beam connection detail sketch. (e) Typical section of precast prestressed 400-mm deep hollow-core unit. All dimensions are in millimetres.
The spacing between the column centerlines in the longitudinal frame varied between 5.4 and 6.0 m, whereas in the transverse frames, the columns were 8.1 m apart. A precast prestressed HC floor system was used to span approximately 17 m in the longitudinal direction of the building between the perimeter frames. The typical floor system was 400-mm thick HC floor units with a cast in-situ 100-mm topping layer with 250 mm2/m ductile mesh reinforcement with a tensile strength of 430 MPa. The HC floor units had a 100-mm specified seating length with a 50-mm wide low-friction bearing strip. Figure 6d shows a typical floor connection detail. Every second cell was filled, and a 16-mm plain round bar reinforcement was added and tied back to the supporting beam. Where HC floor units were placed adjacent to multiple-bay frames that ran parallel to the HC floor units, in-situ slabs were used to allow for beam deformation without generating incompatible deformations into the HC floor units.
At the north and south ends of each pier, steel frames were used along with 200-mm thick HC floor units for the floor system (Figure 4). Composite flooring was used near the lift shafts in Pier 2. Furthermore, 175-mm thick precast cantilever floors were used for edge walkways in the building. At the roof level, cold-formed purlins were supported by structural steel portal frames. The ground floor was a ground-bearing in-situ slab-on-grade. The structural system of the building was designed and constructed per the New Zealand Building Code B1/VM1 and associated standards. Refer to the data repository (10.17603/ds2-7gcm-ga59) for more details.
Engineering characteristics of strong ground motion
The M-7.8 Kaikoura earthquake occurred along the east coast of the upper South Island of New Zealand on 14 November 2016 at 12:02 a.m. local time, with an epicenter approximately 20 km south of the Hope fault at a depth of 15 km (GeoNet, 2016; Hamling et al., 2017). The event involved multiple fault segment ruptures, mainly propagating northeast from North Canterbury, with significant energy directed toward the Wellington region (Bradley et al., 2017b; Kaiser et al., 2017a). The rupture propagation direction and the approximate location of the source zone are indicated in Figure 7a.
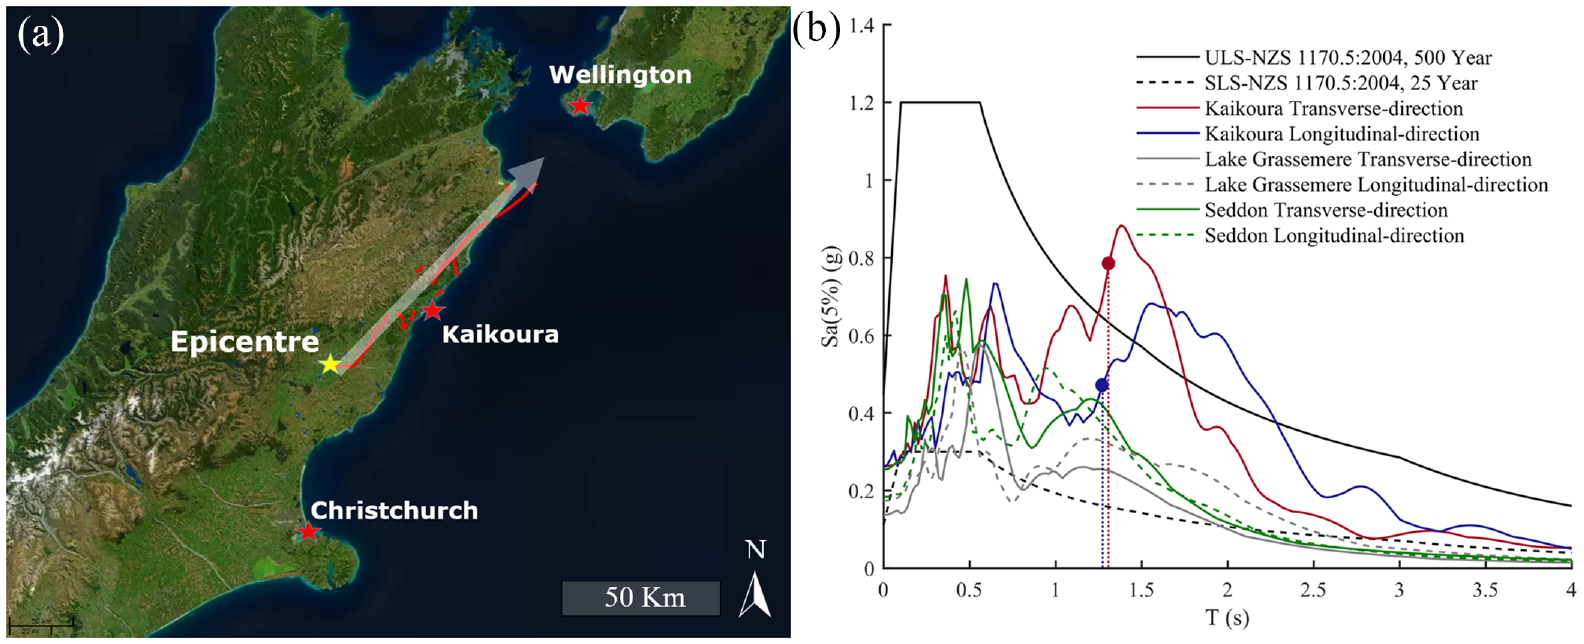
(a) Approximate location of Kaikoura earthquake epicenter and faults ruptured according to Hamling et al. (2017). (b) 5% damped spectral accelerations of ground motions from the CPLB free-field sensor rotated to coincide with the longitudinal and transverse axes of the building with an estimate of the fundamental periods and the ULS and SLS design response spectra according to NZS1170.5:2004.
Despite the distance of Wellington from the source (approximately 200 km), relatively strong shaking was experienced in some parts of the city. This intensity of shaking is mainly attributed to the ground motion amplification by the deep sediments underlying the city, as well as being in the path of the focused seismic waves propagating in the direction of the ruptures. Two strong motion stations (SMS) were located within the region of the building investigated location (CPLB and PIPS), as shown in Figure 2. The SMS CPLB represents the instrumentation array in the building investigated. The free-field sensor located at the building site as part of the SMS CPLB showed local site amplification effects due to deep soil deposits, resulting in strong energy content in the 1–2 s period range, as shown in Figure 7b. The fundamental period of vibration for the transverse and longitudinal directions of the building was estimated using the simplified method of response spectral ratios (McHattie, 2013) to be approximately 1.3 s in both directions. For comparison purposes, the spectral values for the Wellington Central Business District Soil class D, based on the New Zealand Structural and Earthquake Actions standard NZS 1170.5:2004 (Standards New Zealand, 2016), were plotted for both the ultimate limit state (500-year return period) and serviceability limit state (25-year return period) against the 5% damped response spectra of the ground motion recorded with the free-field instrument located at the building’s local site in the longitudinal and transverse axes of the building. For further information regarding the effect of different soil types on the recorded strong motions, refer to Bray et al. (2019) and Cubrinovski et al. (2018), where some discussion and comparisons between instruments placed on more firm soils and rock foundation can be found.
The moderately long duration of the Kaikoura earthquake ground motion (Figure 8) alongside the high energy content in the 1–2 s period range resulted in damage to different structural components in the building, which will be discussed in more detail in the following sections. It is worth noting that the building was previously subjected to two earthquakes in 2013, the M-6.5 Cook Strait earthquake (GeoNet, 2013a) and the M-6.6 Lake Grassmere earthquake (GeoNet, 2013b). Following the Cook Strait earthquake (sometimes referred to as the Seddon earthquake), minor structural damage was observed and reinstated. However, a significant amount of nonstructural damage was observed (Dominion Post, 2013).
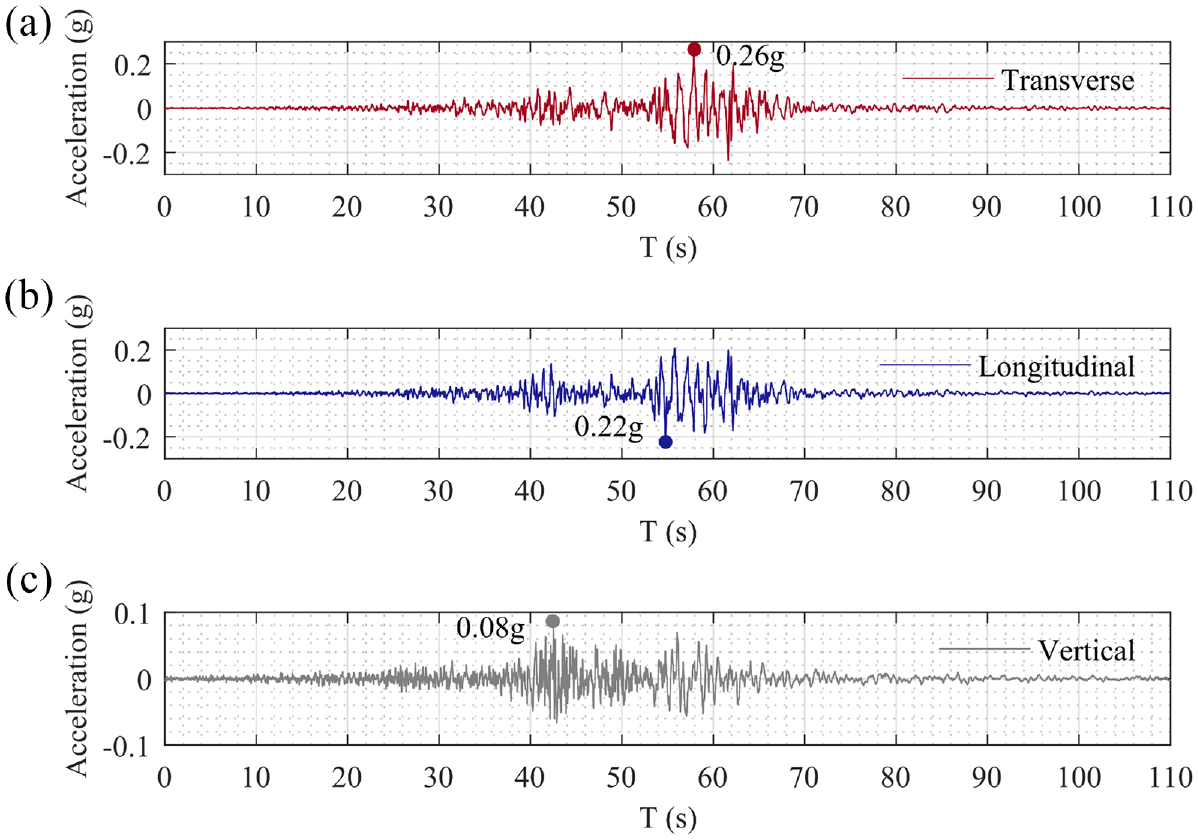
Local site computed ground motion acceleration time series. (a) Transverse direction. (b) Longitudinal direction. (c) Vertical direction.
Building-derived response from instrumentation
Fourteen triaxial accelerometers installed throughout the building were used to capture the building response, as shown in Figure 9, and one free-field accelerometer was used to capture the local site response. Pier 3 was instrumented with at least one accelerometer in each story. Sensors 3–11 and Sensor 15 were used for levels G to 6 in Pier 3 to monitor the motion at each level. The fifth floor (ceiling of Level 4) of the building was instrumented with five sensors to be able to capture any twisting motion if present. It should be noted that Sensors 9 and 15 had some data quality issues and are not reliable.
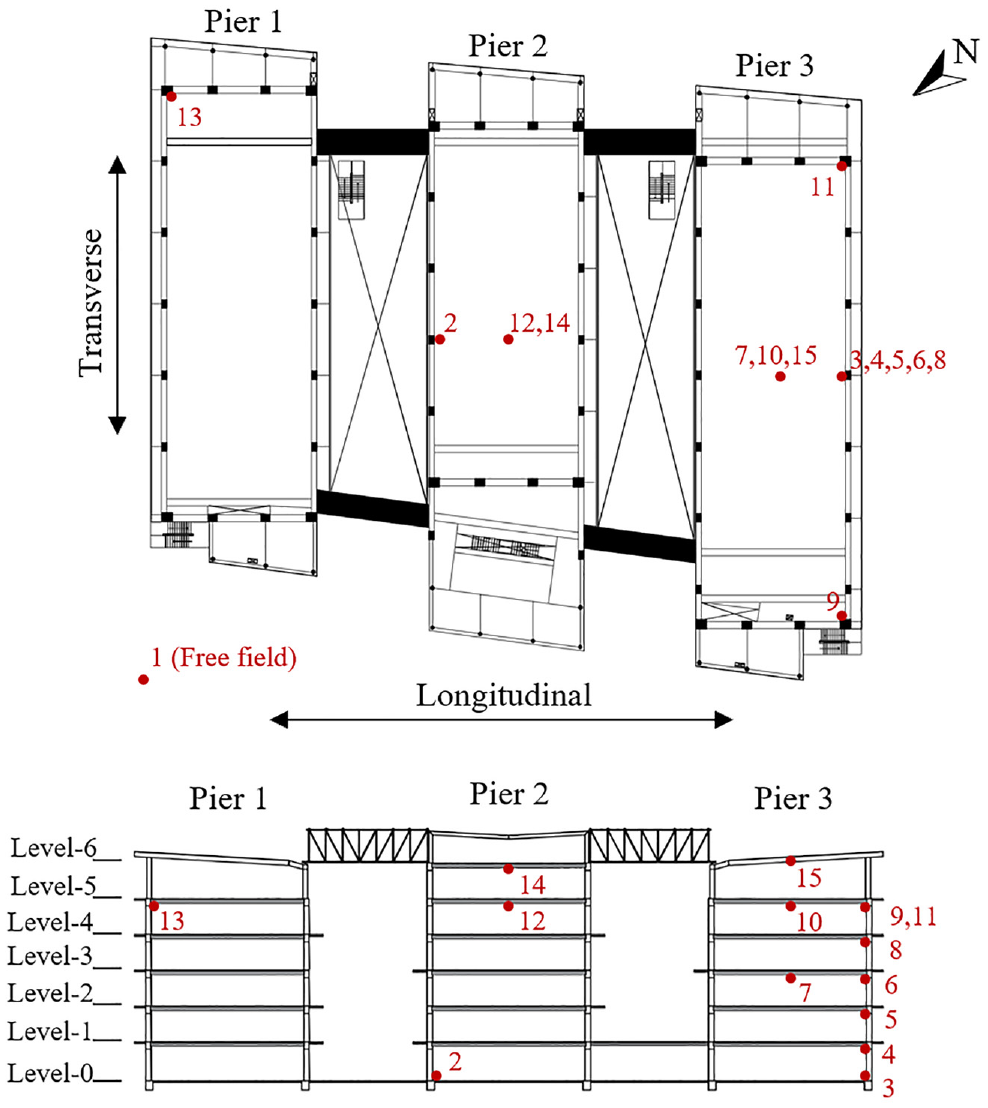
Schematic indicating the locations of installed triaxial accelerometers throughout the building.
The strong motion data were obtained through the GeoNet instrumentation network (GeoNet, 2016) and was then processed to have the two orthogonal horizontal components of each record coinciding with the longitudinal and transverse direction of the building. The static offsets were subtracted based on recommendations from Boore and Bommer (2005), and the records were filtered with a Butterworth bandpass filter with corner frequencies of 0.1 and 20 Hz. Emphasis should be made that 20 Hz was used as a high-cut filter to be conservative and avoid any data loss, based on observations from the processed data as well as the instrument’s manufacturer (CSI Limited, 2017) recommendation.
Only the response of Pier 3 was reconstructed and computed as Piers 1 and 2 of the building were lightly instrumented, which made it difficult to reconstruct the response of these portions of the building. For each floor level in Pier 3, Sensors 3–6, 8, and 10 were considered to represent the motion of the entire floor, assuming a rigid diaphragm. The peak floor acceleration (PFA) at each level for both transverse and longitudinal directions of the building was computed as the absolute maximum acceleration over the entire time history. As such, these PFA values could have occurred at different times and directions. The PFA variation along the height of the building for both orthogonal directions of the building are plotted in Figure 10a using solid lines. A maximum PFA of nearly 0.8 g was observed at the fifth level in the transverse direction.
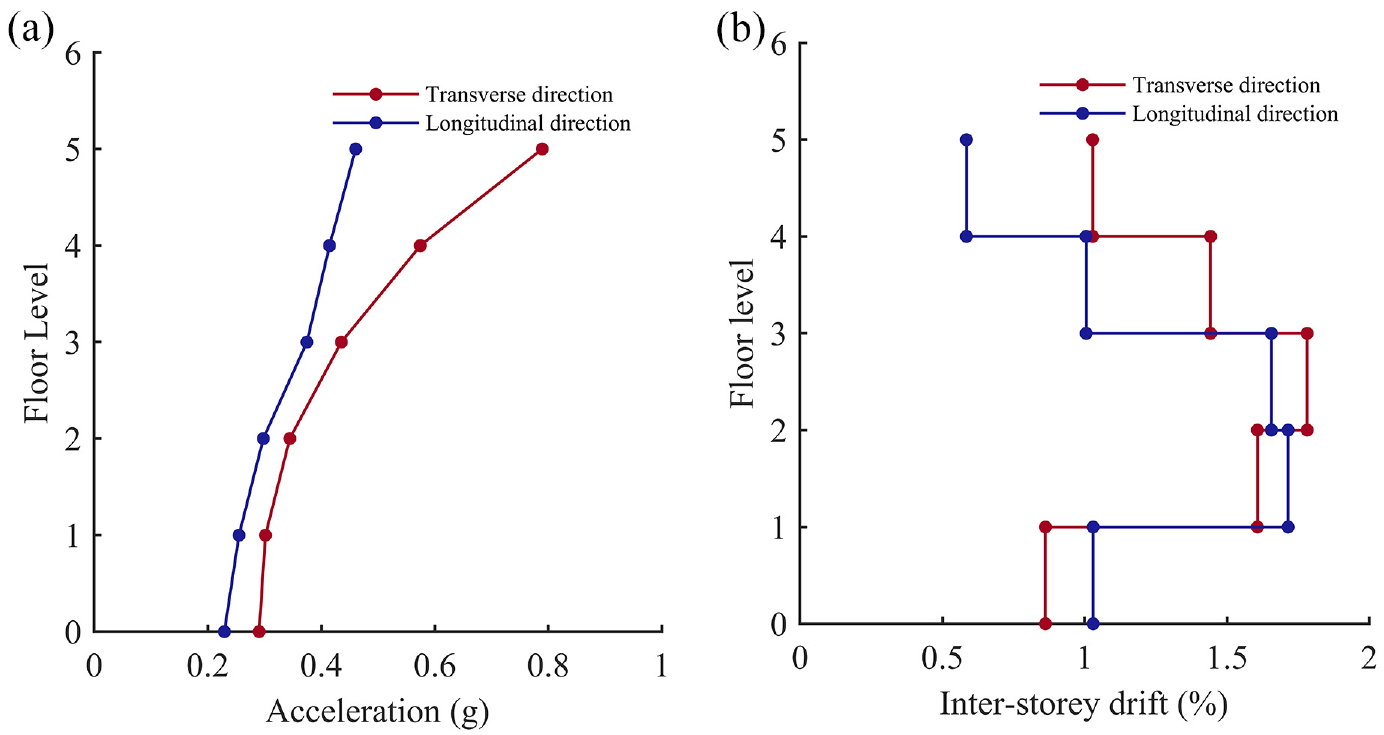
(a) Peak floor accelerations. (b) Peak interstory drifts.
To compute the interstory drifts (ISDs), the displacement time history for each level was first computed by double integrating the acceleration time history for each level using the software Seismosignal (Seismosoft, 2016). Then the ISD ratio of each story was computed as the difference between the derived displacement time series of the upper and lower levels of each story normalized by the story height. The peak ISD for each story was computed as the absolute maximum ISD over the entire time history. Similar to PFA, peak ISD could have also occurred at different instants of time. Figure 10b shows the variation in peak ISD over the building height. Table 1 shows the computed PFA and ISD at each floor.
Computed peak floor accelerations and interstory drift values
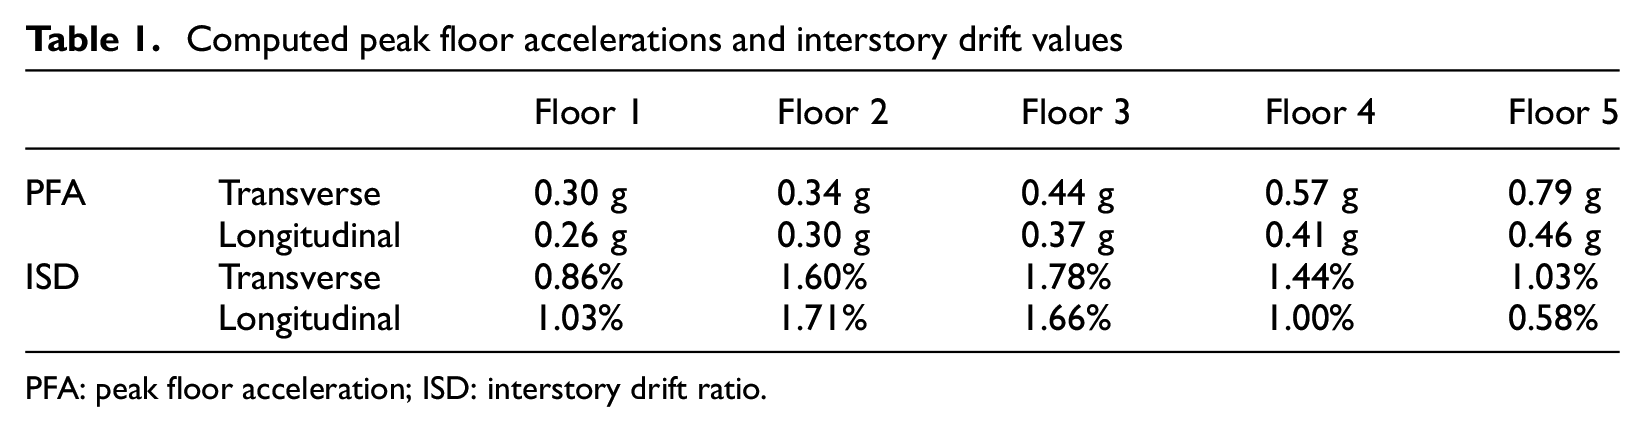
PFA: peak floor acceleration; ISD: interstory drift ratio.
Damage data collection
The building was significantly damaged during the M-7.8 Kaikoura earthquake and was subsequently deemed to be demolished. As part of the demolition sequence, the nonstructural elements were first removed, exposing the entire damaged structural system. This demolition sequence provided the opportunity to undertake extensive damage inspection and document the severity and distribution of damage resulting from the earthquake. Figure 11 shows the building after the removal of the nonstructural components exposing the damaged structure.
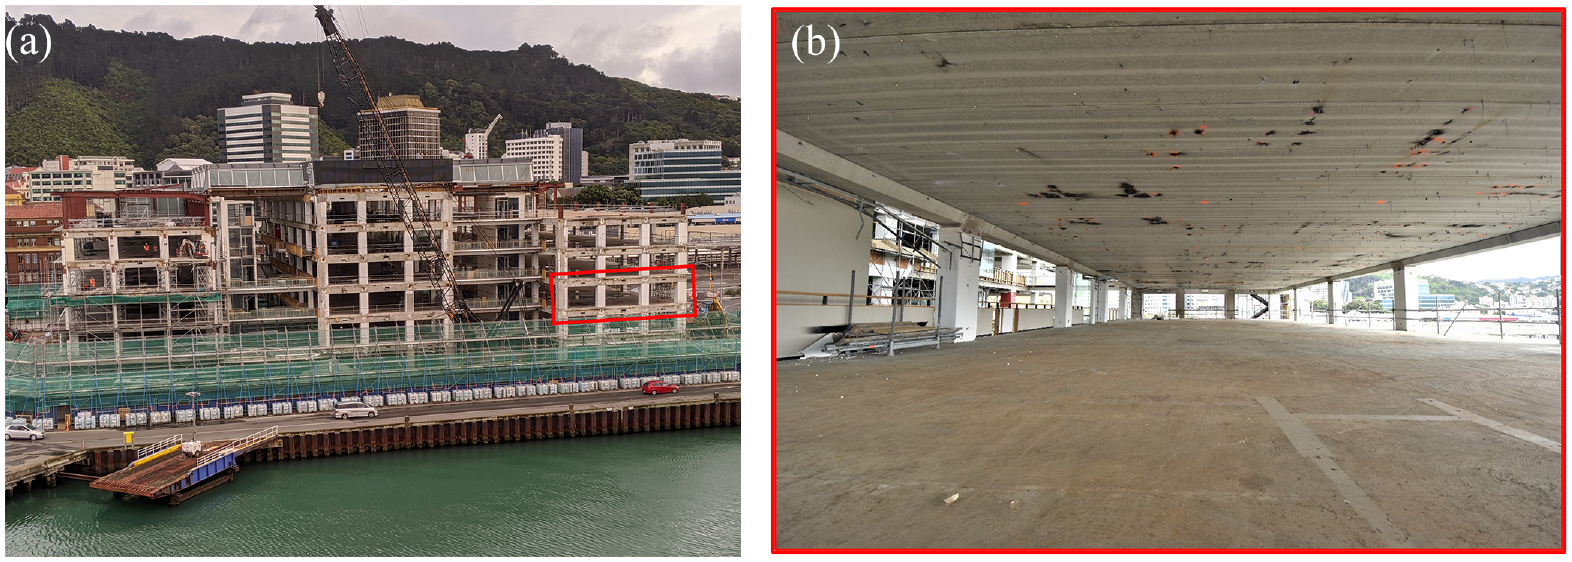
(a) Building structure exposed after removing nonstructural elements and façade. (b) Picture of one of the floors after removing nonstructural elements.
As part of the detailed damage documentation performed, the structural damage was marked and measured for floor Levels 2–5 in Pier 3 and floor Levels 2–6 in Pier 2. The damage documentation included the floor topping (diaphragm), floor soffit (HC floor units), and structural moment frames. Structural damage was not marked on the ground and first floors due to access restrictions on-site. Therefore, the damage was not documented for the soffits of the first floor. Finally, given the time constraints and the lack of instrumentation to compare drift demands with the observed damage in Pier 1, structural damage was not marked or measured in Pier 1. Figure 12 shows some examples of crack marking and measurements undertaken in the building.
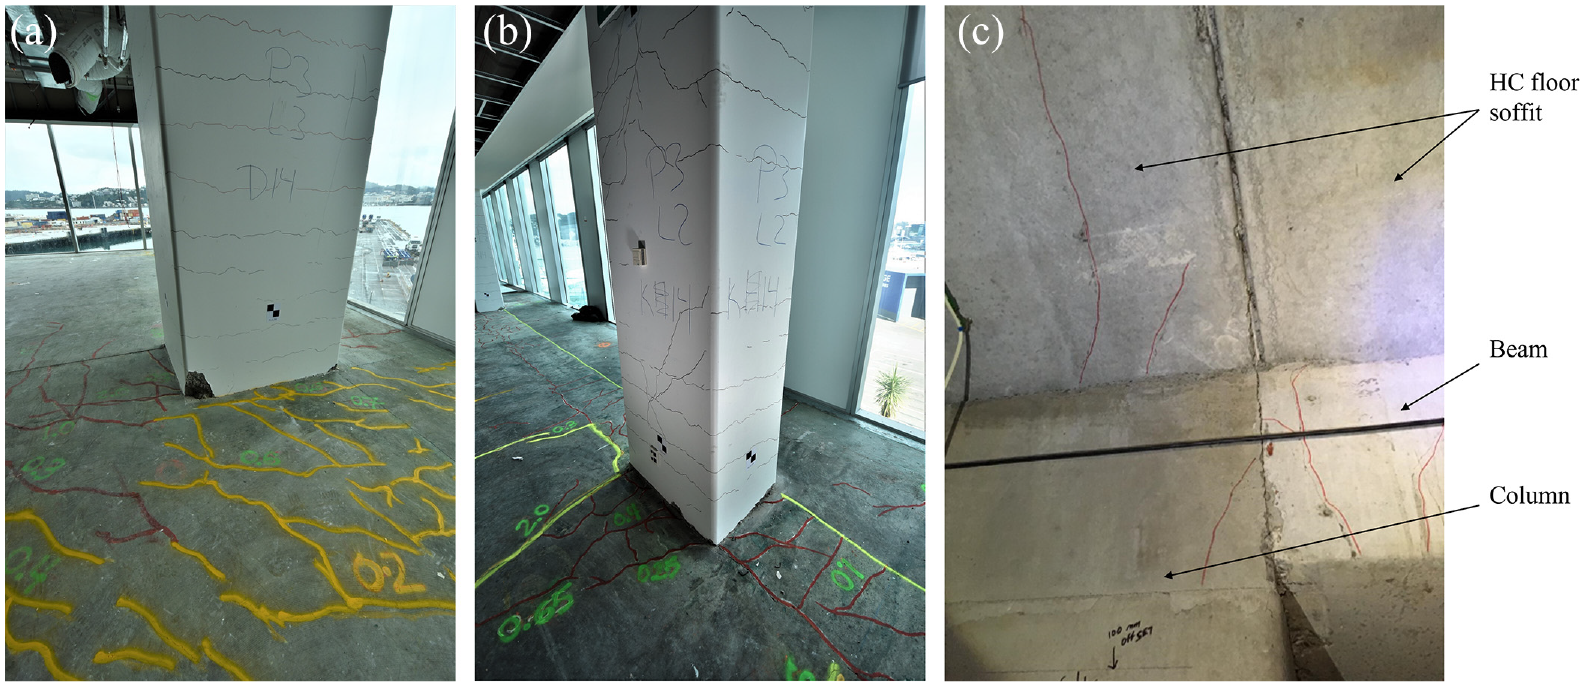
Examples of crack marking and measurement throughout the building: (a) Diaphragm damage marked and measured in pier 3 level 3 (b) Diaphragm damage marked and measured in pier 3 level 2 and (c) Crack marking of HC floor unit soffit.
To capture and preserve all the perishable damage data marked and measured on the structure, terrestrial laser scanning (sometimes referred to as Light Detection and Ranging (lidar)) and 360°HDR photographic imaging data were acquired with a set of Leica BLK360 scanners from the NSF NHERI Rapid Facility (Berman et al., 2020). Additional scans were completed later with a Leica RTC360. Furthermore, high-resolution images of the damaged beam–column joints were taken with a digital SLR camera.
Before collecting the data, some preparation and planning was necessary. First, the scan locations were selected and performed systematically to optimize the number of scans and minimize the time required on-site. Simultaneously, critical regions with concentrated damage were identified through an initial visual inspection to ensure the scans would adequately capture these regions. The critical regions were identified to include damage to beams, beam–column joints, and precast floor units at the intersection of the precast HC floor unit and the beam–column joints. Scan locations were primarily focused around the columns to adequately capture the damage in these critical areas. Nonetheless, a series of scans were also acquired from the middle of the floor span to obtain full coverage of each floor. A total of 873 scans were performed throughout the building. Furthermore, in the critical regions of the structure, close-range structure from motion/multiview stereopsis (SfM\MVS) models were developed to capture more details in those areas of interest. Figure 13 shows an example of some of the processed point cloud data from the laser scans and SfM\MVS. Additional information on the data collection methodology can be found in Mostafa et al. (2020).
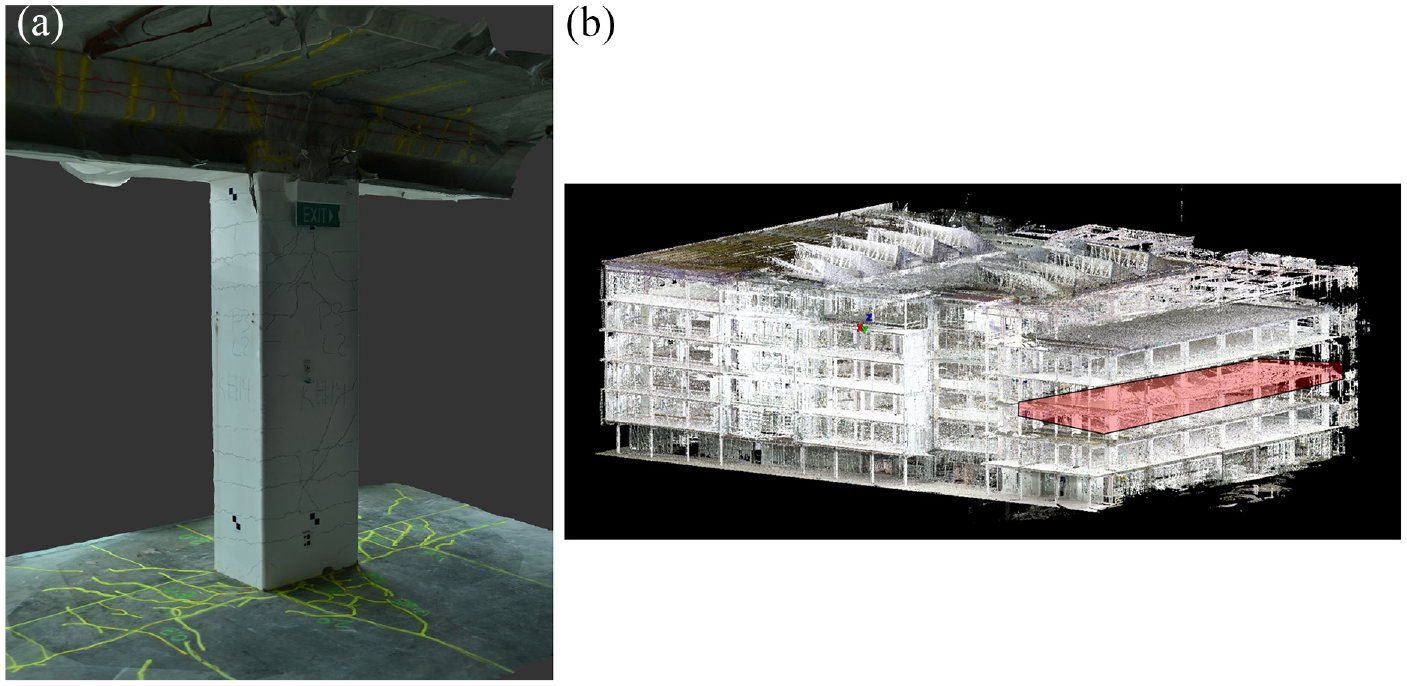
(a) 3D reconstruction of a damaged area of interest using SfM\MVS. (b) Laser scans point cloud model of the building’s damaged structure, illustrating a floor slice for generating floors crack maps in red.
Detailed two-dimensional (2D) crack maps were produced from the laser scans and 360°HDR images. Each floor was segmented in the point cloud, and both the top and bottom views of the floor were exported to AutoCAD drawing software (Autodesk, 2019). Then, cracks were traced to produce multilayered crack maps, where any cracking at the bottom of the HC floor units was overlayed with the cracking on the top of the floors. Crack widths were measured using a crack gauge and marked on the floors in-situ, so the crack width was easily identified while tracing the cracks from the exported point cloud data. An example of a crack map produced for the second floor in Pier 3 is shown in Figure 14.
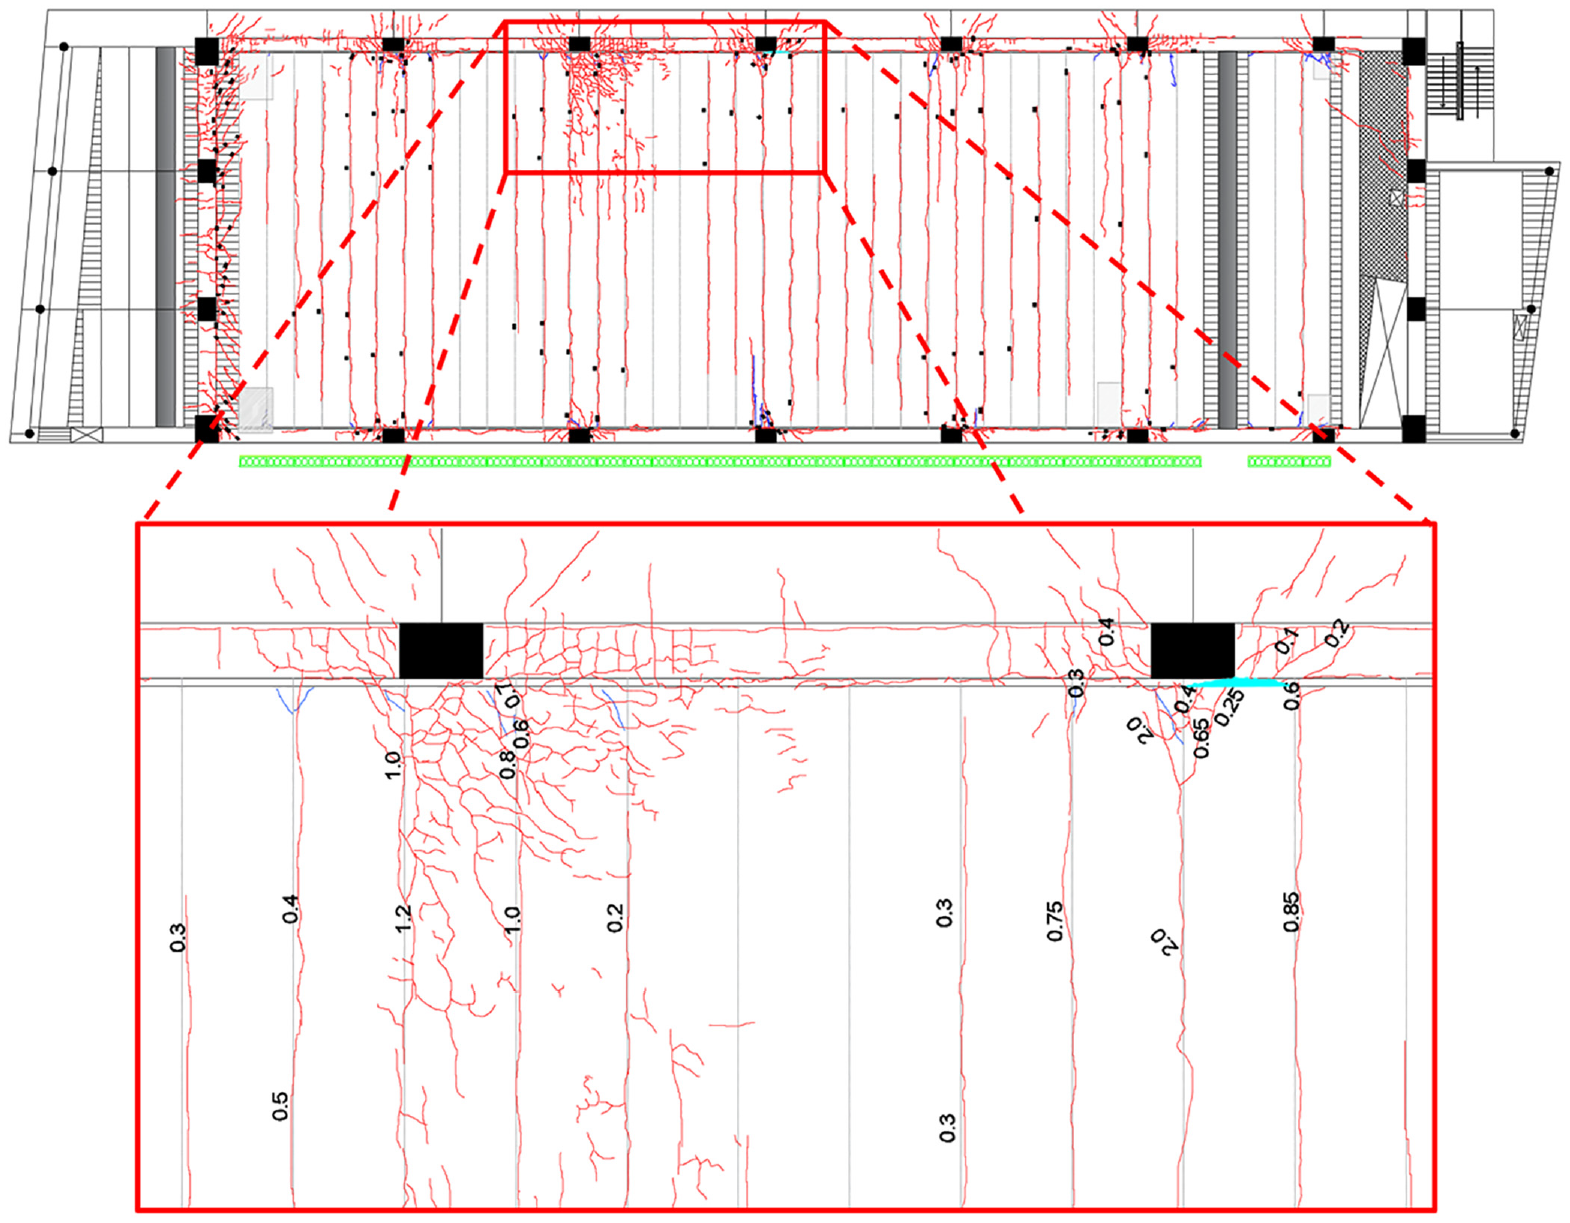
Crack map sample from the second floor in Pier 3 with floor top cracking marked in red overlayed with soffit cracks marked in blue, support ledge spalling marked in cyan, as well as crack widths in millimeters.
Observed damage
This section summarizes the key observations from the damage investigation. The discussion is limited to reporting the different damage states observed in the building rather than discussing the performance of the building itself. The information collected and presented herein is based on extensive damage mapping of the beams, columns, floor diaphragm (topping), floor units (soffit), and 3D laser scan point cloud surveys. Damage to the frames was predominately concentrated in beam plastic hinge zones, which ranged from minor cracking to concrete spalling and residual crack widths up to about 4-mm in the transverse frames. Floor damage included distributed cracking across the floor’s diaphragm due to deformation and elongation of the supporting frames, with more severe damage found in HC floor units seated either fully or partially on a column.
Frame damage
Detailed damage observations of the longitudinal and transverse moment frames were conducted and included the inspection and crack mapping of the lower portion of the beam plastic hinge regions (i.e. the portion below the HC floor units) and photographing the damage sustained showing the extent of damage, crack patterns, and concrete spalling. Residual crack widths in the plastic hinge regions were measured and recorded following the earthquake to determine the extent of damage sustained in the building. Crack width information was utilized in this investigation to classify the observed frame damage.
Damage observed
The primary moment frames generally exhibited strong-column/weak-beam response, and visual inspection of the damage sustained in the primary frames beam ends indicated varying degrees of beam hinging. The frames in the transverse direction sustained more damage than those in the longitudinal direction. The lower levels of Pier 2 sustained the greatest plastic hinge cracking with several vertical and diagonal cracks larger than 2-mm in width and concrete spalling in multiple locations. In a few cases, concrete spalling has occurred to a depth where longitudinal reinforcement and stirrups were visible (Figure 15a). Furthermore, similar crack patterns were observed on both faces of the beam in some locations, confirming the extension of the cracks through the cross-sections of the beams. Moreover, almost all of the reinforced concrete columns were visually inspected, including the extent of cracking within the column and the inspection of the columns–floor connection. Distributed hairline cracking accompanied by insignificant spalling damage was generally observed in the columns (e.g. Figure 15b), and nothing of concern was noted.
(a) Example of frame beam damage (Beca Limited, 2017). (b) Example of column damage with cover spalling.
Classification of frames damage states
To quantify the extent of damage sustained in the primary structural frames, the observed damage was classified using the photographic record of the extent of damage and maximum residual crack widths. Multiple guidelines for post-earthquake damage evaluation have been reviewed, including the Federal Emergency Management Agency (FEMA) P-58 (Applied Technology Council, 2018), Japan Building Disaster Prevention Association (JBDPA) (described in English by (Nakano et al., 2004), and Applied Technology Council (ATC, 1985) report ATC-13 to find the most suitable damage classification approach for the observed different damage states. The FEMA P-58/BD-3.8.6 damage states categorization described in Lowes and Li (2009) were adopted to classify the observed frames damage. Table 2 summarizes the damage states classification used to classify each beam end damage. Damage evaluations of the primary frames damage were color graded and presented in Figures 16 to 18. In a few locations where crack width information was not available, no damage state was assigned. However, a visual record of the damage sustained in the joint could be found in the 360 imaging in the laser scans and in the beam–column joint photographs in the “Damage Pictures” section.
Reinforced concrete moment frames damage states
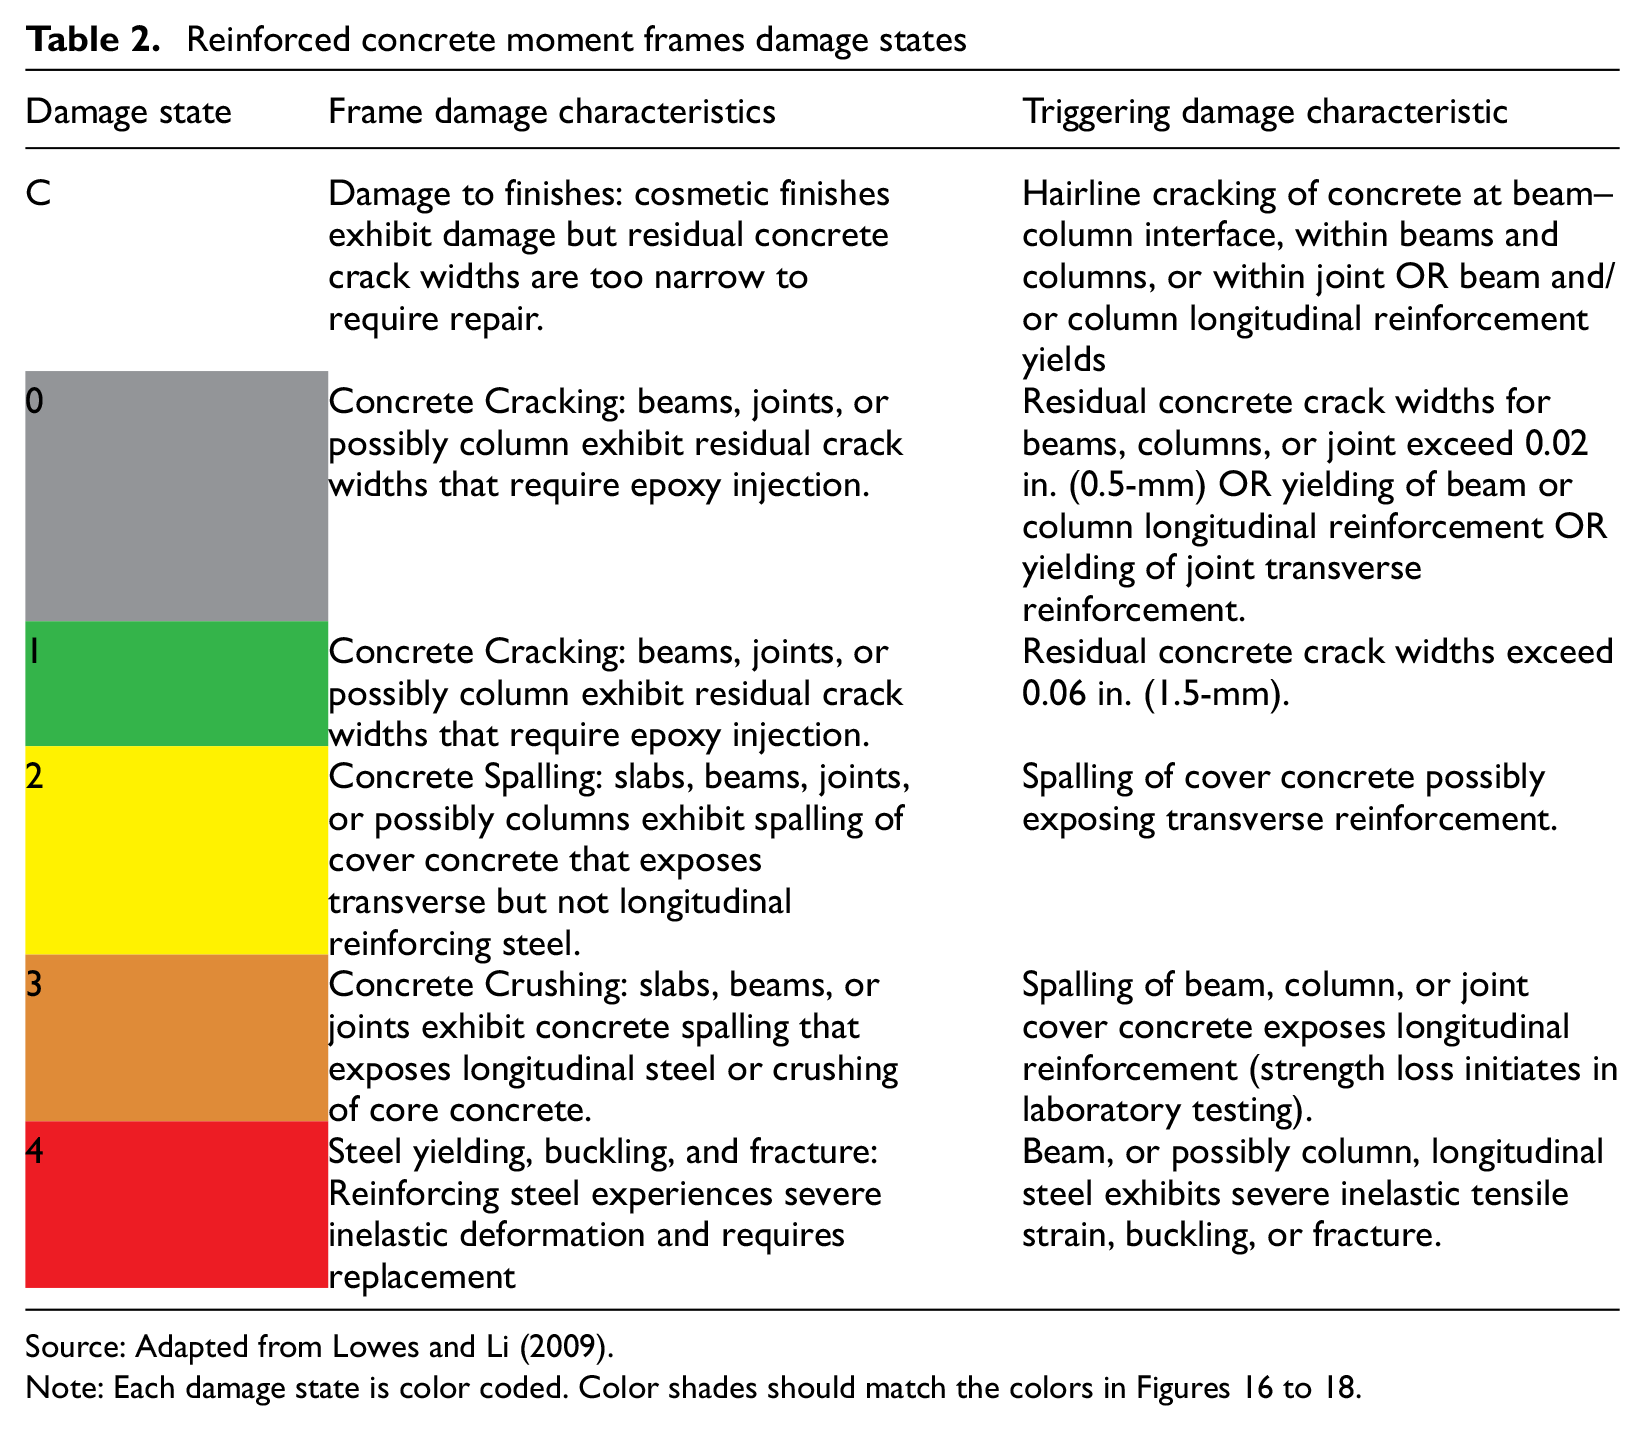
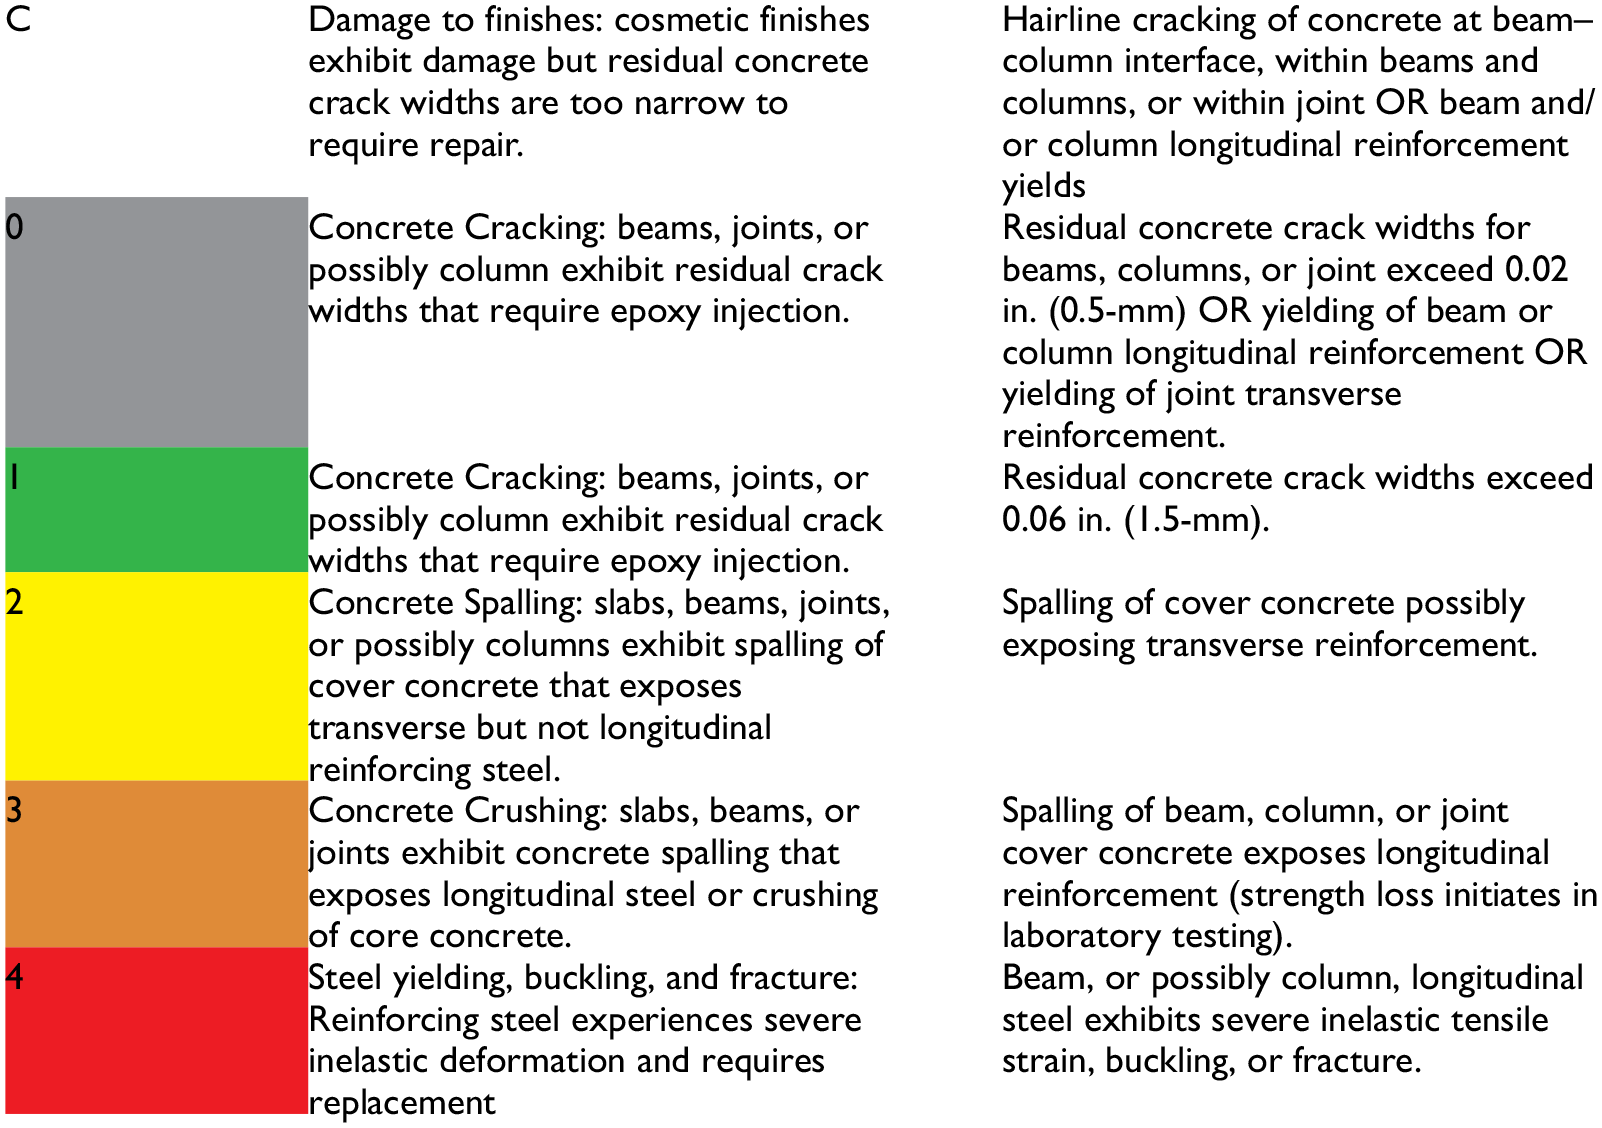
Source: Adapted from Lowes and Li (2009).
Note: Each damage state is color coded. Color shades should match the colors in Figures 16 to 18.
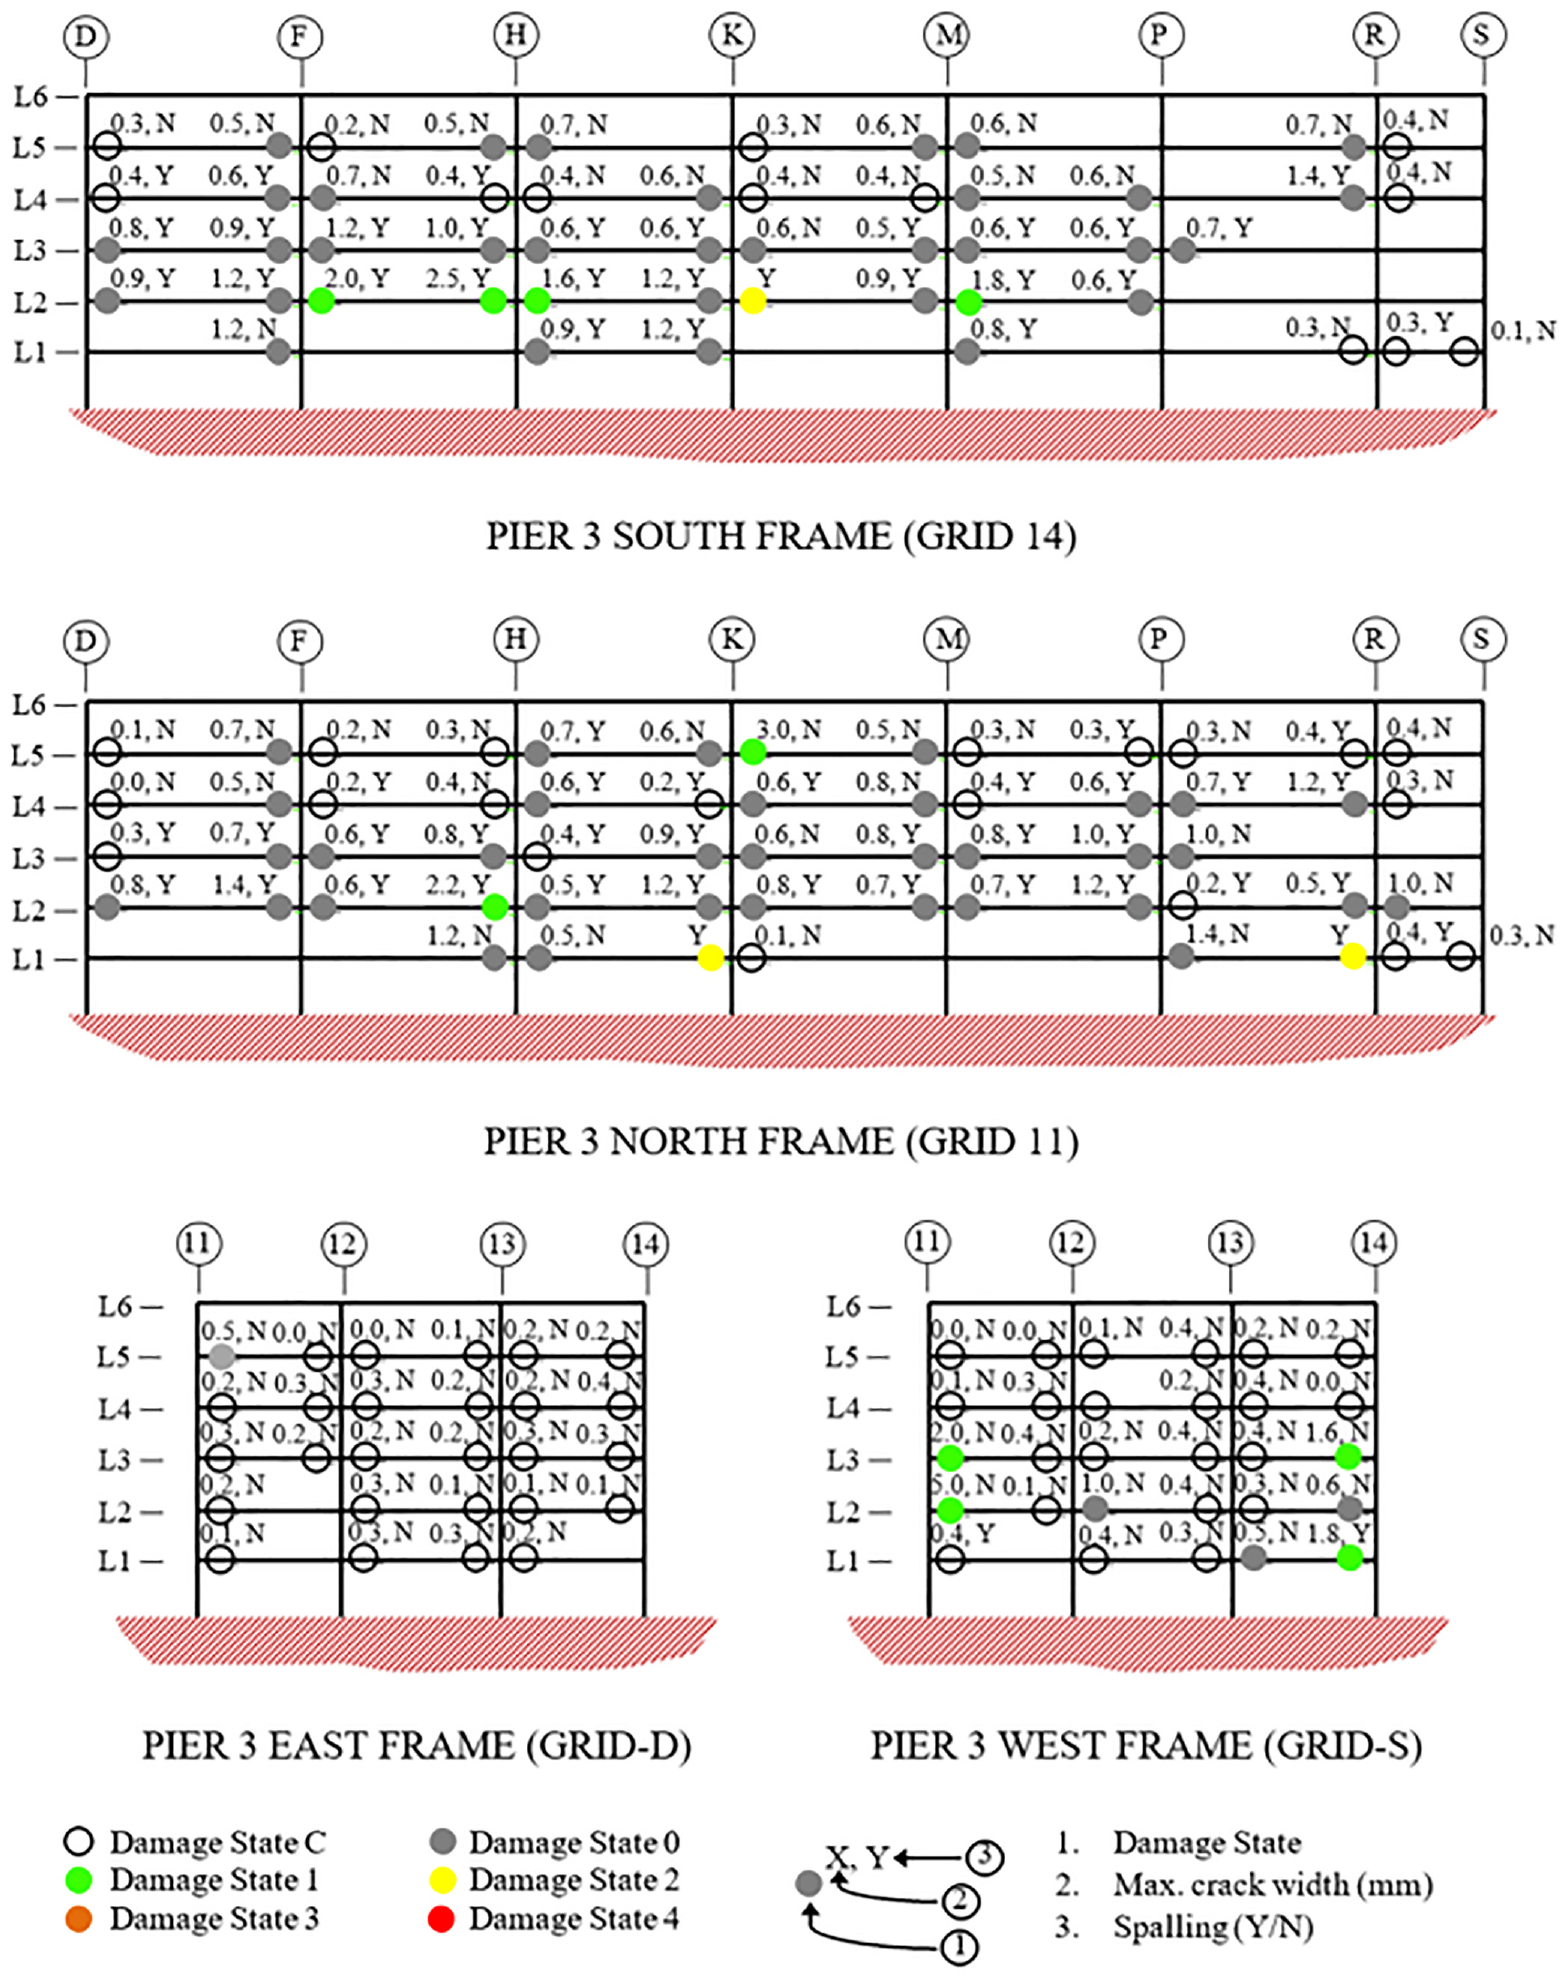
Beams end damage state elevations for Pier 3 primary frames.
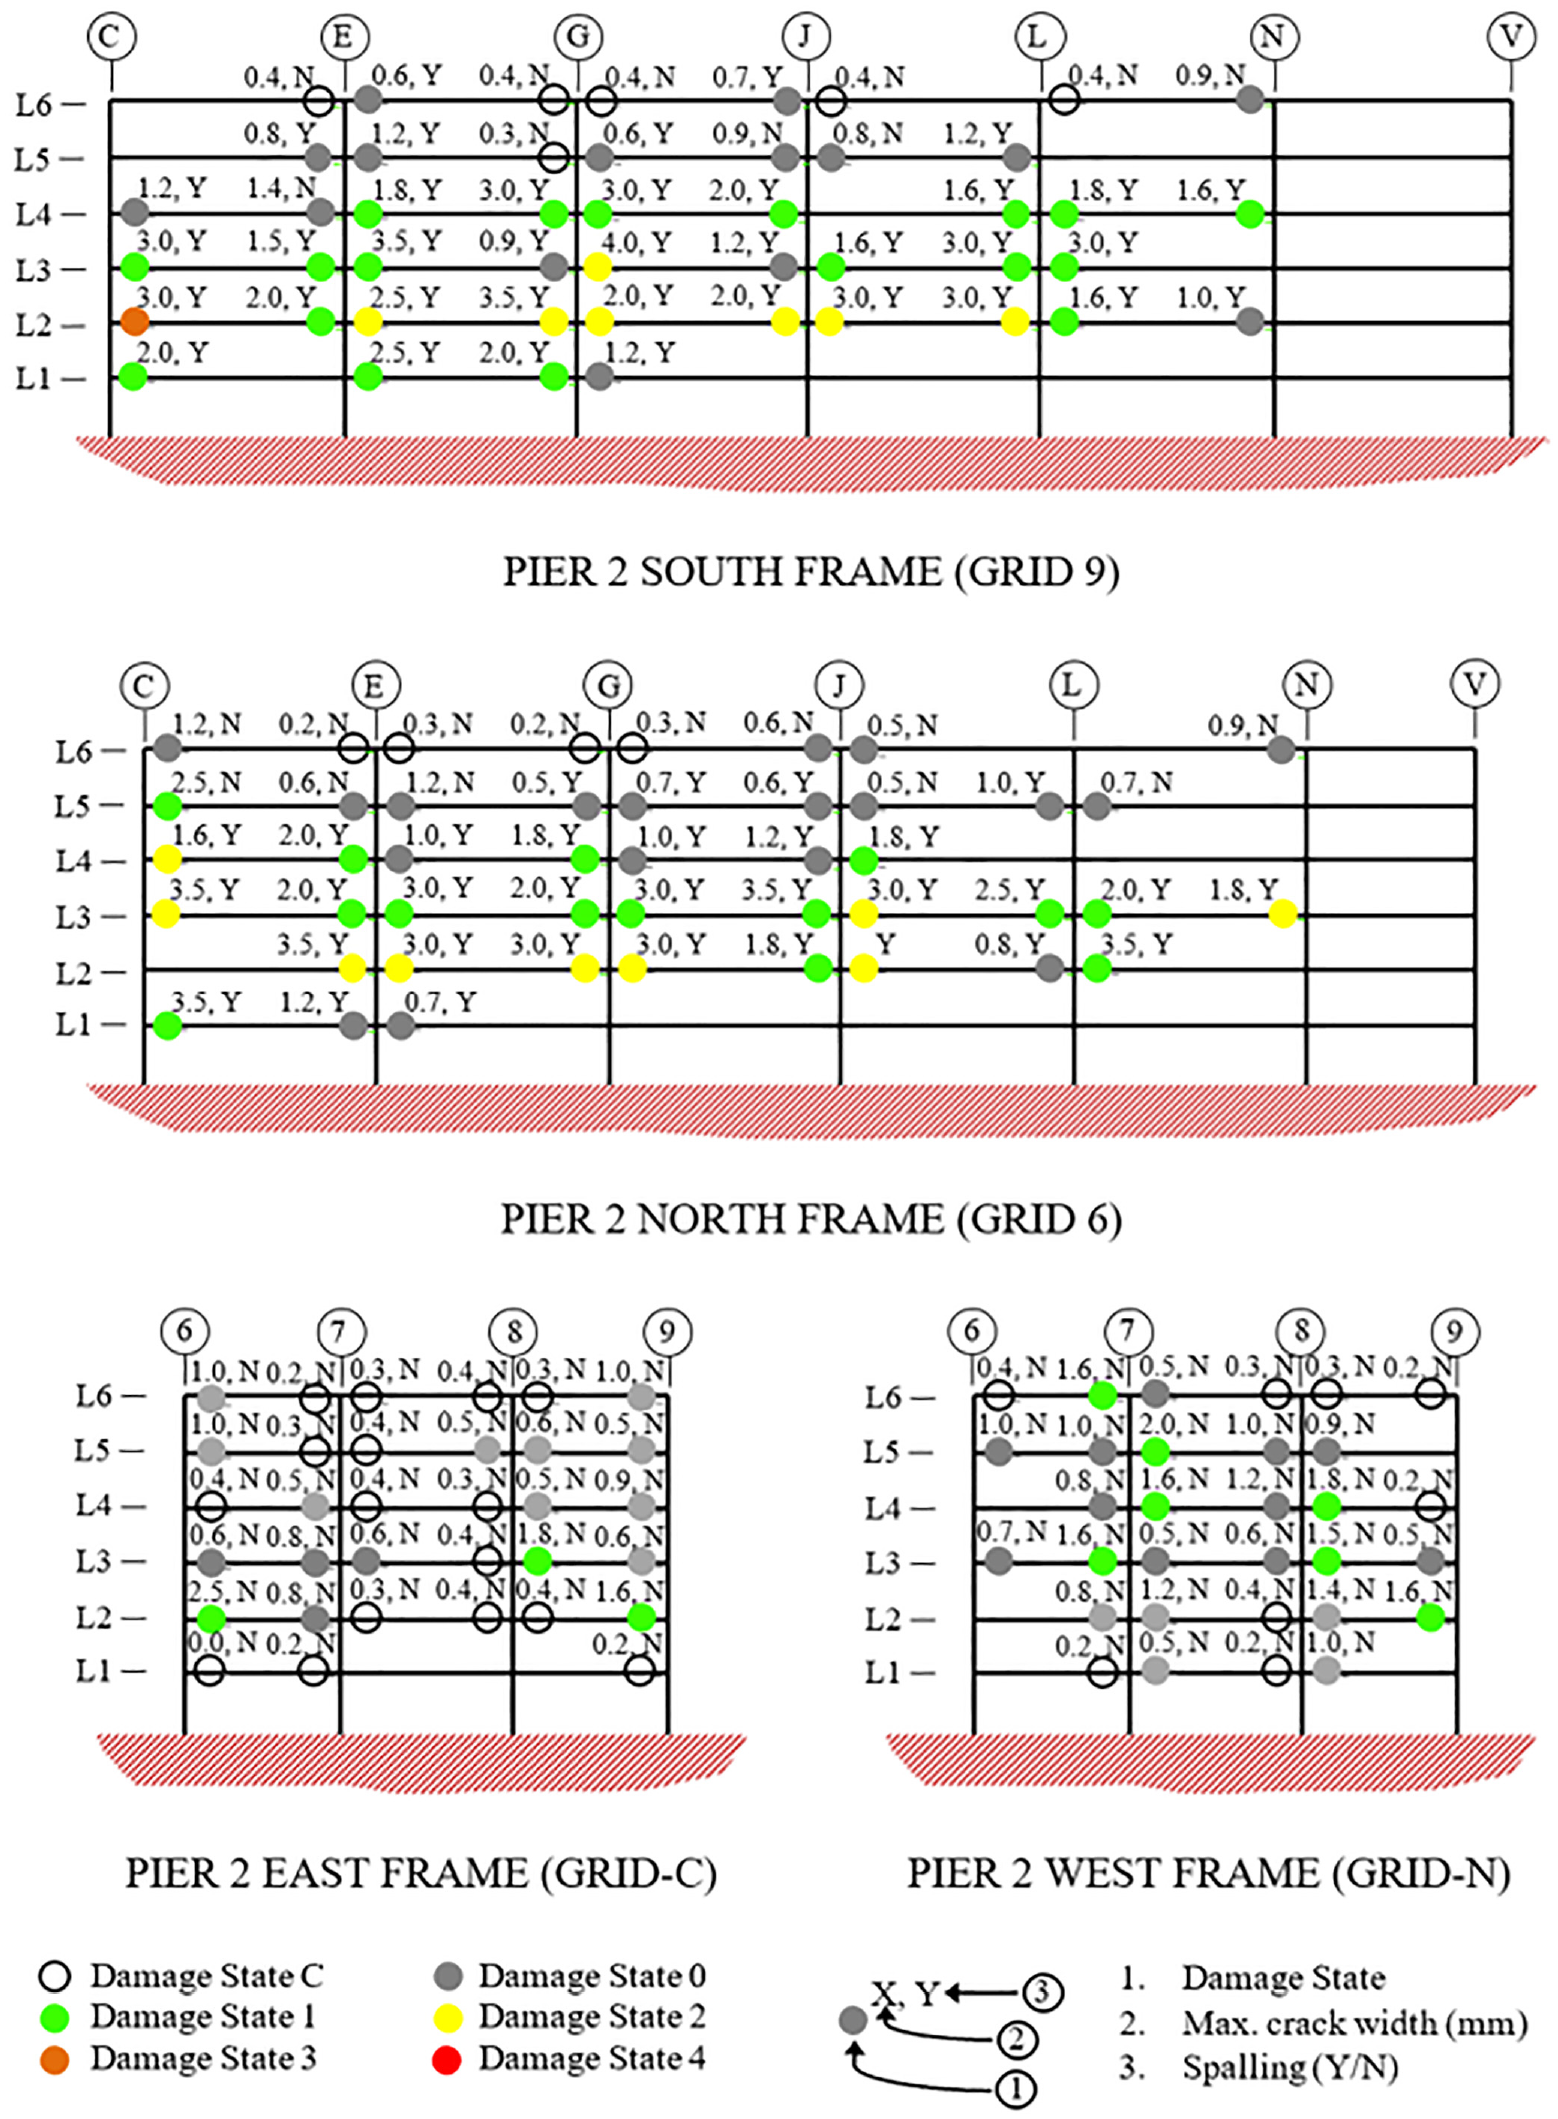
Beams end damage state elevations for Pier 2 primary frames.
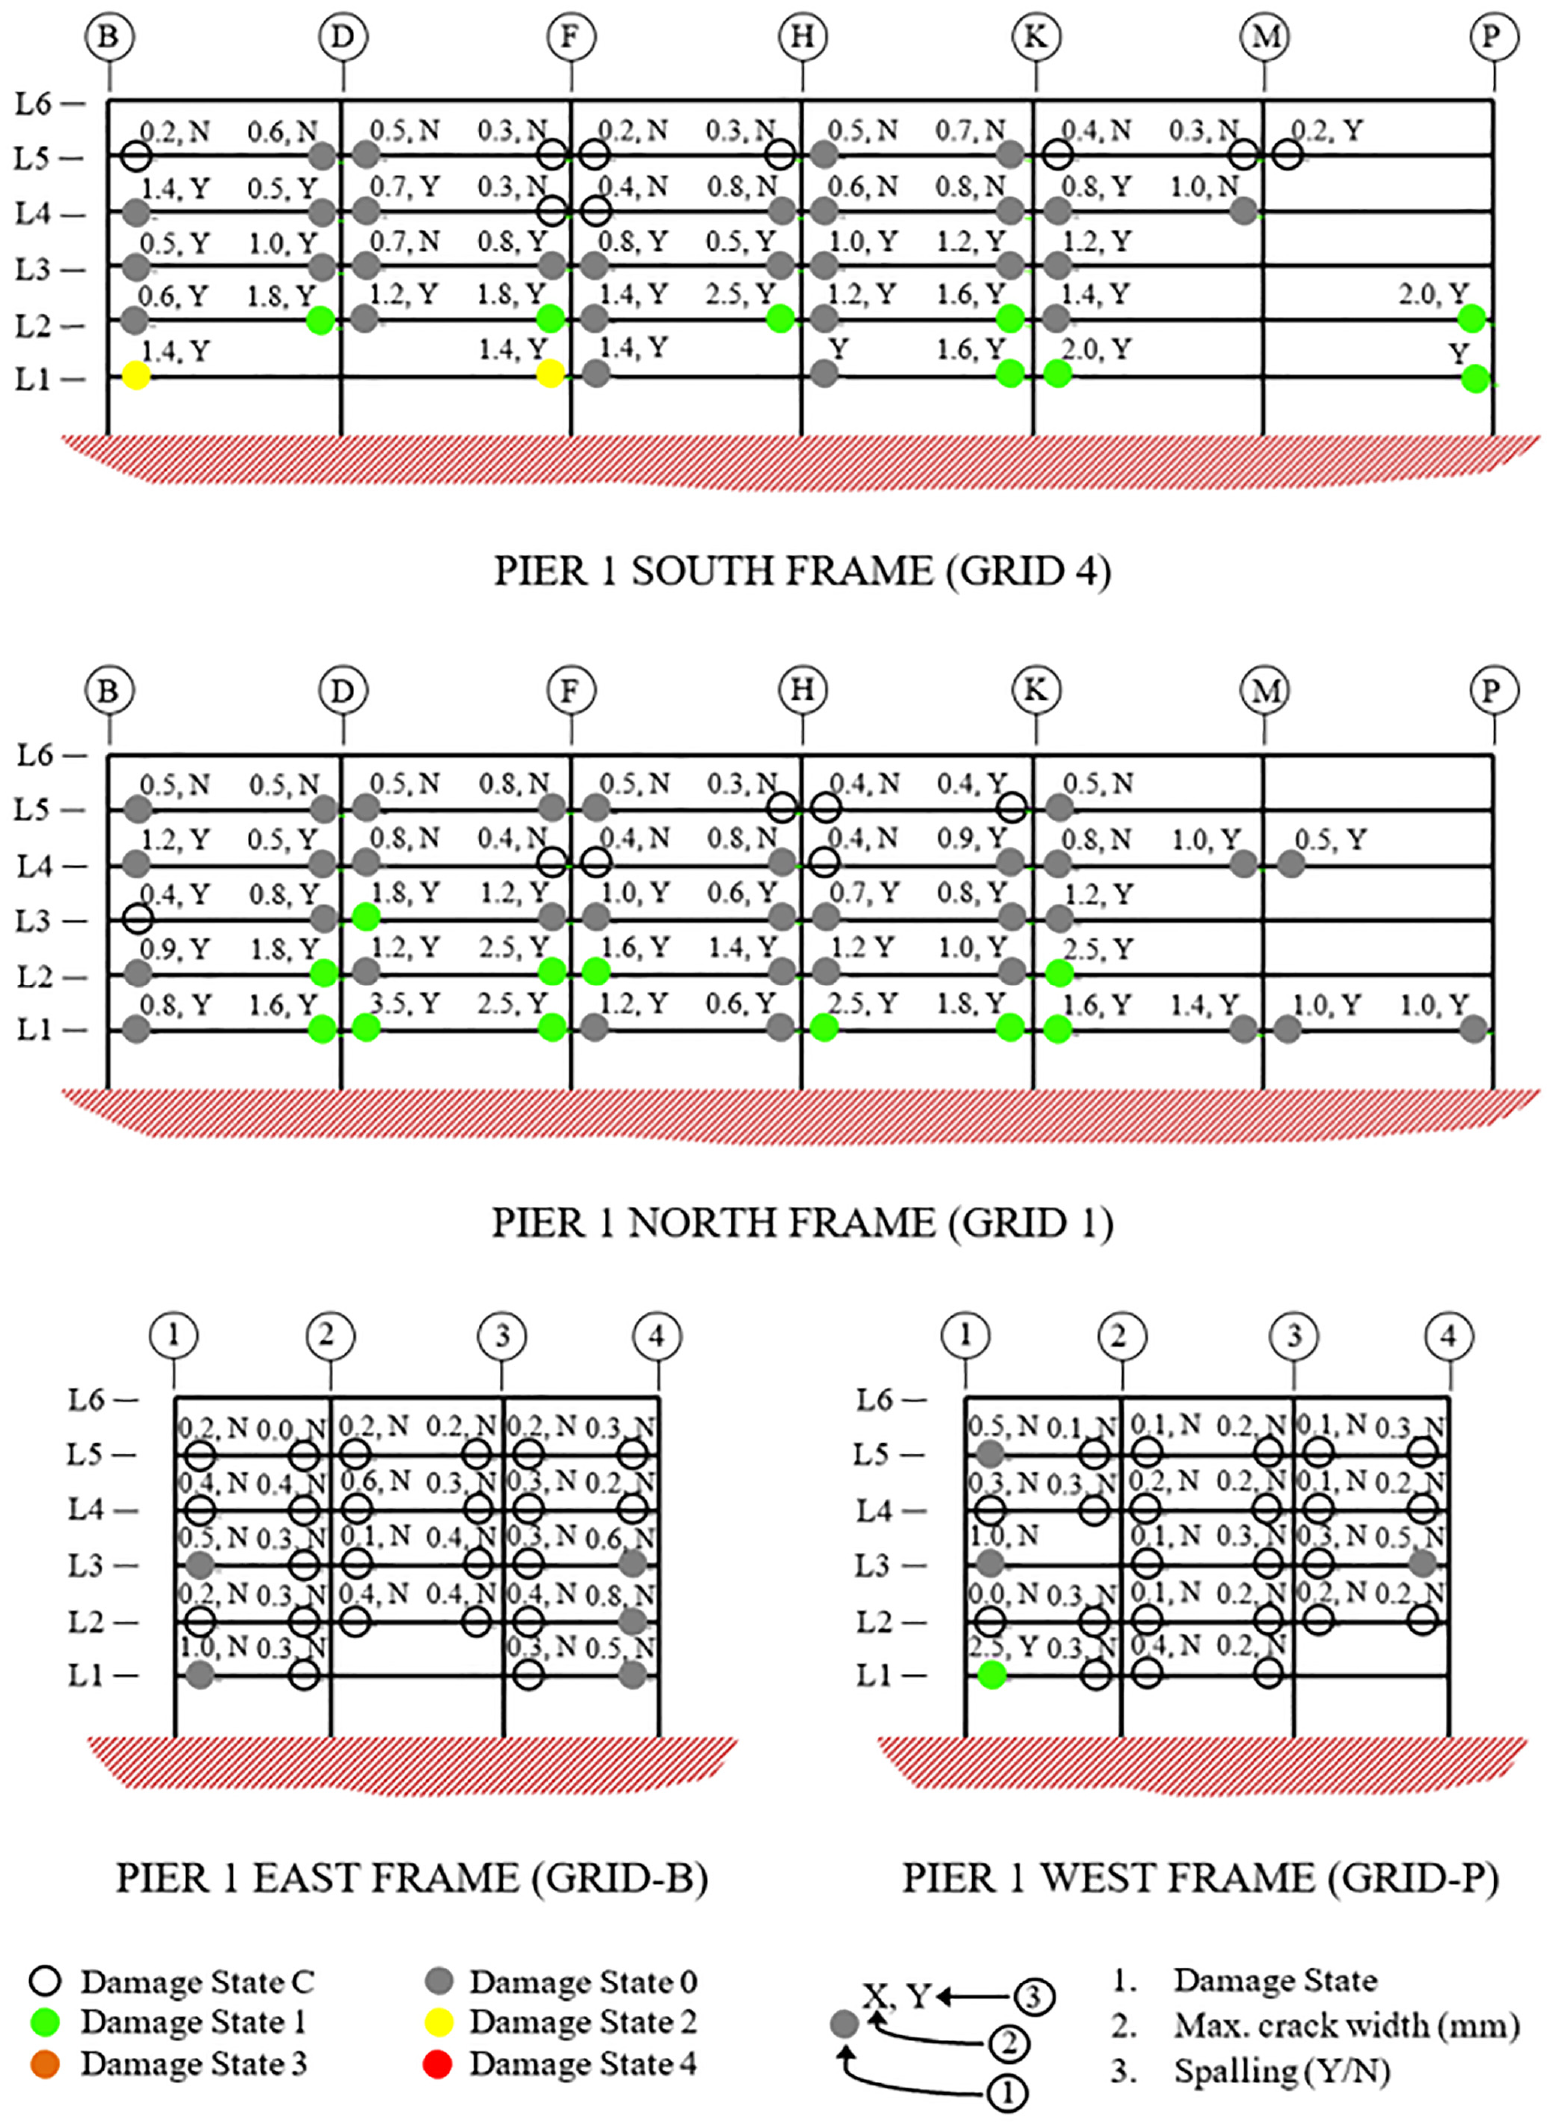
Beams end damage state elevations for Pier 1 primary frames.
Floor damage
Background
The extrusion process used to manufacture HC floor unit prevents shear reinforcement from being provided. Furthermore, HC floor unit are usually supported at the ends where prestressing strands in the bottom flange of the HC floor unit are less effective (i.e. within the transfer length of the prestressed strand). The lack of transverse shear reinforcement accompanied by the lower bond in the transfer length makes HC floor units inherently prone to brittle failure modes during an earthquake. The likely failure mechanisms of HC floor units under seismic actions have been recognized and extensively investigated since the early 2000s, as summarized in Corney et al. (2021) and Puranam et al. (2021).
Previous research (Jensen, 2006; Liew, 2004; Woods, 2008) has observed that transverse cracking at the top or bottom of the HC floor unit due to deformation compatibility between the precast floor units and the supporting structure during an earthquake is usually associated with cracking propagation through the unreinforced webs, which can lead to sudden brittle failure. Therefore, if cracking was evident in the soffit of the HC floor unit, gravity load capacity is likely compromised due to probable cracking of the unreinforced floor units’ webs.
Damage observed
After removing the nonstructural elements such as ceilings, carpets, linings, and paneling, detailed damage inspections of the floor units were undertaken. The extent of floor diaphragm (floor topping) damage was mapped, and crack widths were measured. Inspection of the damage sustained in the soffit of the HC floor units and reduction in support length due to seating ledge spalling were also conducted.
The diaphragm damage observed in the topping of the floors was ubiquitous throughout the building. The damage primarily consisted of longitudinal cracks between adjacent HC floor units and within the width of units with residual crack widths reaching approximately 7-mm and concentrated transverse and longitudinal cracking around the columns with crack widths ranging from hairline to 4 mm wide. For detailed crack maps for diaphragm damage, refer to the data repository (10.17603/ds2-7gcm-ga59) under the “Floor Crack Maps” section.
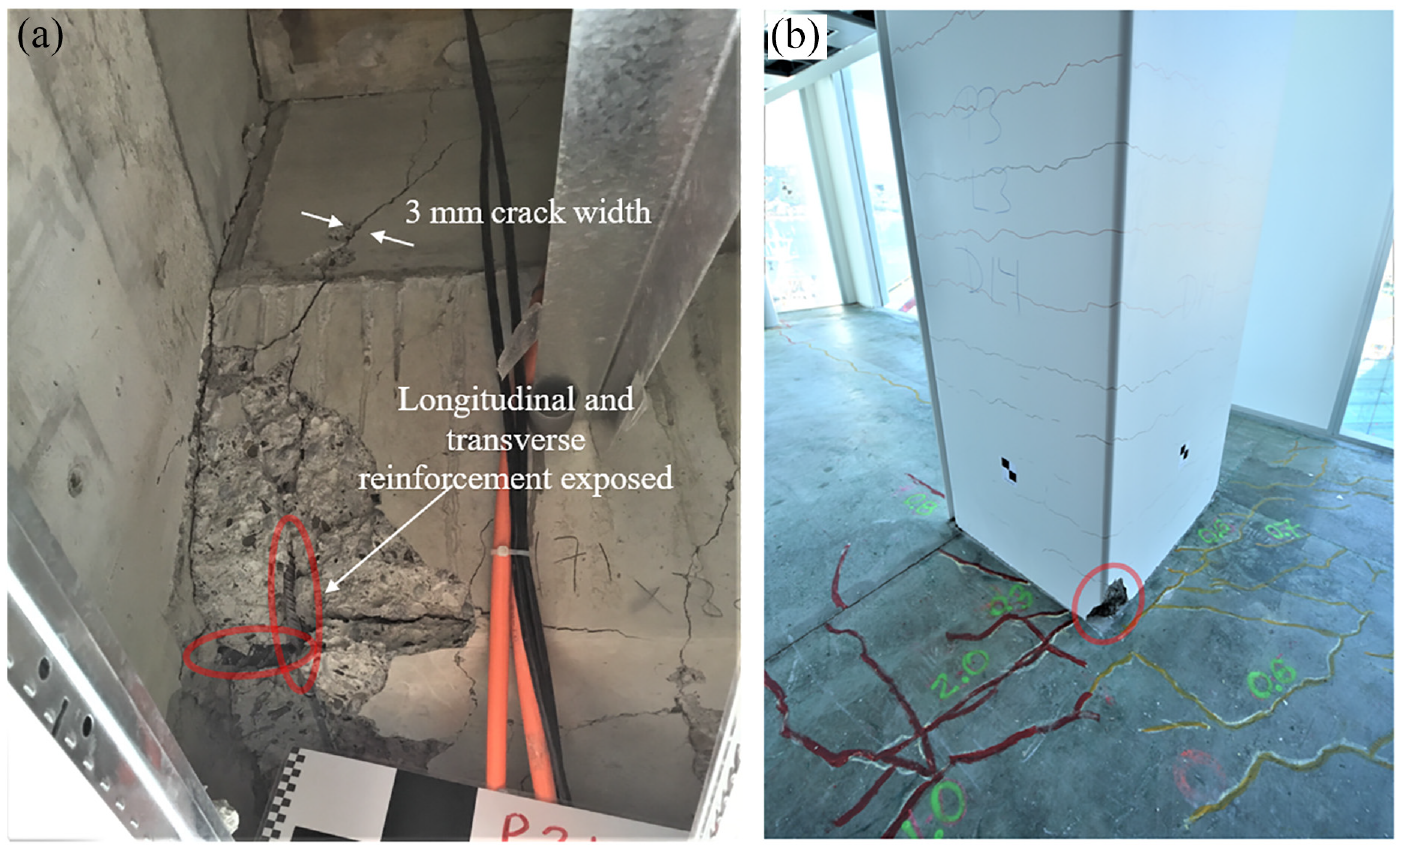
Severe support ledge spalling at the columns and plastic hinge zones was observed in multiple locations in the building (e.g. Figure 19). However, no loss of HC floor unit support was observed due to the ledge reinforcement detailing used in this building.
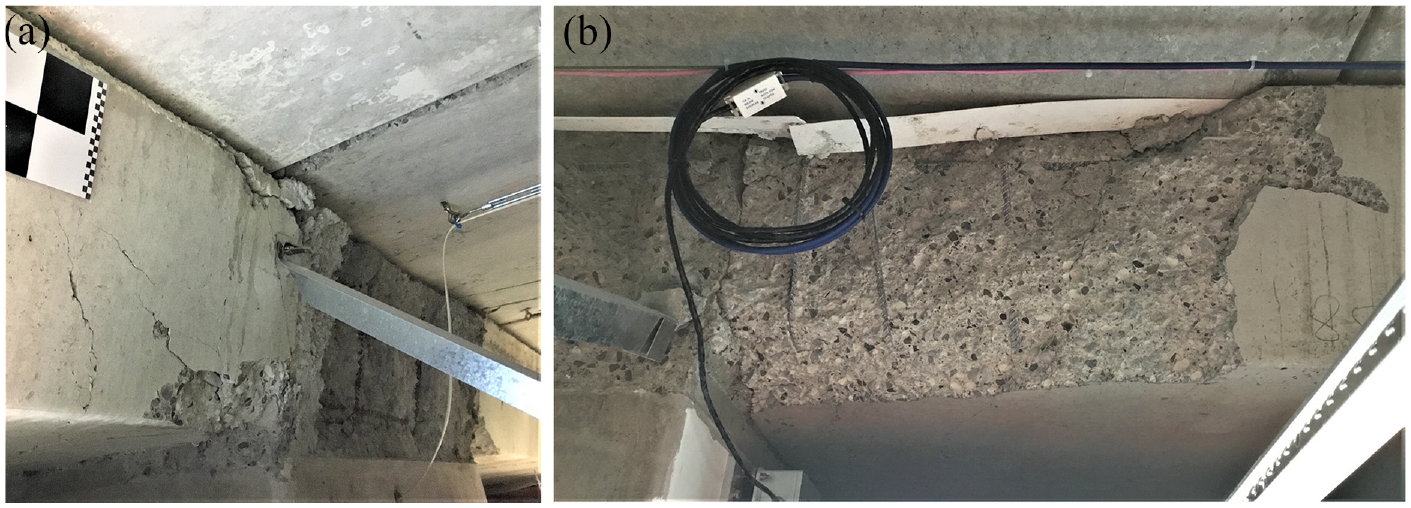
Significant support ledge spalling at different locations in the building. (a) Observed HC floor unit support ledge spalling in pier 2 level 2. (b) Observed HC floor unit support ledge spalling in pier 3 level 1 (Beca Limited, 2017).
As for the HC units damage observed at the soffit of the floor, a significant proportion of the HC floor units in the building sustained some level of damage due to deformation compatibility between the HC floor units and the supporting frames under seismic demands.
The corners of the HC floor units were found to be damaged in many units throughout the building. This corner cracking was found to occur in HC floor units regardless of their location in the building (i.e. seated over a column, within the plastic hinge zone, or outside the plastic hinge zone) with different degrees of damage, as shown in Figure 20.
Different degrees of damage to HC floor unit corners. (a) Minor hairline corner crack. (b) Moderate corner crack. (c) Corner crack propagating through HC floor unit exterior web.
Where the sides of the HC floor units were visible, it was found that the corner cracking observed from the bottom of the units propagated through the external unreinforced web of the unit (Figure 20c). Corner cracking propagation through the external webs could not be confirmed for HC floor units seated within the middle of the floor plate.
In addition to the units’ soffit corner cracking, longitudinal cracking in the bottom flange of the HC floor units was also observed in multiple units with varying degrees of severity, from hairline cracking to wide cracks that extended the full length of the HC floor unit. Longitudinal cracking might be problematic if the cracking crossed a web (Figure 21a), which was typically found in units seated within the plastic hinge zone. Longitudinal cracking of HC floor units seated within the plastic hinge region occurs due to the deformation of the supporting beam under seismic demands and can be accompanied by web cracking that may result in a compromised gravity load carrying capacity. Web cracking was identified in the units seated within the plastic hinge region via a borescope (Figure 21b).
(a) Longitudinal cracking of HC floor unit soffit. (b) Web cracking observed via a borescope inside the cell of an HC floor unit with longitudinal cracking observed at the soffit.
Transverse cracking in the soffit of the HC floor units was also observed in multiple units. Based on previous research observations (Fenwick et al., 2010), such damage indicates cracking propagation through the unreinforced unit webs. Several floor units throughout the building were temporarily propped immediately after the earthquake as the damage observed in these units suggested that their gravity load-carrying capacity had been compromised.
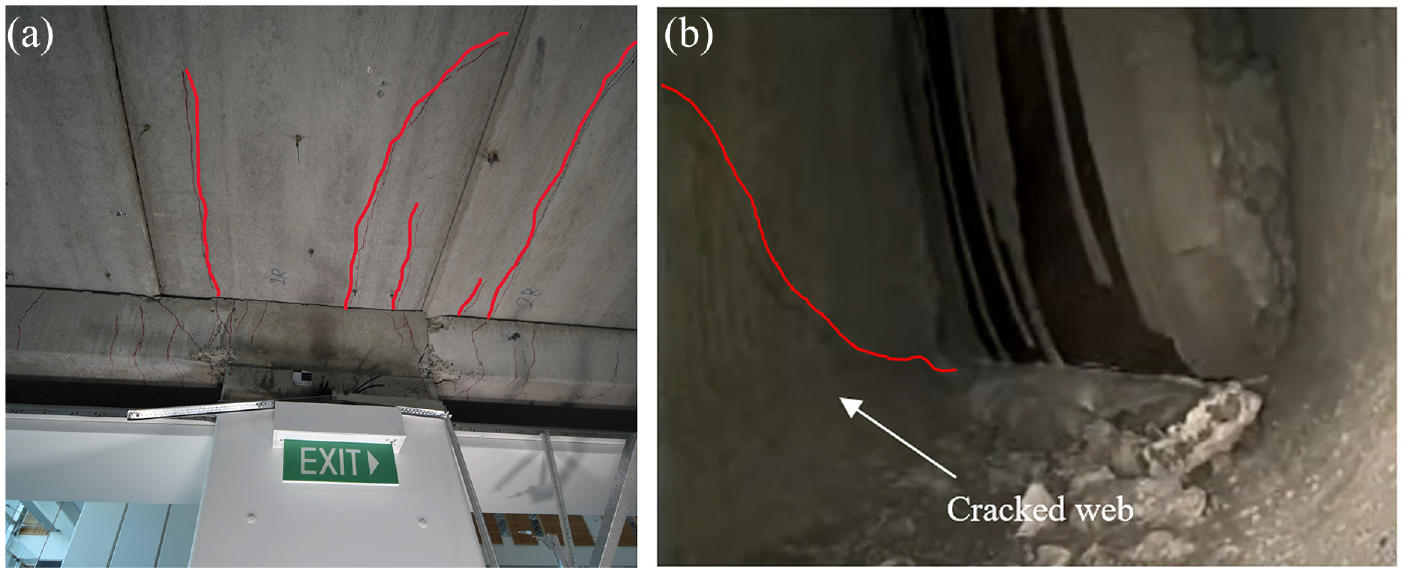
Furthermore, crack propagation through the unreinforced webs of the HC floor units was observed in multiple units where the side of the HC floor unit was visible (Figure 22a). In one of these units with exposed sides, severe web cracking of approximately 30-mm wide was observed (Figure 22b). Moreover, web cracking was evident in units where the side of the HC floor unit was visible, with no signs of damage observed at the HC floor unit’s soffit (Figure 23). Such observations raise concerns regarding the risk these floors possess, given the inability to inspect these webs without invasive techniques such as the use of a borescope.
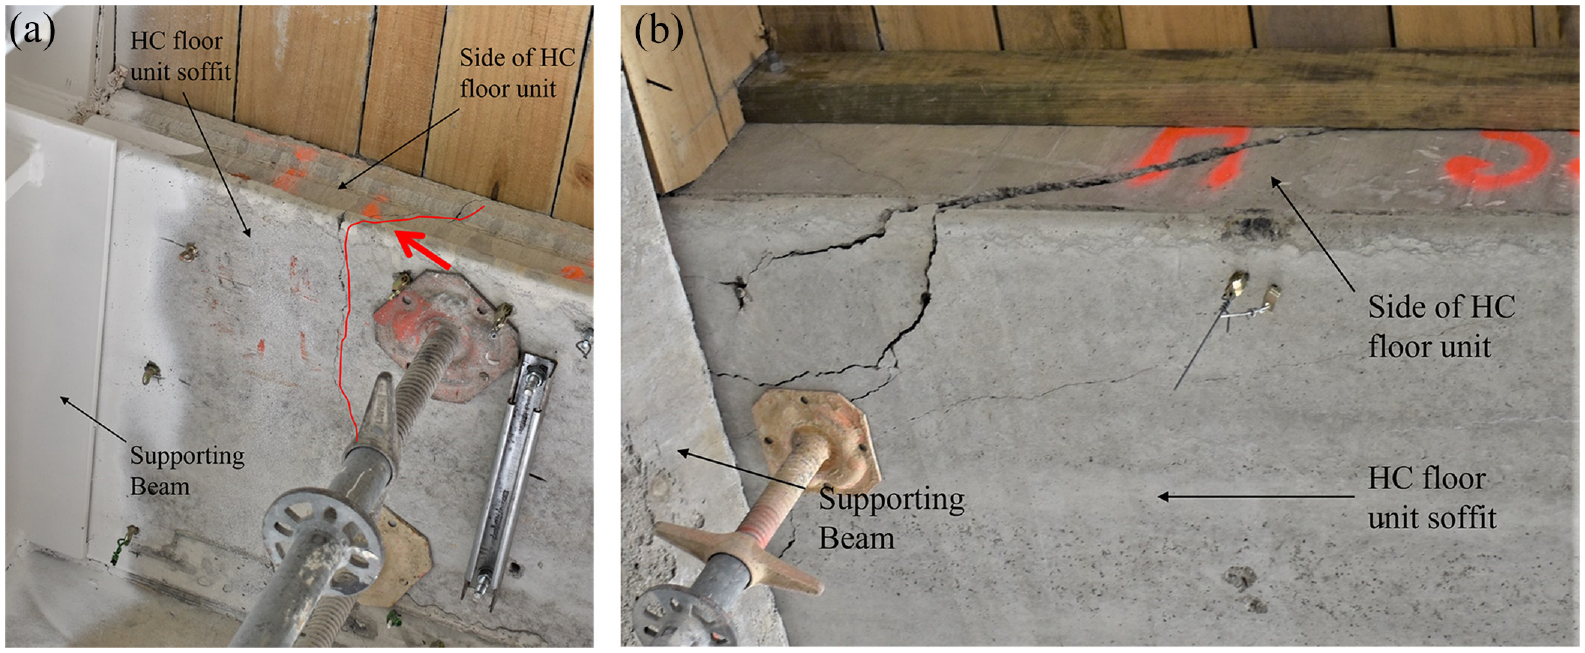
(a) Transverse cracking observed at the soffit of the HC floor units away from the support propagating through the unreinforced web of the floor unit. (b) Severe web cracking (about 30-mm) propagating through the unreinforced web of the floor unit with the floor unit corner being damaged and the HC floor units dropping.
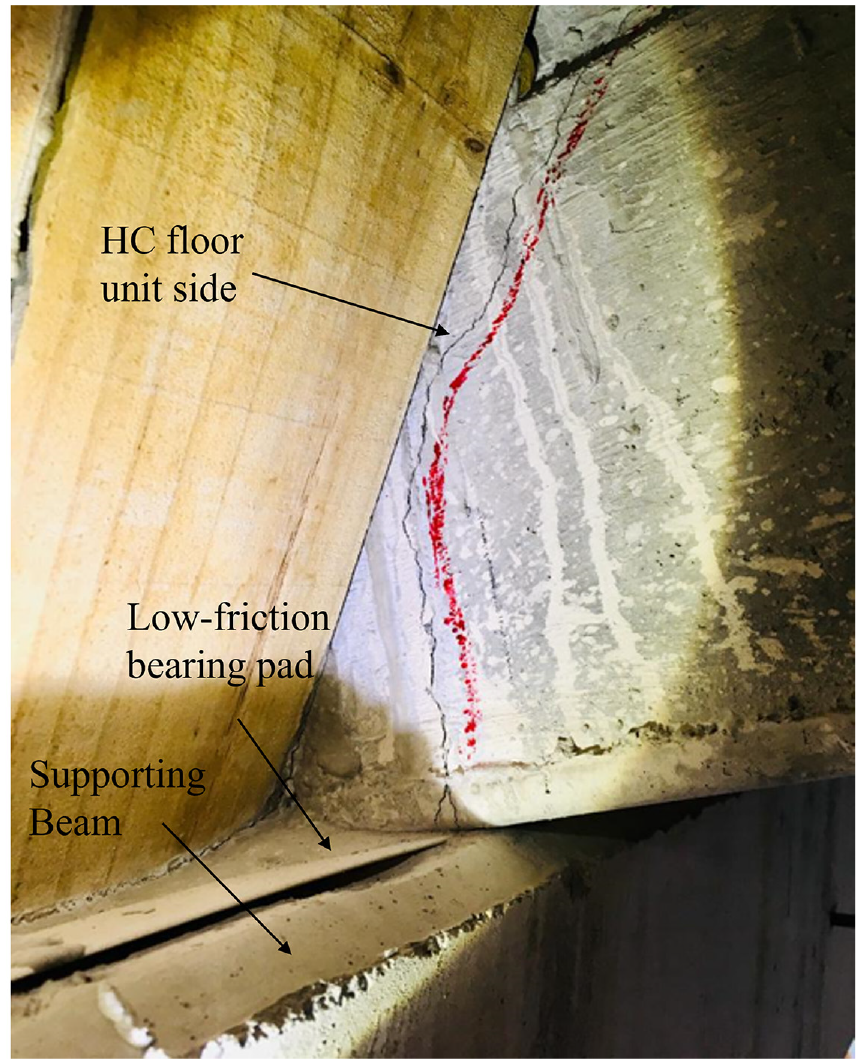
HC floor unit web cracking observed from unit side.
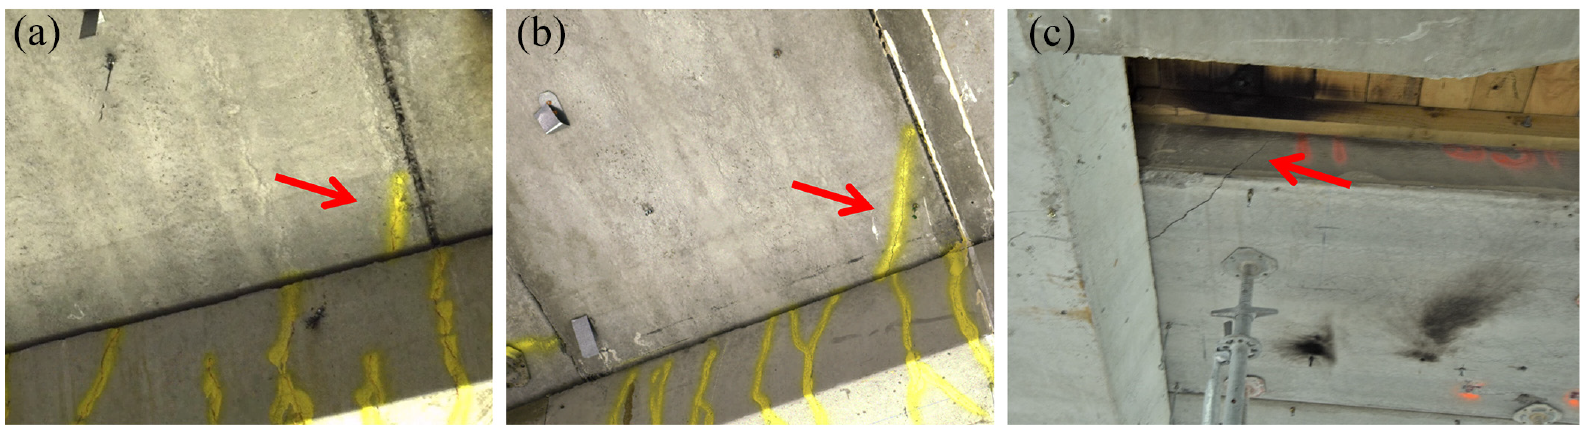
In addition to the units’ corner, longitudinal, and transverse cracking, a damage pattern that has not been previously observed in either test specimens (Liew, 2004; Lindsay, 2004; MacPherson, 2005; Matthews, 2004; Mejia-McMaster, 1994) or other post-earthquake damage observations of HC floor units (Henry et al., 2017) was observed repeatedly throughout the building. The damage pattern primarily consisted of the two corners of the HC floor unit ends being cracked, accompanied by a curved transverse cracking about 300-mm away from the support (Figure 24). This damage pattern was found in units seated on a column, where these units have been subjected to a combination of bending demands in both transverse and longitudinal directions of the units during the earthquake shaking. HC floor units exhibiting this damage pattern were located on different floors that were subjected to different drift demands.
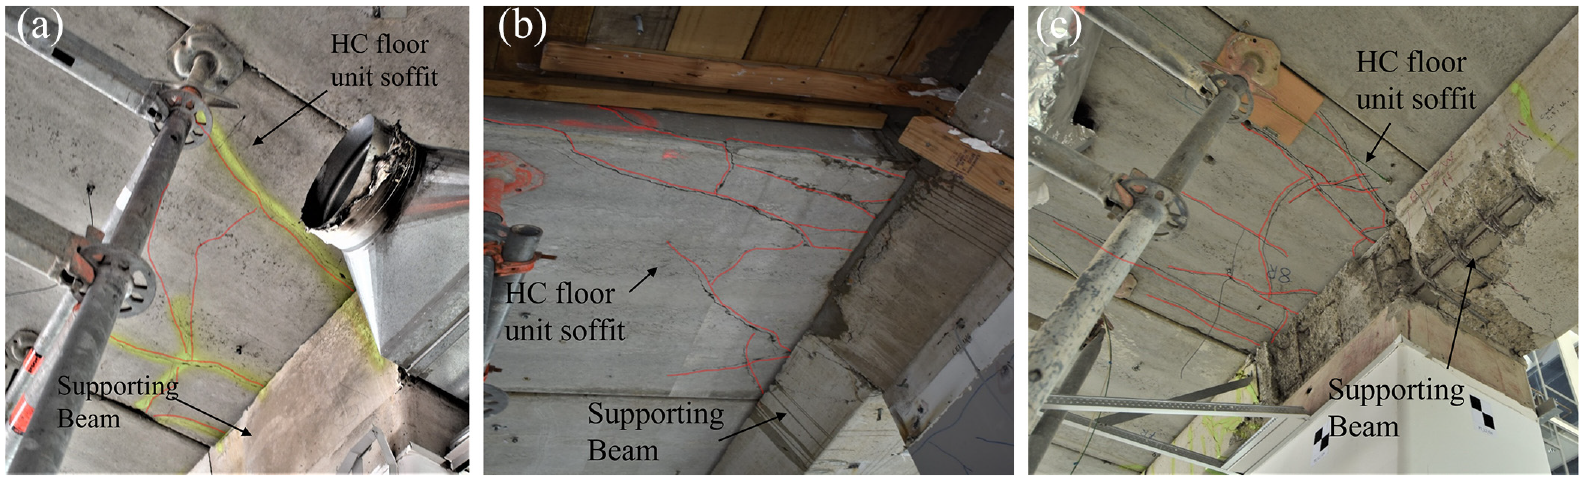
Repeated damage pattern observed in the soffit of the HC floor unit highlighted in red. (a) Pier 2, Level 4. (b) Pier 3, Level 2. (c) Pier 2, Level 3 (damage to the supporting beam in this picture is due to extracting reinforcement bars for testing).
Nevertheless, the damage observed in the HC floor units can generally be categorized into seven main damage states, summarized in Table 3, where the damage observed in the floor units was either one of the seven main damage categories or a combination of a couple of them. Figure 25 shows some of the observed damage from the soffit of the HC floor units.
Summary of the damage states observed in the floors
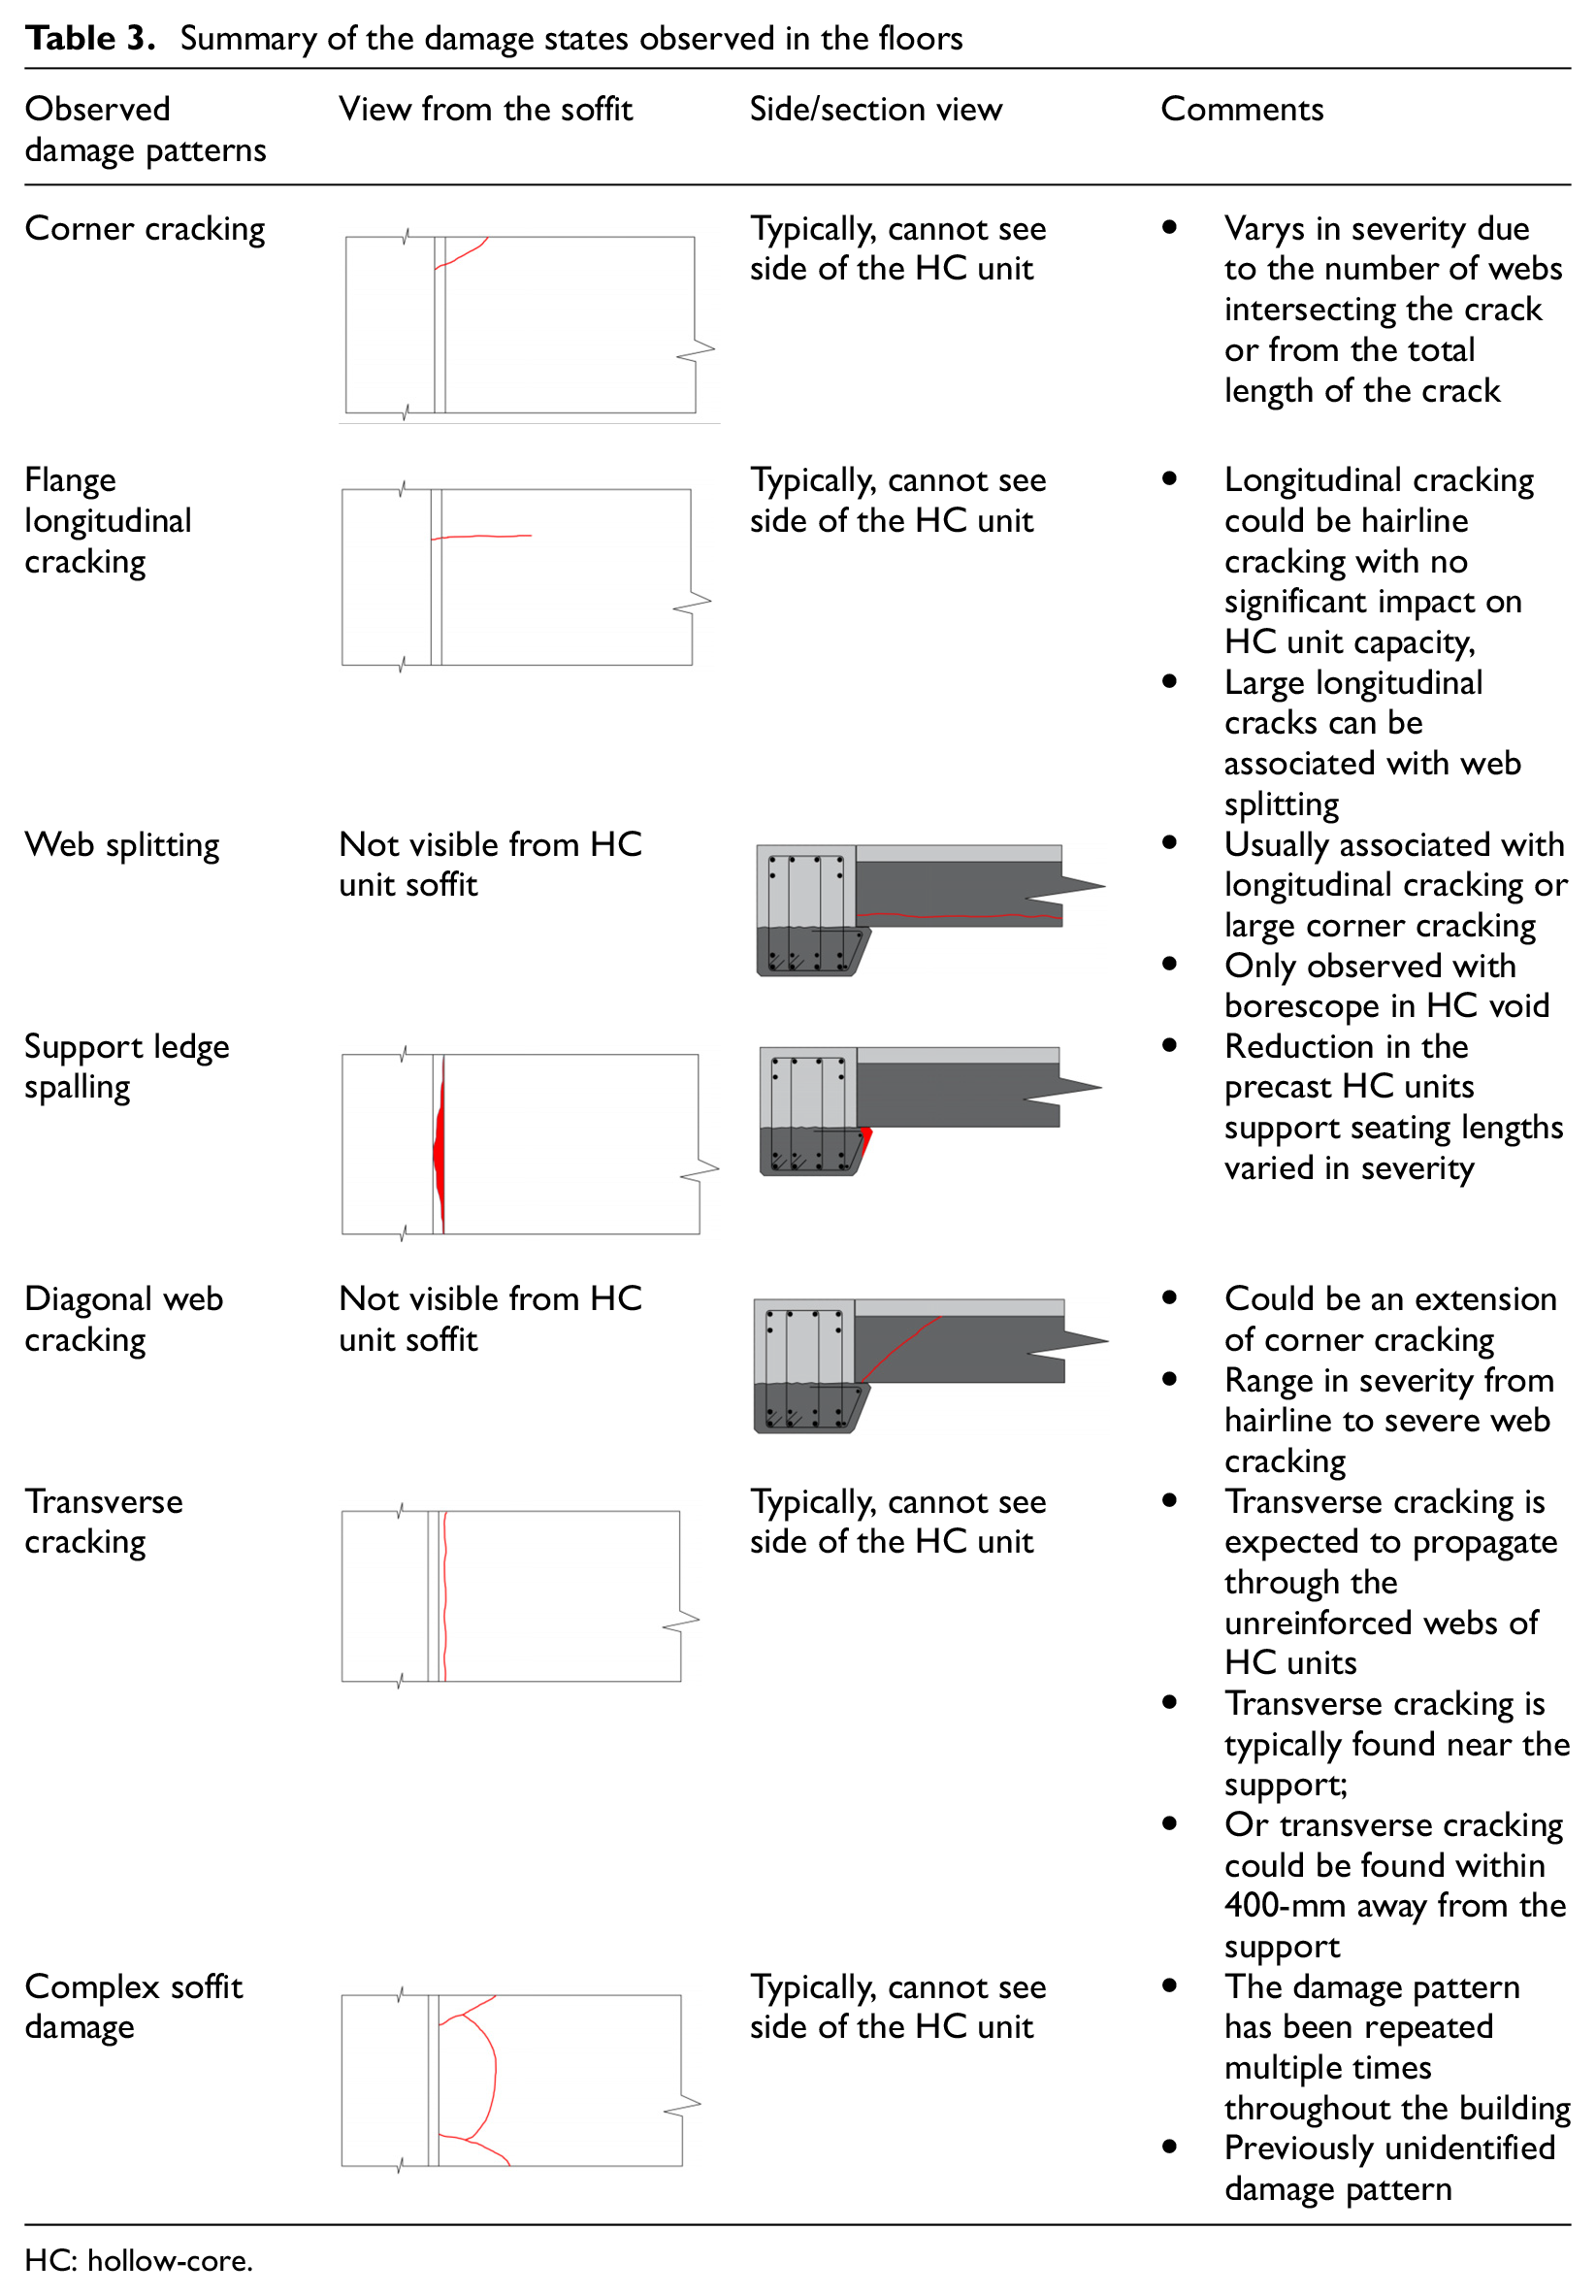
HC: hollow-core.
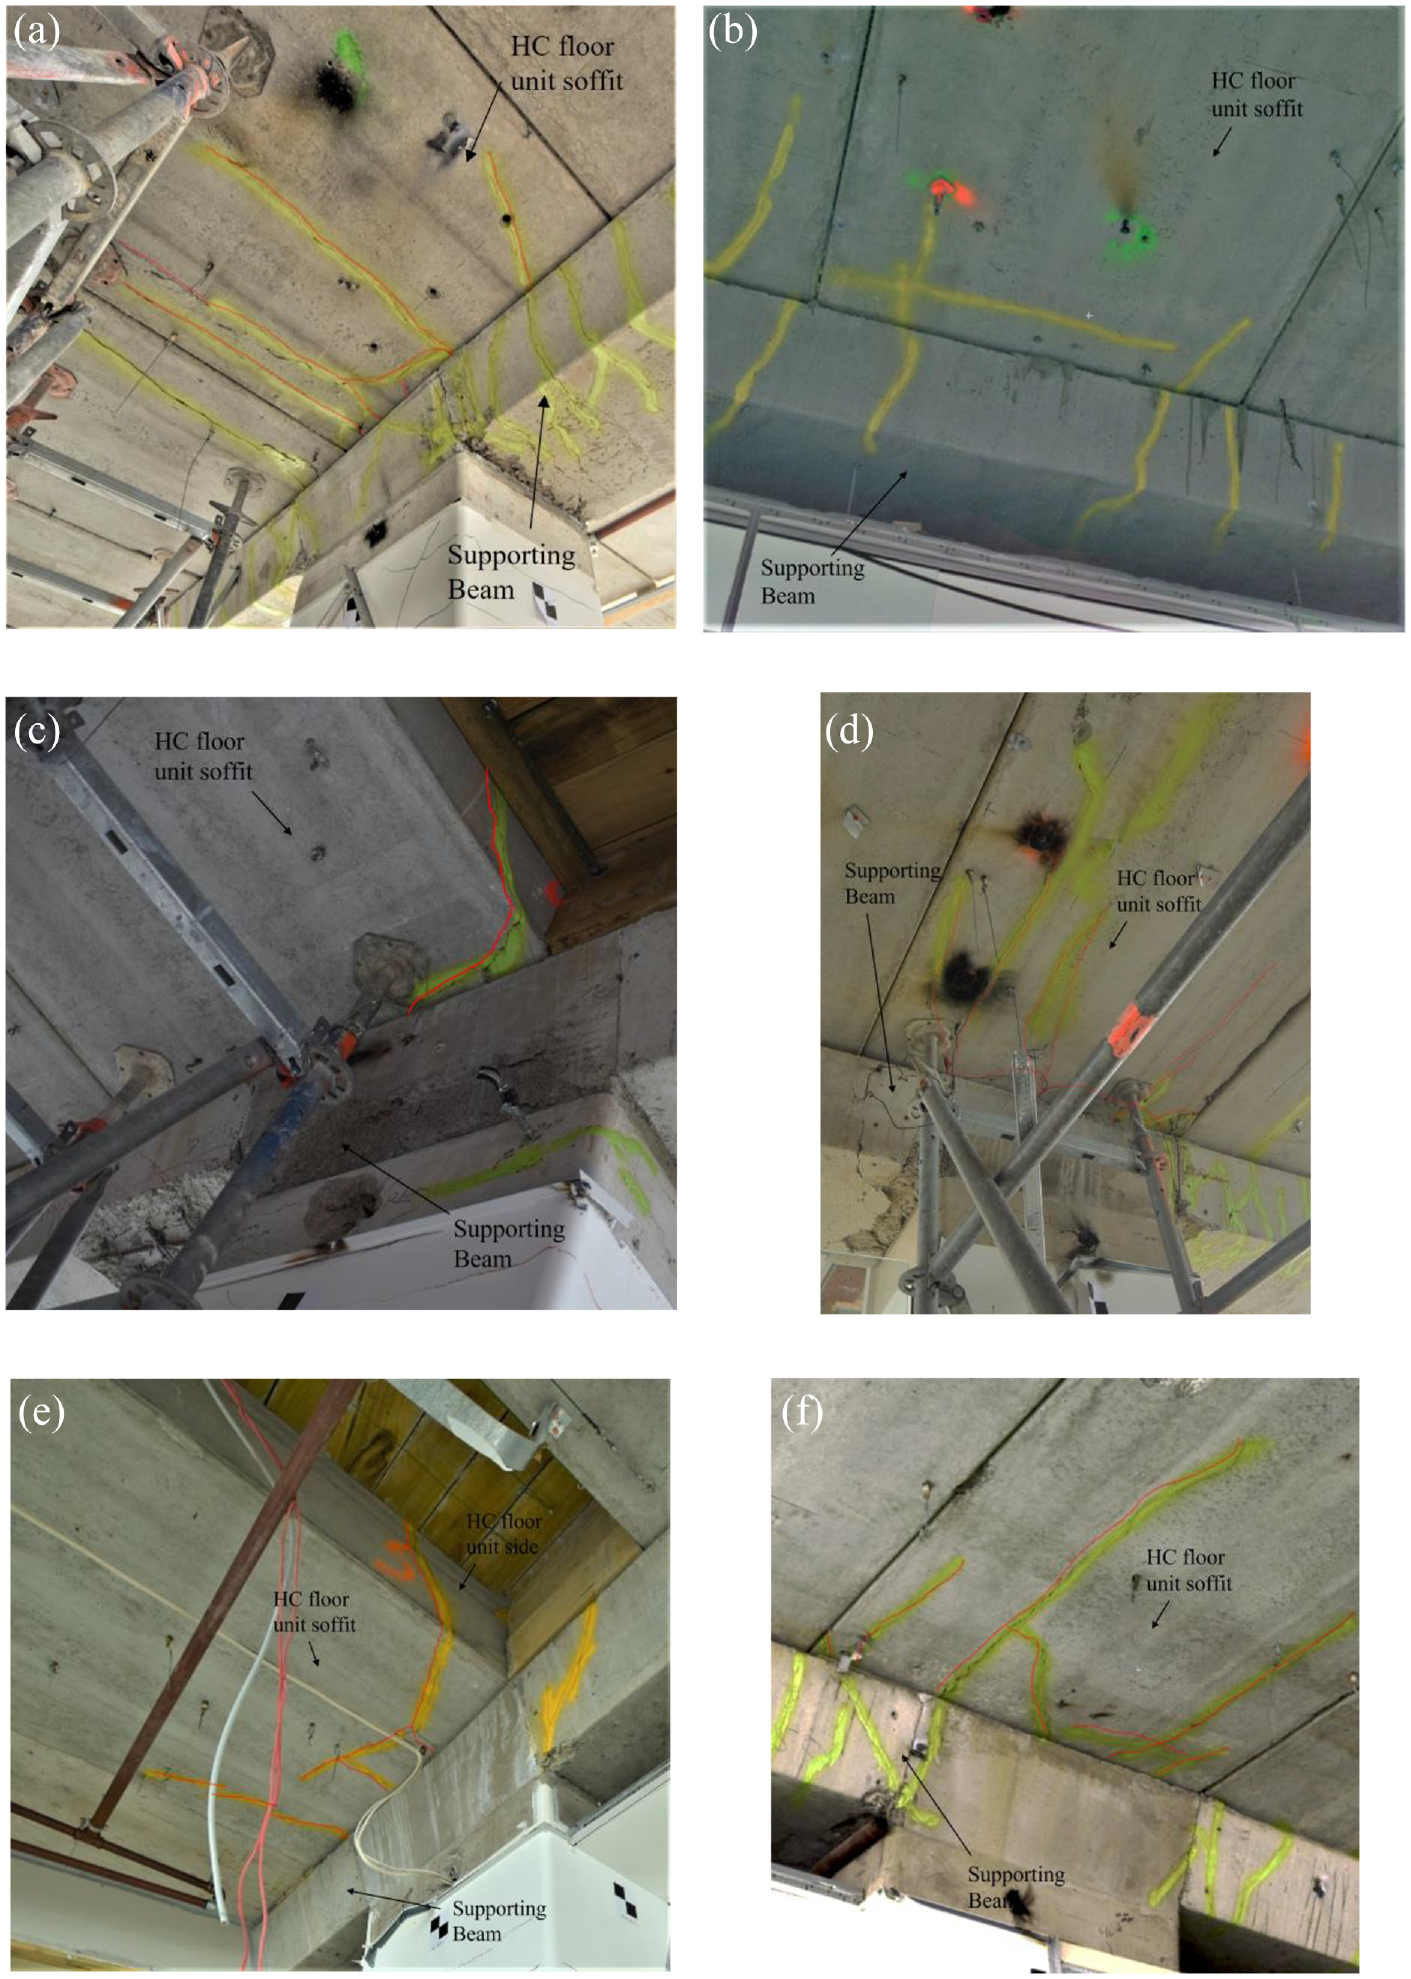
Some of the damage observed in the HC floor units soffit throughout the building highlighted in yellow and red. (a) Longitudinal and transverse cracking. (b) Transverse cracking away from the support. (c) Transverse cracking propagating through the unreinforced web of the HC floor unit. (d) A combination of transverse and longitudinal cracking. (e) Transverse cracking propagating through the unreinforced web of the HC floor unit at level 5. (f) Longitudinal and transverse cracking of the HC floor unit soffit.
Classification of floor damage states
Various degrees of HC floor unit damage were observed throughout the building. Varying from insignificant hairline cracking to wide cracking that compromised the gravity load capacity of the floor unit. To help quantify the extent of damage sustained in the precast HC floor unit, a qualitative damage assessment criterion was developed to classify different observed damage states. Table 4 summarizes the approach used to quantify observed floor damage. Using the defined criterion, the observed damage state at each floor unit was assessed, and a damage state was assigned to each HC unit-end.
Summary of damage quantification framework used to assess different floor damage states
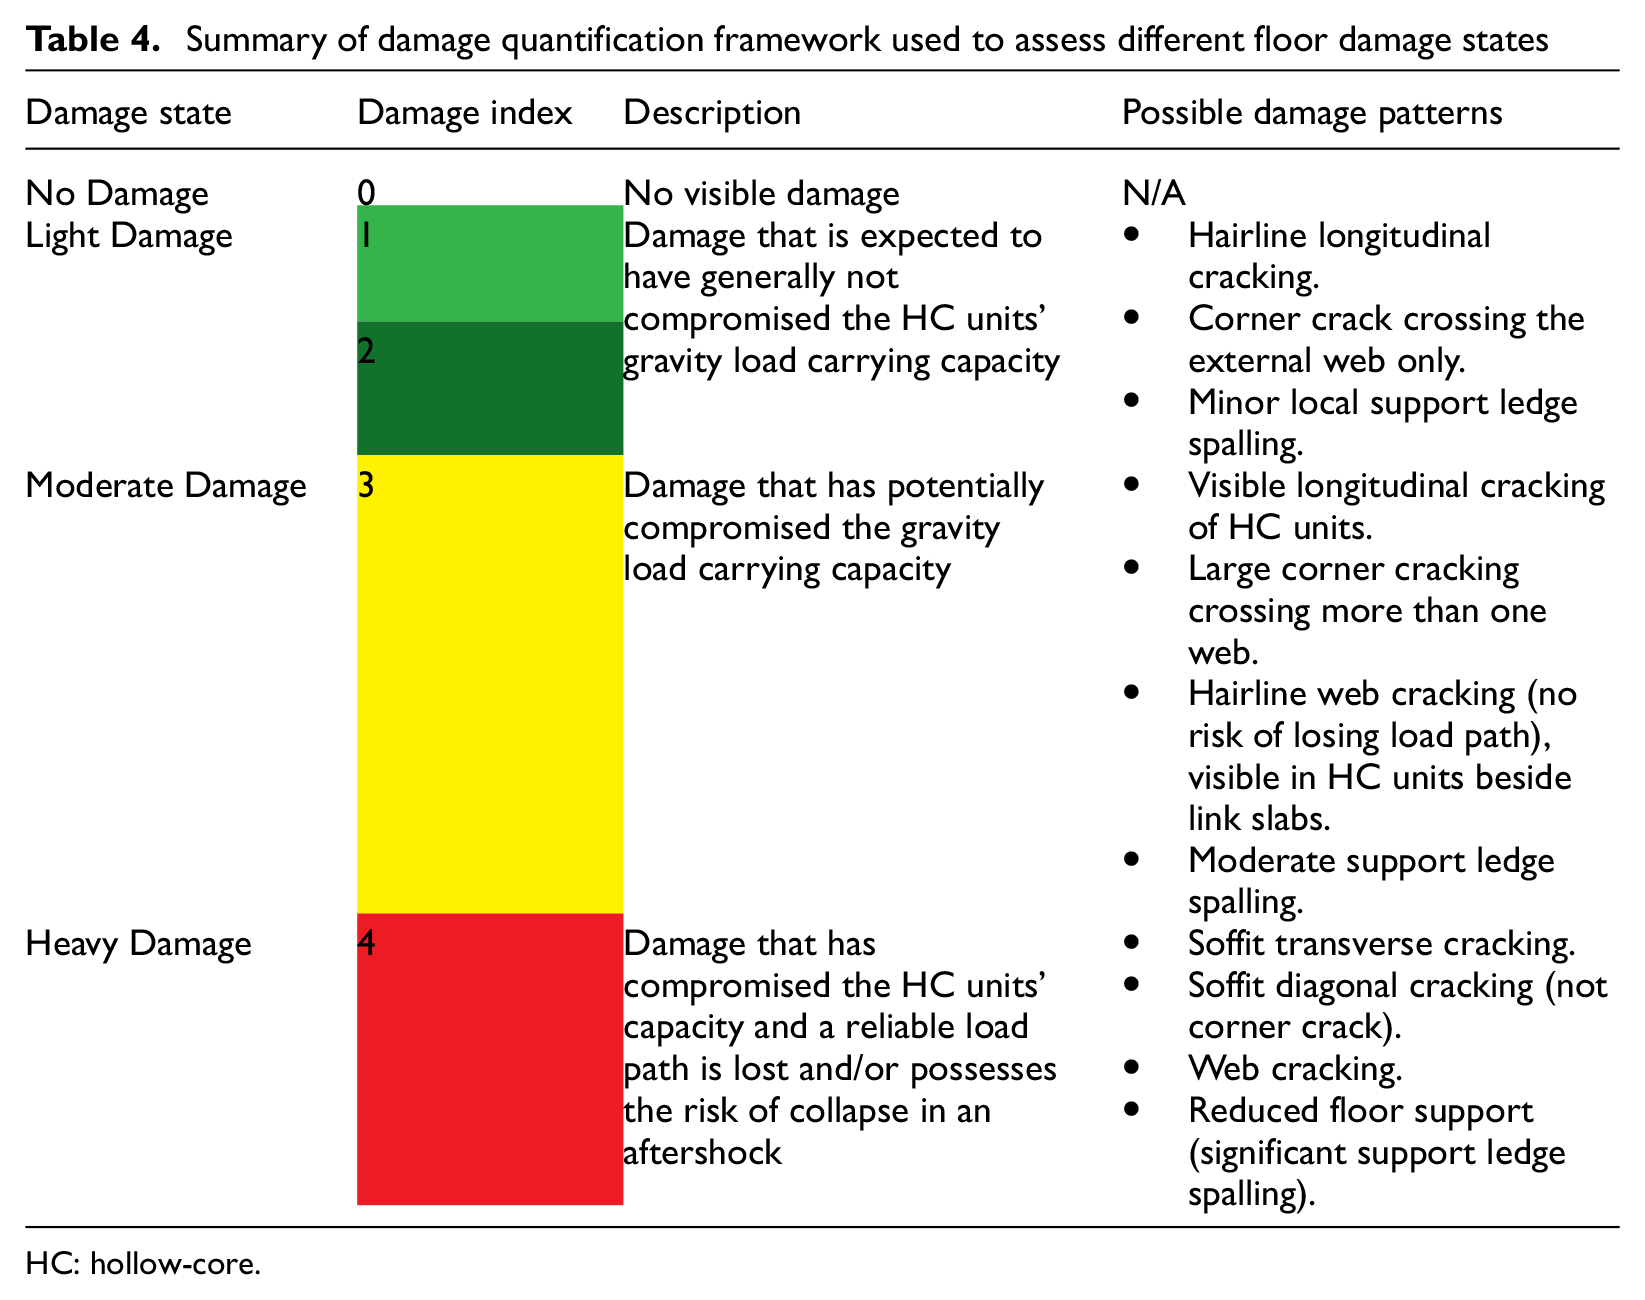
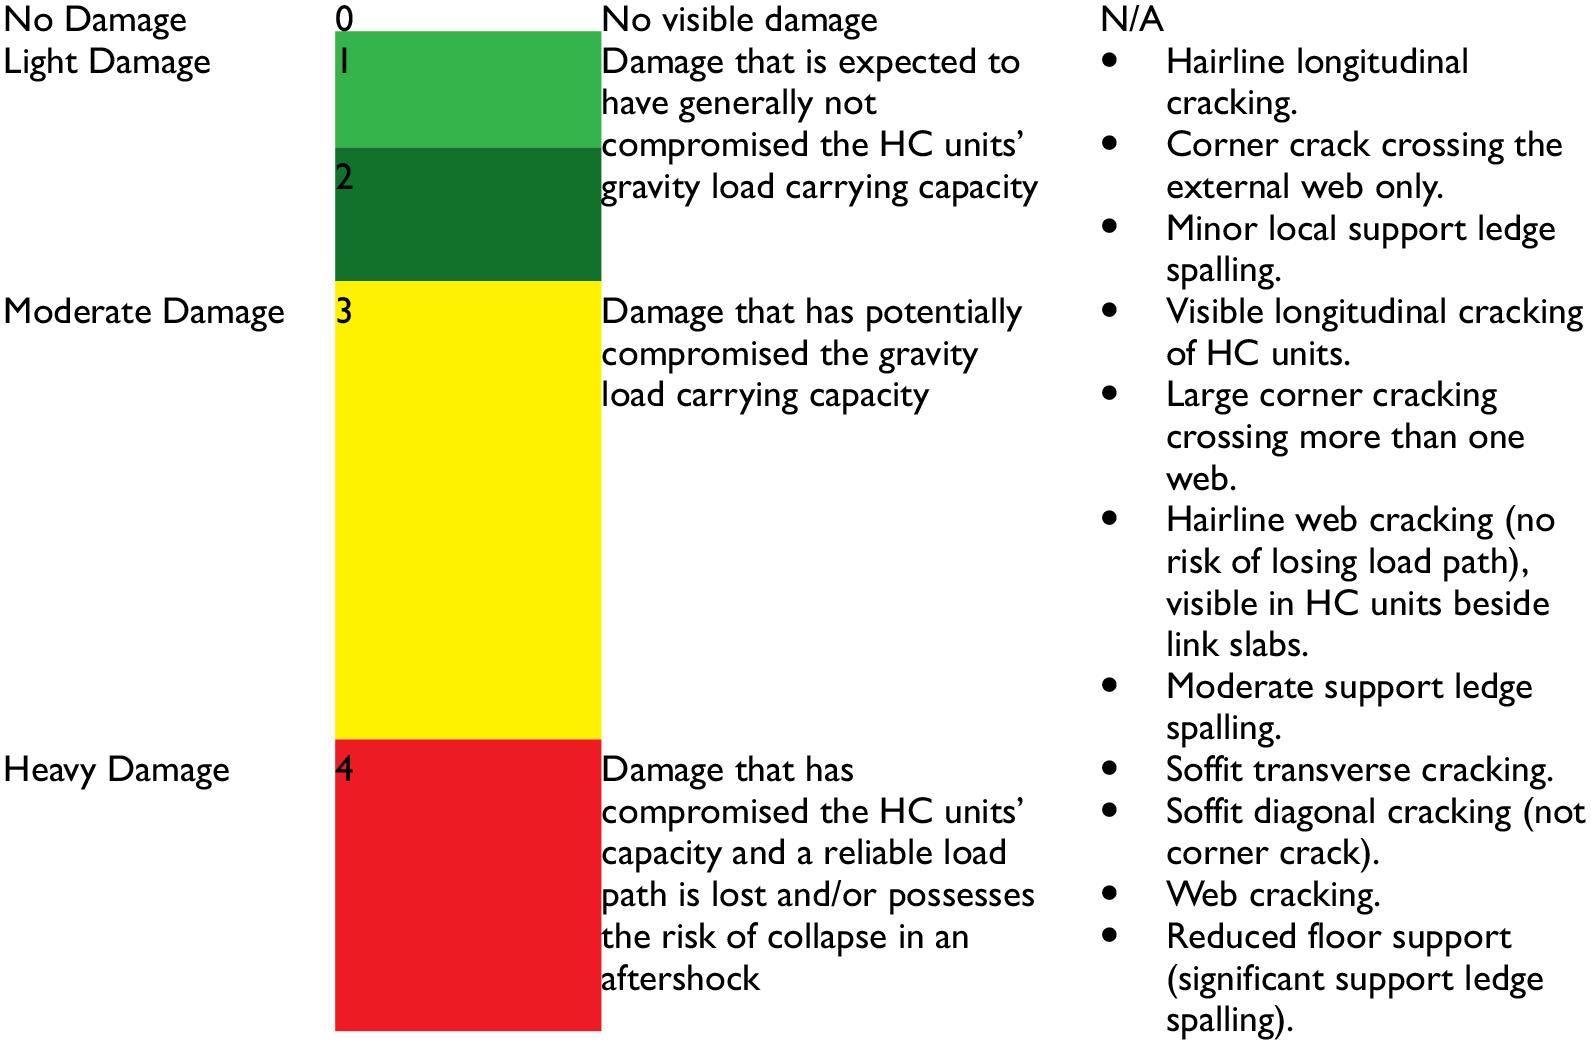
HC: hollow-core.
The inspection of HC floor units was only possible from the soffit. Hence the categorizations of the damage sustained in the HC floor units primarily relied on the inspection of the floor unit’s soffit. A degree of engineering judgment was involved in interpreting the significance of different damage states. Therefore, some potential variance in evaluations may occur. However, the interpretation of damage severity was based on available research information on the seismic performance of these floors (Bull et al., 2009; Fenwick et al., 2010). According to the classification criterion defined herein, the damage severity for each supported end of the HC floor units was mapped for each floor. An example of this damage map is shown in Figure 26. Photographic records of each damage state for all floors investigated can be found in the data repository under “Damage Pictures—Beam–Column–Floor Photogrammetry.”
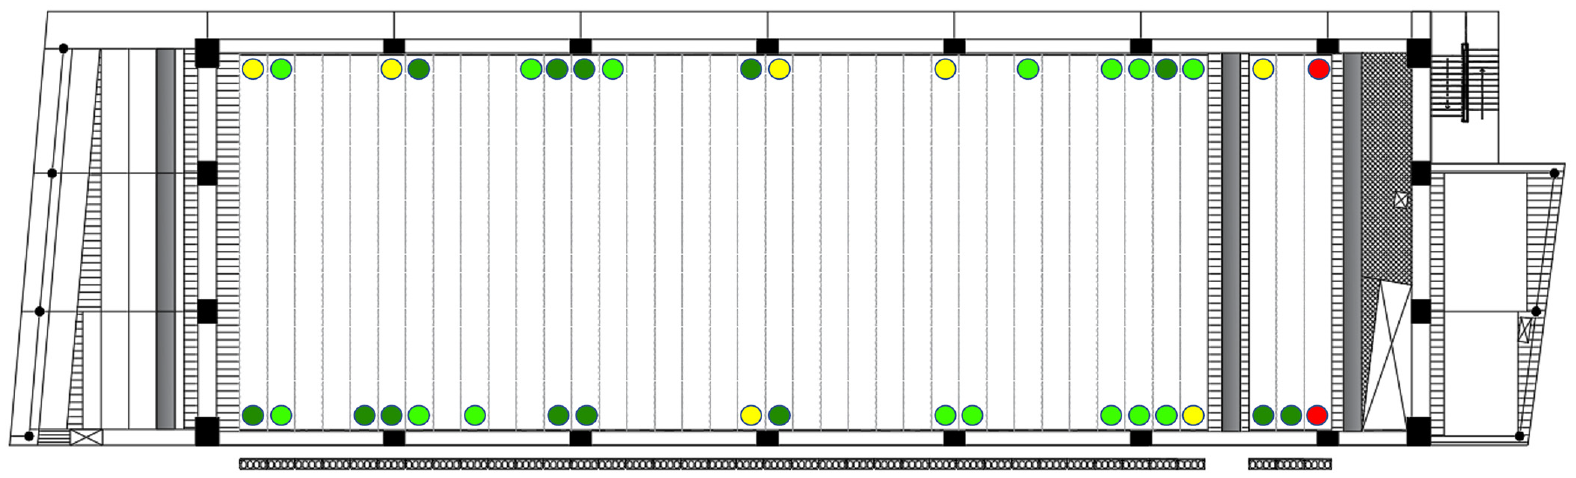
Floor damage distribution plot, Pier 3 Level 2.
It was noted that almost all the heavily damaged HC floor unit-ends were either fully or partially supported on a column, where the precast floor units were subjected to localized deformation to accommodate the deformation of the supporting seismic and gravity systems. A trend for the damage severity was recognized, as shown in Figure 27, where the closer the HC floor unit was to a column, the higher the degree of damage. These observations highlight the susceptibility of precast HC floor units to sustain a higher degree of damage when seated within the plastic hinge regions.
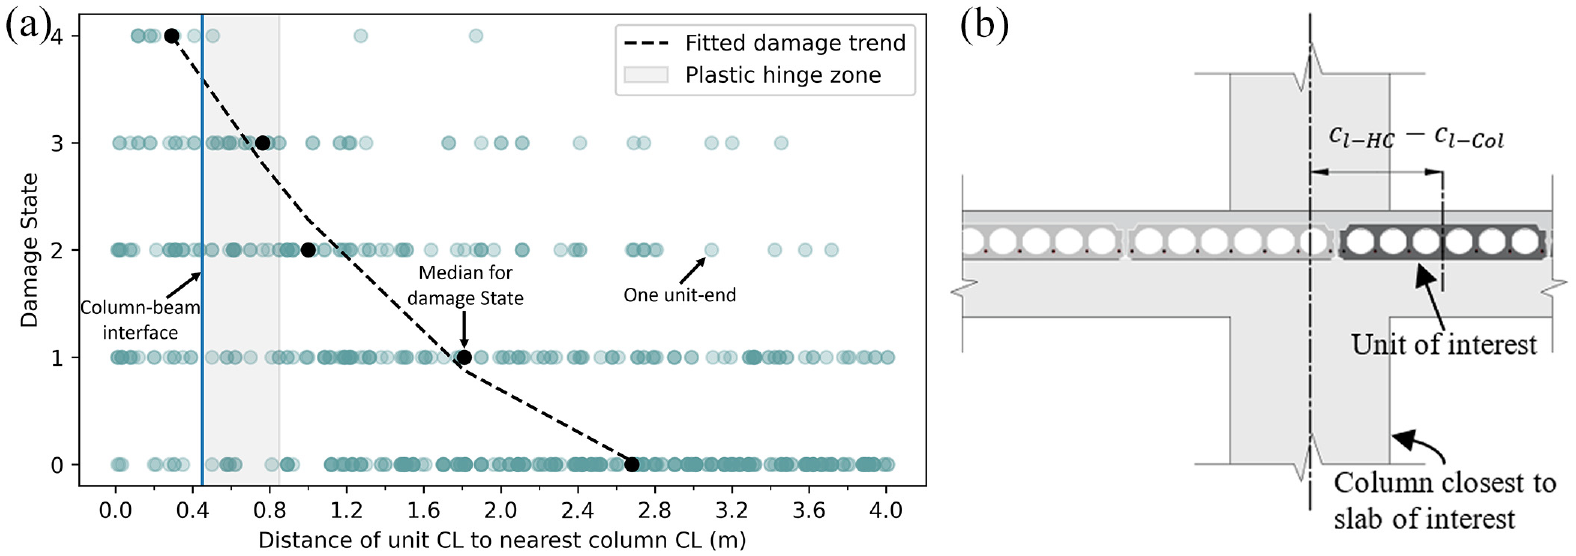
(a) The observed damage state of each supported end of the HC floor units relative to the floor units location (centerline of floor unit relative to the centerline of nearest column) showing a damage trend where the closer a floor unit is supported to a plastic hinge region the higher the degree of damage. The plastic hinge length was taken as half of the supporting beam depth (effective plastic hinge length ~0.5 beam depth). (b) illustrative schematic of the floor unit location used. (Note: HC floor units are typically about 1.2 m/47 in. wide.)
Dataset organization in repository
The dataset is archived in DesignSafe-CI (Rathje et al., 2017) under Project No. PRJ-3444. Using the DesignSafe data depot system, the dataset described herein is archived as a field research project with one mission (damage investigation). The data collected and curated were categorized in separate engineering collections (Figure 28).
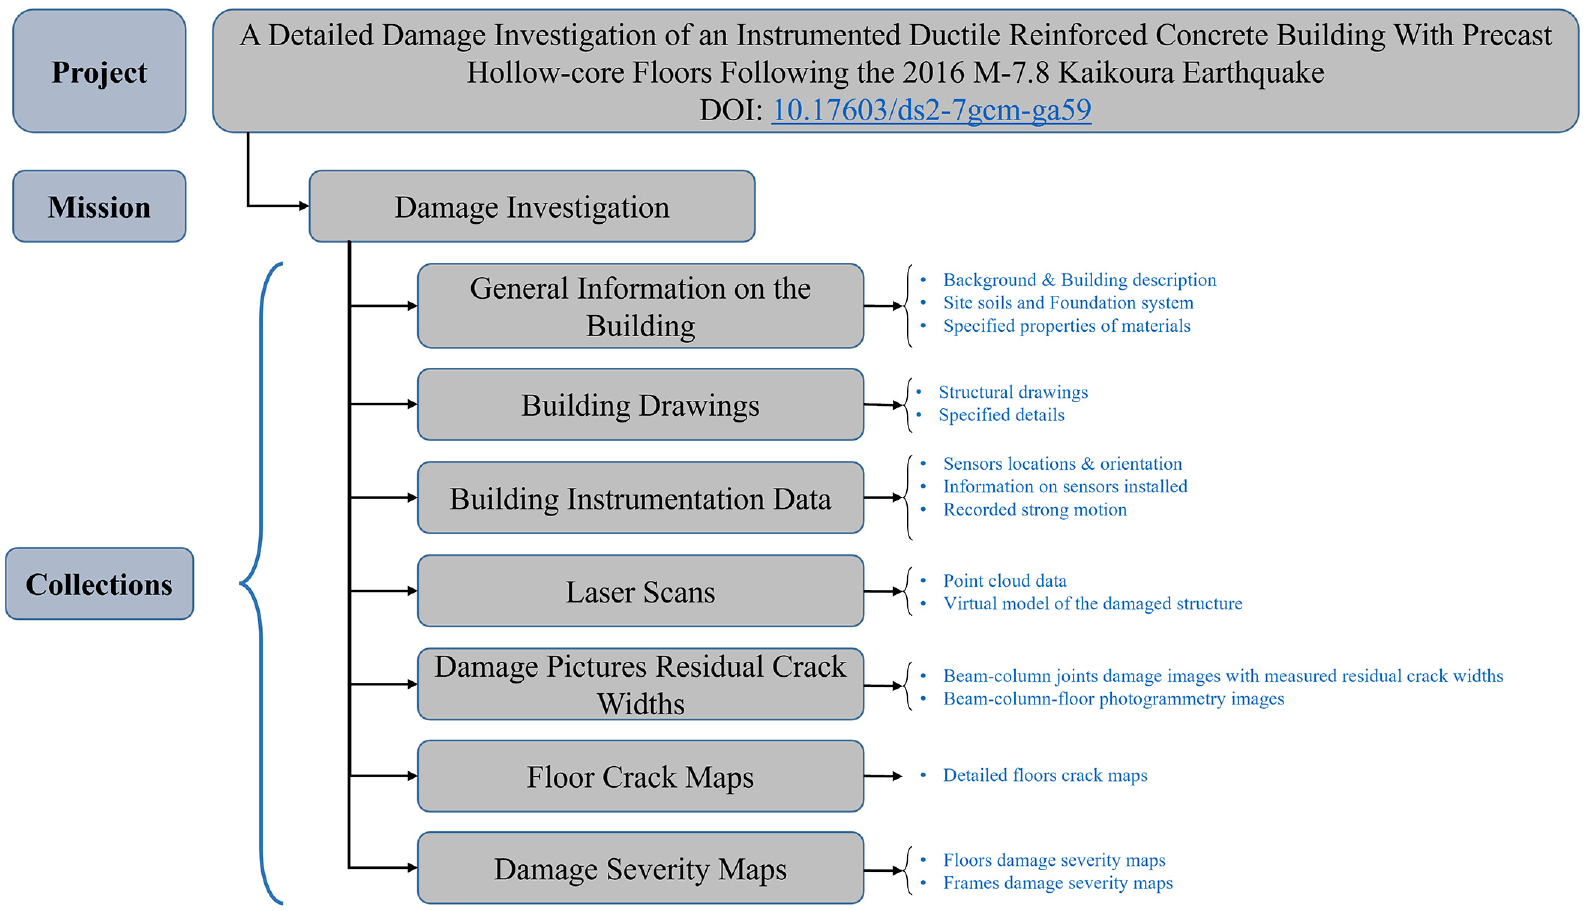
Dataset organization on DesignSafe-CI.
The content of each subcategory is briefly explained below.
General Information on the Building: Primary objectives of the damage investigation, description of the building and the site soils, and the specified properties of materials.
Building Drawings: PDF files of the structural drawings.
Building Instrumentation Data: This folder contains the processed data in .txt format. It includes the instruments’ corrected data to be oriented in the longitudinal and transverse directions of the building and filtered by the fourth-order bandpass Butterworth filter with the frequency range of 0.1–20 Hz.
Laser Scans: The point cloud processed (.e57) data are archived in this folder. The full building model is available, as well as separate floor models. A free viewer is also available to be able to view the virtual model of the building.
Damage Pictures Residual Crack Widths: Photographic record of the frames damage. One folder contains photogrammetry photos of the beam–column–floor joints. And the other folder contains images with measured residual crack widths of the beams.
Floor Crack Maps: PDF files named after the floor level in each pier, for example, “Pier3-Level2,” providing crack maps with overlays of damage observed and measured crack widths at the top and bottom of the floors scanned.
Damage Severity Maps: This folder contains schematic figures indicating the severity of damage observed in the precast floor units and the reinforced concrete frames. The damage severity assigned to each floor unit and beam-end followed a specific damage states matrix as discussed above.
Strengths and limitations
This data article presents one of the most in-depth damage investigations of an instrumented building subjected to a design-level earthquake. The dataset presented is considered one of the most complete datasets publicly available.
Despite the richness of the collected and generated data, few limitations exist. Access restrictions in a few locations in the building prohibited inspection of these locations. Floor displacements generated from the instruments rely on processing the acceleration data, and some data might be lost in the process. Moreover, two accelerometers (Sensors 9 and 15) had data quality issues and are not recommended to be used. Scans and some photos were taken after localized intrusive testing had taken place in different locations in the building. And finally, the accuracy of spatial information and measurements from the laser scans might include construction tolerance.
Summary and conclusion
Detailed damage documentation of an instrumented ductile reinforced concrete building with prestressed precast HC floor slabs subjected to a design-level earthquake was conducted. The building sustained widespread damage and was deemed to be demolished. The major damage observations were presented in this article, along with a description of the data collection methodology. Furthermore, a roadmap for navigating the dataset has been provided to support future use of the archived dataset.
The documentation and data recorded throughout the investigation included detailed crack maps of the floors correlating damage observed from the top and bottom of the floors, acceleration records from 14 strong-motion recording instruments throughout the building and 1 on-site (free-field) instrument recording local site response, 3D laser scans of the exposed damaged structural system, and high-resolution photos of beam–column and floor–column joints with measured residual crack widths.
The reinforced concrete frames damage observed predominately concentrated in beam plastic hinge zones, with damage ranging from minor cracking to concrete cover spalling and residual crack widths up to 4-mm. The precast HC floor units generally sustained widespread damage. The damage in the diaphragm (topping) was observed throughout the building. The topping damage primarily consisted of longitudinal cracks between adjacent floor units and some longitudinal cracking within the width of the units. These longitudinal cracks had residual widths ranging from 0.3 - 7 mm, with larger crack widths typically occurring between the units. In the areas adjacent to the columns, concentrated transverse and longitudinal cracking with crack widths ranging from hairline to 4-mm wide were observed.
Support ledge spalling at the columns and plastic hinge zones was also observed in multiple locations in the building. As for the HC floor units damage observed at the soffit, a significant proportion of the HC floor units in the building sustained some level of damage due to deformation incompatibilities between the HC floor units and the supporting frames under seismic demands. Heavy damage was primarily found in HC floor units seated either fully or partially on a column, where the precast floor units were subjected to localized deformations to accommodate the deformation of the supporting seismic and gravity systems.
The dataset presented serves as a benchmark for the seismic response of ductile reinforced concrete moment frame buildings with precast floors subjected to design-level seismic demands and enables researchers to validate system-level nonlinear numerical models. The damage data extracted from the building is useful to correlate expected structural performance with seismic demands and evaluate the efficacy of existing seismic design and assessment procedures. Furthermore, this dataset is valuable for future studies on the seismic response of moment frame structures subjected to bidirectional loading.
Footnotes
Acknowledgements
The authors gratefully acknowledge Dr Andrew Stolte, Nick Slavin, and Alejandra Bravo for their help in collecting the damage data and the Natural Hazards Engineering Research Infrastructure (NHERI) Rapid Facility, sponsored by the National Science Foundation (CMMI-1611820) for providing the BLK360 scanners.
Declaration of conflicting interests
The author(s) declared no potential conflicts of interest with respect to the research, authorship, and/or publication of this article.
Funding
The author(s) disclosed receipt of the following financial support for the research, authorship, and/or publication of this article: This investigation was supported by Building Research Association of New Zealand (BRANZ) under Grant No. LR13069. In addition, this project was partially supported by QuakeCoRE, a New Zealand Tertiary Education Commission-funded Centre.