
Abstract
Based on the slice theory and numerical calculation methods, the time varying meshing stiffness (TVMS) calculation method of the gear pair was constructed for the helical gear pair of a electric continuously variable transmission (ECVT), and the TVMS of the helical gear were calculated under different constant and time-varying torque in this study. The obtained stiffness values were introduced into the established dynamics model of helical gear system, and the influence of changed TVMS, resulting from the variable speed and torque, on the nonlinear dynamic characteristics of gear pair was analyzed using the Runge-Kutta method. The results show that the proposed TVMS calculation method is very effective in computing the TVMS of helical gear pair under time-varying condition. The TVMS and dynamic transmission error (DTE) increase as the torque increase, and vice versa. Meanwhile, the system exhibits a diverse range of periodic, sub-harmonic, and chaotic behaviors at high speed and at low speed when torque is low, whereas not appear at steady high torque under low speed range. This study offers a method for gaining the TVMS of helical gear pair to analyze the dynamic characteristics of gear pair under actual working condition, and the influence of torque that change with the speed ratio on the dynamic performance of a gear system should be considered in the industrial applications.
Keywords
Highlights
An improved method for evaluating the time-varying mesh stiffness (TVMS) of helical gear pair under time-varying conditions is proposed.
Effects of torque on the TVMS are investigated under constant torque and time-varying torque.
Effects of torque and rotational speed on nonlinear dynamic characteristics of helical gear pair are investigated.
Introduction
Owing to global warming caused by carbon dioxide and shortage of fossil fuel energy, the policies on fuel economy and pollutant emissions for automobiles have become strict.1,2 Thus, new energy vehicles, such as hybrid electric vehicles (HEV) and battery electric vehicles (BEV), are being developed as an effective solution by manufacturers all over the world.3–5 The transmission system is a core unit of automobile, and it plays a critical role in the driving performance of automobile. 6 And the electric continuously variable transmission (ECVT) as a special transmission system, which can make an motor to run more optimally by changing the speed ratio of the transmission system, is often accepted in new energy vehicles as it enables. 7 However, ECVT not only offers the potential to substantially improve the efficiency of motors by actively changing the speed ratio, but also can change the torque and rotational speed of the helical gear pair as shown in Figure 1. The torque can affect the dynamic characteristics of gears,8,9 which make the vibration and noise of gear pairs more prominent and cause a distress to drivers and a reduction in reliability to transmission.10,11 Therefore, it is great significance to study the dynamics and vibration characteristics of helical gear pair under time-varying condition for determining the NVH (noise, vibration, and harshness) performance of automobiles with an ECVT.

The transmission system of ECVT.
The time varying meshing stiffness (TVMS) being the main vibration source of gear transmission system, 12 can be affected by the torque. Therefore, A. Fernandez del Rincon et al. 13 studied how transmitted torque and loading sharing ratio affect the meshing stiffness. Lin et al. 14 analyzed the effects of undercut width, modification parameters and torque on the coincidence degree and meshing stiffness of herringbone gear pair. Zhou 15 researched the influence of different torque on the mesh. Furthermore, the torque can influence the performance of the gear transmission. Thus, Mbarek et al. 16 analyzed the modal of planetary gear under variable loading conditions based on an experimental. Tristan M. Ericson and Parker 9 studied the effect of mean operating torque on parameters and dynamic responses of the spur planetary gear system with an experiments. Guangjian et al. 17 has placed significant emphasis on the dynamic transmission error (DTE) of a gear pair considering varying load and eccentricities. In conclusion, the torque has effect on both TVMS and dynamic performance of helical gear pair system, and numerous researchers have paid attention to the relationship between the load and gear system. For example, Parker et al. 18 analyzed the performance of gear pair under wide operating torque and speeds range. Li 19 researched how the torque affect the resulting LTE, contact ratio and meshing stiffness.
Nevertheless, the torque, which can affect the TVMS and dynamic characteristics of helical gear pair, is time-varying under actual working condition. In order to improve the NVH performance of a ECVT, this paper focuses on the numerical calculation method of TVMS of the helical gear pair and the effects of the rotational speed and torque on the TVMS under constant and time varying cases. Meanwhile, the nonlinear dynamic characteristics of the helical gear pair system are analyzed under these circumstances. This calculation method of TVMS should be particularly useful when researching the characteristics of the gear pair under actually working condition when torque and rotation speed are time varying. And the dynamic performance analysis should be also important both for understanding the effect of torque on gear transmission and optimizing the speed ratio of ECVT to improve the economy and reduce vibration and noise of transmission assembly.
Calculation and analysis of TVMS of helical gear pair under different torque
The TVMS could varies with the input torque and rotational speed.14,15 And the TVMS can affect the dynamic characteristic of the gear system, such as the DTE.20,21 Thus, this section calculates and analyzes the TVMS of the gear system under different torques, such as constant, uniformly drop and raise of torque.
The numerical computation method of TVMS
The TVMS analysis of the gear pair has been studied by others through different research methods, such as the finite element analysis (FEA), numerical computation method, IMS and TMS methods.22,23 And the gear transmission system in ECVT is helical gear whose calculation of TVMS is different from the spur gear system. 24 People often use the FEA method to evaluate the TVMS, but with low efficient. So, the analytical methods such as the potential energy method has faster computational efficiency than FEA method and accurate results in calculating gear mesh stiffness are usually used. 25 While, there are less studies on calculation TVMS with analytical methods under continuous time varying condition. Hence, this article puts forward an improved efficient computing method of TVMS of helical gear pair under actual working condition based on the slice theory and numerical calculation method of spur gear TVMS.
Figure 2 is the meshing condition of helical gear pair, the blue rectangle is the plane of action and the gray shaded area is the action zone. Li refers to each length of contact line, i stands for the contact line. B is the face width, and βb denotes the helix angle. The green part is the sliced tooth, and the illustration of engaging out is shown in Figure 3.

The meshing condition of helical gear pair (The red lines are the contact lines which are at an angle to the axis of the cylinder, and the pink silk lines which are parallel to axis of the cylinder are the contact lines of the spur gear.).
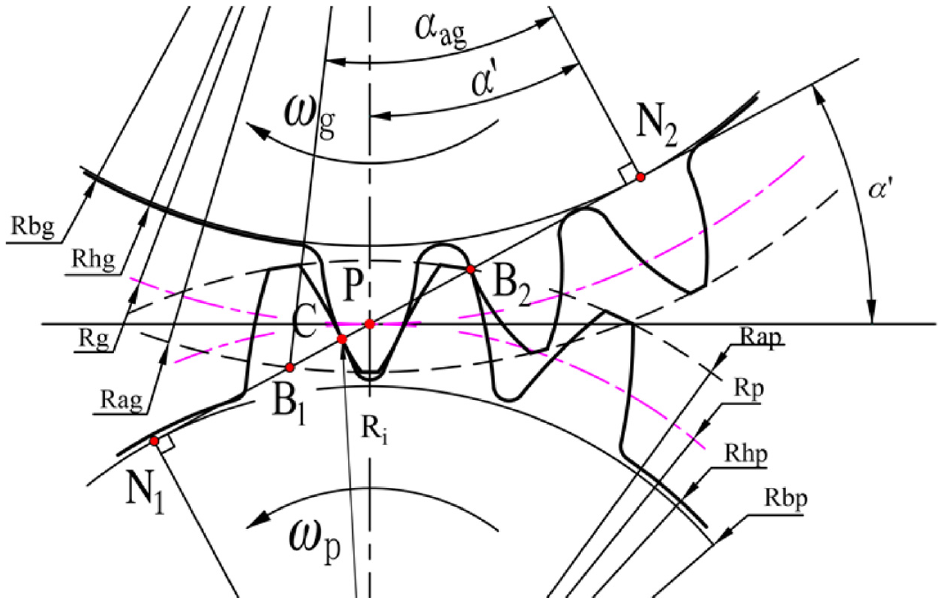
Illustration of spur tooth meshing out on front face.
In Figure 3, Ri is the distance between the meshing point and the center of the pinion. Raj, Rbj, Rhj, and Rj denote the addendum, base, dedendum, and pitch circle radii of the gear (j = p:pinion, j = g:gear), respectively. N1N2 and B1B2 are the theoretical and the actual lines of action, respectively, 26 and N1N2 can be obtained by formula (1).

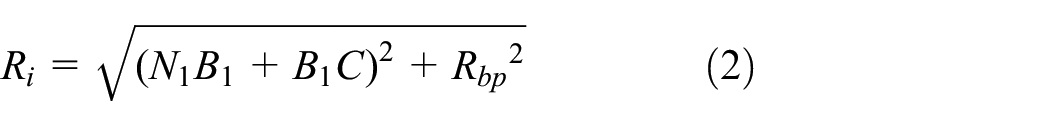
From Figure 3, Ri can be obtained by equation (2):
Where C is the mesh point at this moment. As the contact ratio εγ > 1, more than one meshing processes occur simultaneously. For instance, point B2 is meshing at the same time with C. Hence, CB2 = Pb. where Pb is the normal pitch. The number of meshing points is related to the contact ratio εγ obtained by equation (3):

Where, εα refers to the transverse contact ratio and εβ indicates the axial contact ratio. From the relation between contact line and pitch, equation (4) is obtained:

By combining Figures 2 and 3, we can obtain equations (5)–(7):


Whenre, zp, zg, are the numbers of teeth; αap and αag denote the crown pressure angles; α’t indicates the working pressure angle; ωp represents the pinion rotation speed, and t refers to the time from engaging-in to this moment. Combing with the data in Table 1, the contact ratios are εα = 1.4552 and εβ = 1.6863.
Parameters of the gear pair.

By combining the meshing sketch as shown in Figure 4 with equations (4) and (10) can be obtained,


Meshing sketch of gear pair on the front face (N1N2 is the theoretical mesh line, α is tooth top meshing positon, h is mesh stop position; b, c, d, e, f, g are the demarchtion points of three-teeth meshinghand hour-teeth meshinghareah respectively.).
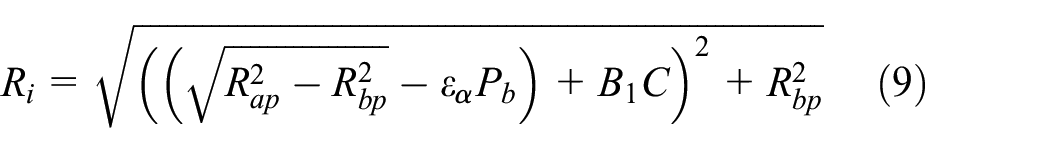
The radius of engagement of each meshing point can be obtained as equation (9):
According to Hu et al., 27 the variation in stiffness for the sliced tooth of gear at different loading positions can be approximated using the curve fitting technique, which can be shown in the following formulas:
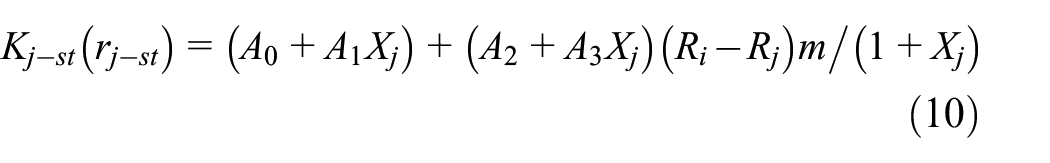
Where the unit is N/μm/mm, Kj-st(rj–st) represents the sliced tooth stiffness. And Ai (i = 0,1,2,3) refers to the coefficients, which can be expressed as:

Rpj denotes the pitch radius, Xj is the addendum modification coefficient, m indicates the module of the gears, and zj,(j = p, g) refers to the number of tooth for the pinion or gear. Ri is the contact radius of loading position, which are different on the same contact line of helical gear, but equal in the spur gear. Therefore, the contact radius of the pinion Rpi can be expressed as follows:


For the helical gear, the radiuses of engagement of each meshing point on the contact line are different. Thus, the stiffness of the tooth pair is not the product of the sliced tooth stiffness and tooth width B, but the integral of sliced tooth stiffness along the axial direction within the range of contact line. And the stiffness of the single tooth pair at some meshing position can be express as equation (14):
Figure 5 displays the schematic diagram of the gear meshing process. As the gear rotates, the number of teeth involved in the mesh varies. For instance, when the first tooth in Figure 5 engages in, the third one before this tooth remains in the state of engagement. Thus, four teeth are in mesh at the same time and going through the first course. After (ε-3)·2π/z degree rotation, the third one before this tooth meshes out, and no other tooth in mesh. Therefore, three tooth pairs are in meshing during the second course until the third course starts at 2π/z degree. After six courses, the first tooth is about to engaging-out in the seventh course, and the third tooth after this tooth is engaging in the same way. Thus, the first tooth pair experienced a seven-courses from engaging-in to engaging-out, which corresponds to the state of meshing shown in Figure 4. The main noise source is the gear pair mounted on the driven wheel and intermediate shafts. This study also selects this gear pair as the research object, 28 and the parameters of the gear pair are indicated in Table 1. By the Formula (3), the contact ratio is εγ = 3.1414.

Schematic diagram of the gear meshing process (The change of meshing lines of the first tooth from engaging-in to engaging-out).
Through the mesh process described previously and the schematic in Figure 4, the radius of engagement of the first tooth of the pinion can be described as equation (15):
Thus, the stiffness of the single tooth at each position expressed in equation (14) can be expressed as follows:

In equation (16),
By combining Figure 4 with Liu et al.’s study, 29 the distribution of contact line is shown in Figure 6. And the maximum contact line length for single tooth is expressed as follows:


The distribution of contact line.
Thus, the length of single-tooth contact line of pinion at some time can be evaluated as follows:

By considering the load coefficient and connecting the single-tooth stiffness constants in parallel as a spring, the stiffness of a single tooth pair can be evaluated as:
In this equation, rp and rg are the contact radius. Meanwhile, the load coefficient can be expressed as:

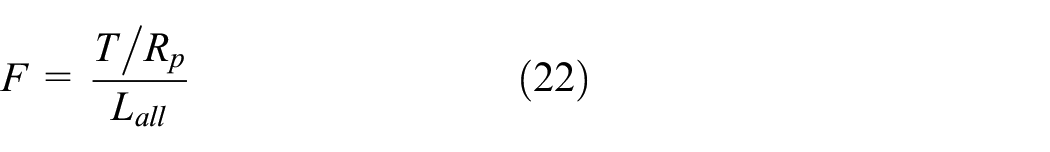
In equation (22), Lall represents the total length of contact lines at this moment and can be calculated as follow:

Lit represent the contact line length of each tooth at this position, where it refers to the serial number of each tooth. And n indicates the number of engaged teeth, which equals to 3 or 4 in this study. The length varies with the meshing point which is related to the rotation angle. At the same meshing point, both the lengths of the contact line on pinion and gear are the same. Combine with Figure 6, the contact line of pinion is shown in Figure 7. Thus, from equations (16), (19), and (20), the stiffness of the single tooth at each position can be converted into the following three situations:
1. When

2. When

3. When

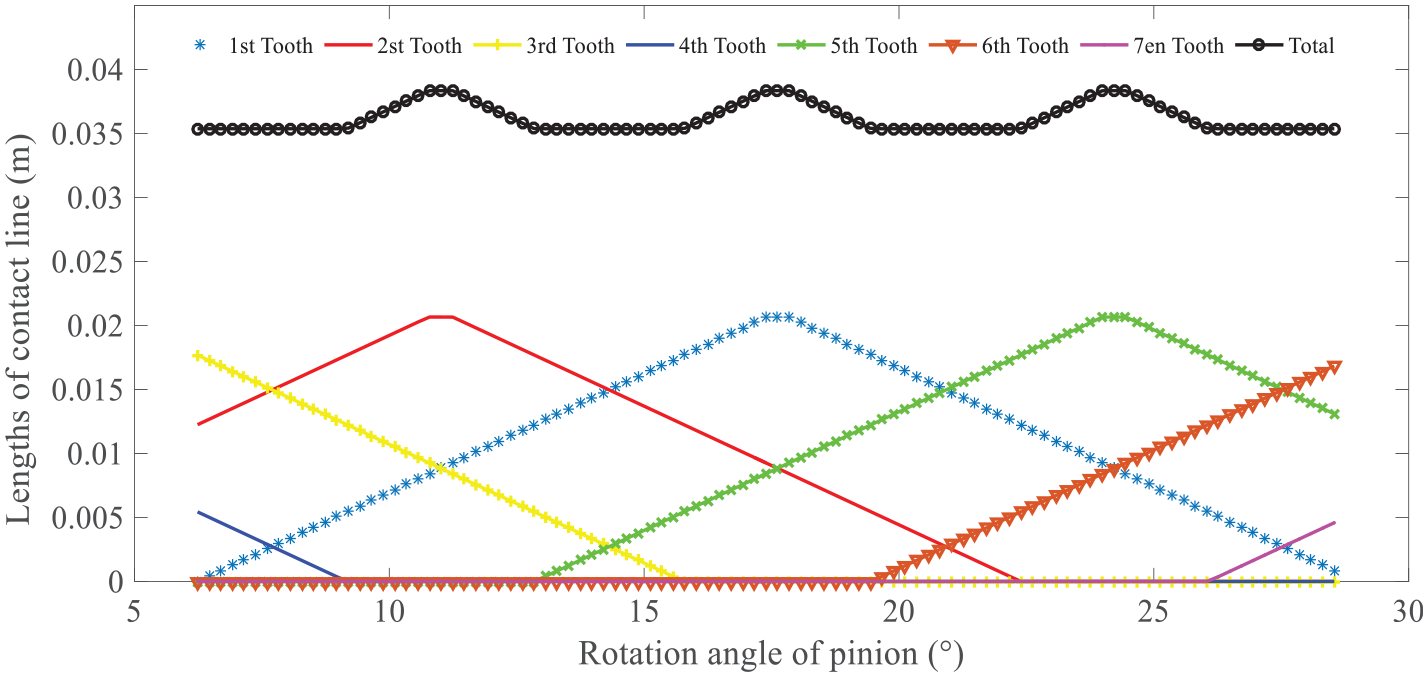
Time-varying length of contact line of pinion.
In all three cases, each tooth stiffness of the gear pair can be acquired through equation (16), and each contact line length Lit can be calculated through equation (19). The meshing stiffness of the gear pair can be acquired as:

In equation (27), λx (x = 1,2,…,npair) represents the loading sharing ratios of the gear pairs engage, C(λxF) denotes the corresponding load coefficients; and npair is the number of the tooth that mesh. And the flowchart for calculating the TVMS of helical gear pair as shown in Figure 8. With the previous equations, the TVMS of the gear pair and the single tooth pair under 190 Nm can be obtained as shown in Figure 9.

The flowchart for calculating the TVMS of helical gear pair.

The TVMS of the gear pair and tooth pair under 190 N/m.
The TVMS of the gear pair with the proposed method and the FEA method as shown in Figure 10, and the result with FEA is obtained from the literature. 33 The general trends in the two outcomes are somewhat similar, but there is still a gap. There are two peak points in each cycle, such as point A and point B in the numerical method or point A’ and point B’in the FEA method. While the intervals between two peak points are different. The reason is that the TVMS is connected with the contact lines and the contact force in the proposed method, and the TVMS obtained with FEA method is connected with the deformation of meshing teeth and the contact force. And the longest contact lines and the largest deformation of teeth occurs during the quadruple teeth-meshing area which is the most tooth pair engagement for the research object of this paper. However, the area of all four teeth are engaged simultaneously could get bigger because of the teeth deformation in FEA method. While the contact lines only connect with the geometrical parameter of the gear pair in the proposed numerical method. But, the overall value and trends of the TVMS are within the acceptable range. Especially it can obtain the TVMS under time-varying conditions by calculating the length of the contact lines in real time.

The comparison of the TVMS with the improved method and the FEA method.
Analysis of TVMS under different input torque
From above, the TVMS of the gear pair under different torques (including different constant and time-varying torques) are studied in this section to examine the effect of input torque on TVMS. Figure 11 shows the TVMS under different constant input torques (10, 70, 130, and 190 Nm, respectively). The simulation result shows that the TVMS under different input torques has the same tendency, which is similar to a sine curve, as three or four teeth mesh alternately; besides that, the TVMS increases with the increase of torque.

The TVMS of the gear pair with different constant input torque.
Figure 12 presents the TVMS under time-varying torques which change from 10 to 190 Nm, and from 190 to 10 Nm. In this graphic, the pink dotted oblique line is the input torque, which decreases as the angle of the pinion increases, and the green triangle line is the corresponding TVMS. Similarly, the red solid and the blue lines are the input torque and TVMS of the gear pair, respectively. A comparison of these two situations shows that the TVMS increases or decreases with the input torque. The trend of the TVMS remains approximately the same compared to the results under constant torque.

The TVMS of the gear pair with increase and decrease torque.
From the previous situations, the TVMS increases and decreases with the input torque, regardless of whether the input torque is a constant value or variable value. Therefore, Hu’s 27 numerical analytical method can be used on the TVMS calculation of helical gear pair after further improvement. And the optimized numerical analytical method can be used to obtain the TVMS under time-varying input torque and adopted to investigate the dynamic performances of the gear pair under actual time-varying working condition.
Nonlinear dynamic analysis of the helical gear pair under different torques
As shown in Figure 13, a six degrees-of-freedom (DOF) dynamic model of the gear pair is built for the purpose of investigating the dynamic performances of the gear pair. 33
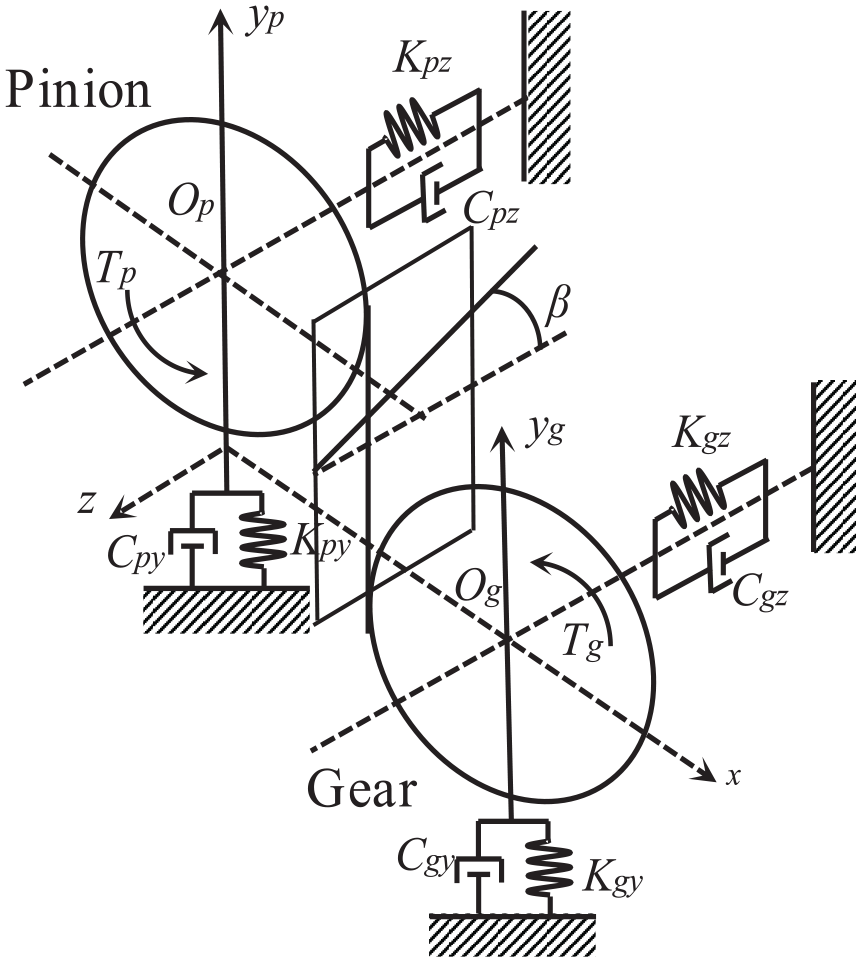
Dynamic model of the gear pair system.
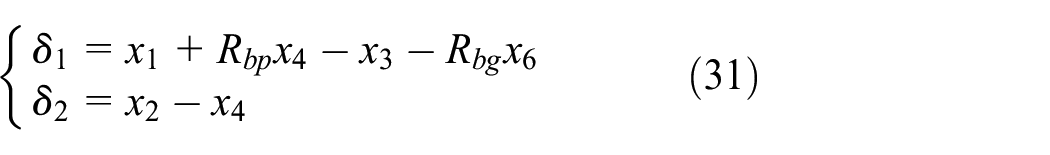
In Figure 13 Op and Og represent the rotation centers of the Pinon and Gear respectively. Rbp and Rbg indicate the base circle radii. The generalized co-ordinates vector of the nonlinear dynamic model, which contains six degrees-of-freedom, can be expressed as follow:

yp and zp are the displacements of the Pinion in the y and z directions. yg and zg represent those of the Gear. θp and θg respectively denote the rotation angles. The equations can be expressed in the following matrix form:

Where, mp and Ip are the mass and the rotational inertia of the Pinion. mg and Ig denote the mass and the rotational inertias of the Gear. Where, cpy and cgy are the axial damping coefficients. cpz and cgz refer to the vertical damping coefficients. kpy and kgy are the axial stiffness coefficients of the bearing housings. kpz and kgz denote the vertical stiffness coefficients of the bearing housings. Fn represents the meshing force. Tp is the drive torque on the Pinion. Tg indicates the output torque of the Gear. And linear displacement can be acquired by the equation (34).

DTE can be obtained as follows:
The normal transmission error δn can obtained by equation (37):

The dynamic mesh force considered backlash as follows, 33

In equation (38), km indicates the TVMS of the gear pair, which is acquired from the previous section. And e refers to the integrated TE. Then, introducing non-dimensional time τ = ωnt as follow:

Where
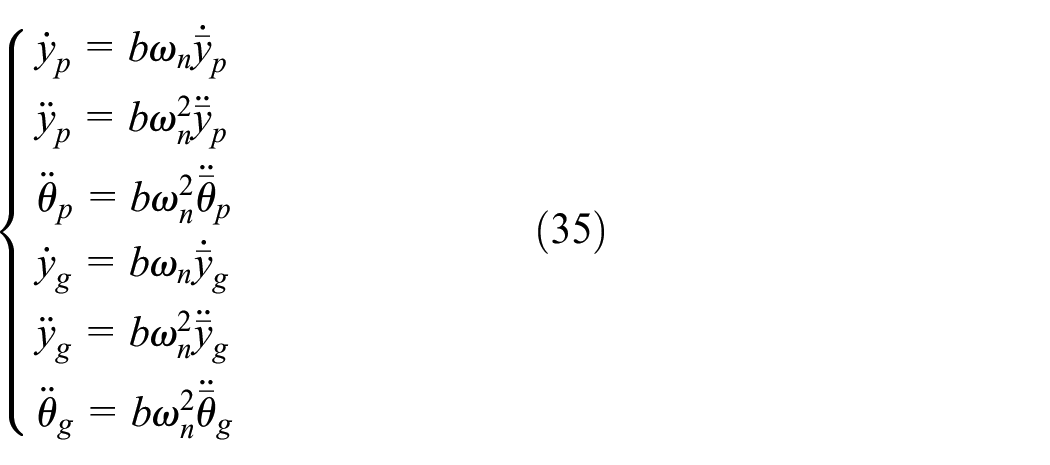
Therefore, the equations (36) can be acquired by deriving from equations (34) and (35):

The following equation is then obtained by equation (37):

The dynamic responses are as follows,

The approximate solution can be acquired through the fourth order Runge-Kutta method, q5 indicates the DTE of the gear pair. Then the nonlinear dynamics performance of the system under different torques can be acquired as follow.
Nonlinear dynamics under different constant torque
Figure 14 presents the bifurcation diagram of the gear pair with different constant input torques (10, 70, 130, and 190 Nm), whose abscissa is the rotation speed of the pinion, and the ordinate is the DTE. From these figures, the DTE increases with the input torque, and the gear pair exhibits a diverse range of chaotic behaviors and periodicity under different input torques. The corresponding phase diagrams and Poincaré maps are shown as follows.

Bifurcation diagram of the gear pair with different constant input torque: (a) 10 Nm, (b) 70 Nm, (c) 130 Nm, and (d) 190 Nm.
Phase diagrams and Poincaré maps under different rotation speeds when torque is 10 Nm
The bifurcation diagrams under 10 Nm show that the gear system exhibits synchronous 1T periodic motion at low rotational speed. The nT-periodic and chaotic motions have emerged as the rotational speed increase during the range of 2200–5600 rpm. However, as the rotation speed increases from 6496 rpm to 6653 rpm, the gear pair performs non-periodic motions. At high rotational speed, such as 11,060–16,000 rpm, the dynamic behaviors of the gear pair are found to be chaotic and nT–periodic motions, successively (Figure 15).

Phase diagrams and Poincaré maps under different rotation speeds when input torque is 10 Nm: (a) 2000 rpm, 1T periodic motion, (b) 2526 rpm, 2T periodic motion. (c) 3270 rpm, chaotic motion, (d) 3526 rpm, 4T periodic motion, (e) 4245 rpm, chaotic motion, (f) 5180 rpm, 5T periodic motion, (g) 6560 rpm, chaotic motion, (h) 8000 rpm, 1T periodic motion, (i) 11,500 rpm, chaotic motion, (j) 12,250 rpm, 3T periodic motion, (k) 13,000 rpm, chaotic motion, and (l) 15,700 rpm, 4T periodic motion.
Phase diagrams and Poincaré maps under different rotation speeds when the torque is 70 Nm
The bifurcation diagrams under 70 Nm show that the gear system exhibits synchronous 1T periodic motion at low rotational speed. The nT-periodic and chaotic motions emerge as the rotational speed increases during the range of 4026–4214 rpm. The gear pair system performs 1T periodic until 11,120 rpm. However, with the rotational speed increase, the dynamic behaviors of the gear pair system are found to be chaotic, quasi-periodic motion and nT-periodic motions. Then, the gear system bifurcates into 2T periodic motion after experiencing 1T periodic motion (Figure 16).

Phase diagrams and Poincaré maps under different rotation speed when input torque is 70 Nm: (a) 2526 rpm, 1T periodic motion, (b) 3526 rpm, 1T periodic motion, (c) 4100 rpm, 5T periodic motion, (d) 4150 rpm, chaotic motion, (e) 5965 rpm, 1T periodic motion, (f) 8920 rpm, 1T periodic motion, (g) 11,150 rpm, 7T periodic motion, (h) 12,370 rpm, 7T periodic motion, (i) 15,700 rpm, 1(t) periodic motion, and (j) 15,800 rpm, 2T periodic motion.
Phase diagrams and Poincaré maps under different rotation speeds when the torque is 130 Nm
The bifurcation diagrams under 130 Nm show that the gear system exhibits synchronous 1 T periodic motion until 11,250 rpm. This is different from 10 and 70 Nm, while the system undergo nT periodic motion and chaotic motion at low rotation speed from about 2000 to 8000 rpm. Then the dynamic behaviors of the gear pair system are found to be chaotic, quasi-periodic and nT-periodic motions at next high rotation speed range which is the same with 10 and 70 Nm (Figure 17).
Phase diagrams and Poincaré maps under different rotation speed when input torque is 130 Nm: (a) 2526 rpm, 1T periodic motion, (b) 3800 rpm, 1T periodic motion, (c) 3933 rpm, 1T periodic motion, (d) 6560 rpm, 1T periodic motion, (e) 9990 rpm, 1T periodic motion, (f) 11,800 rpm, quasi-periodic motion, (g) 12,530 rpm, 7T periodic motion, (h) 13,200 rpm, chaotic motion, (i) 14,000 rpm, chaotic motion, and (j) 15,500 rpm, 1T periodic motion.
Phase diagrams and Poincaré maps under different rotation speeds when the torque is 190 Nm
The bifurcation diagrams under 190 Nm show that the gear system exhibits synchronous 1T periodic motion until about 12,970 rpm. And quasi-periodic, nT-periodic and chaotic motions have successively emerged as the rotational speed increases over the range of 12,970–15,120 rpm. Then, as the rotation speed increases, the gear pair performs 1T periodic motion again (Figure 18).
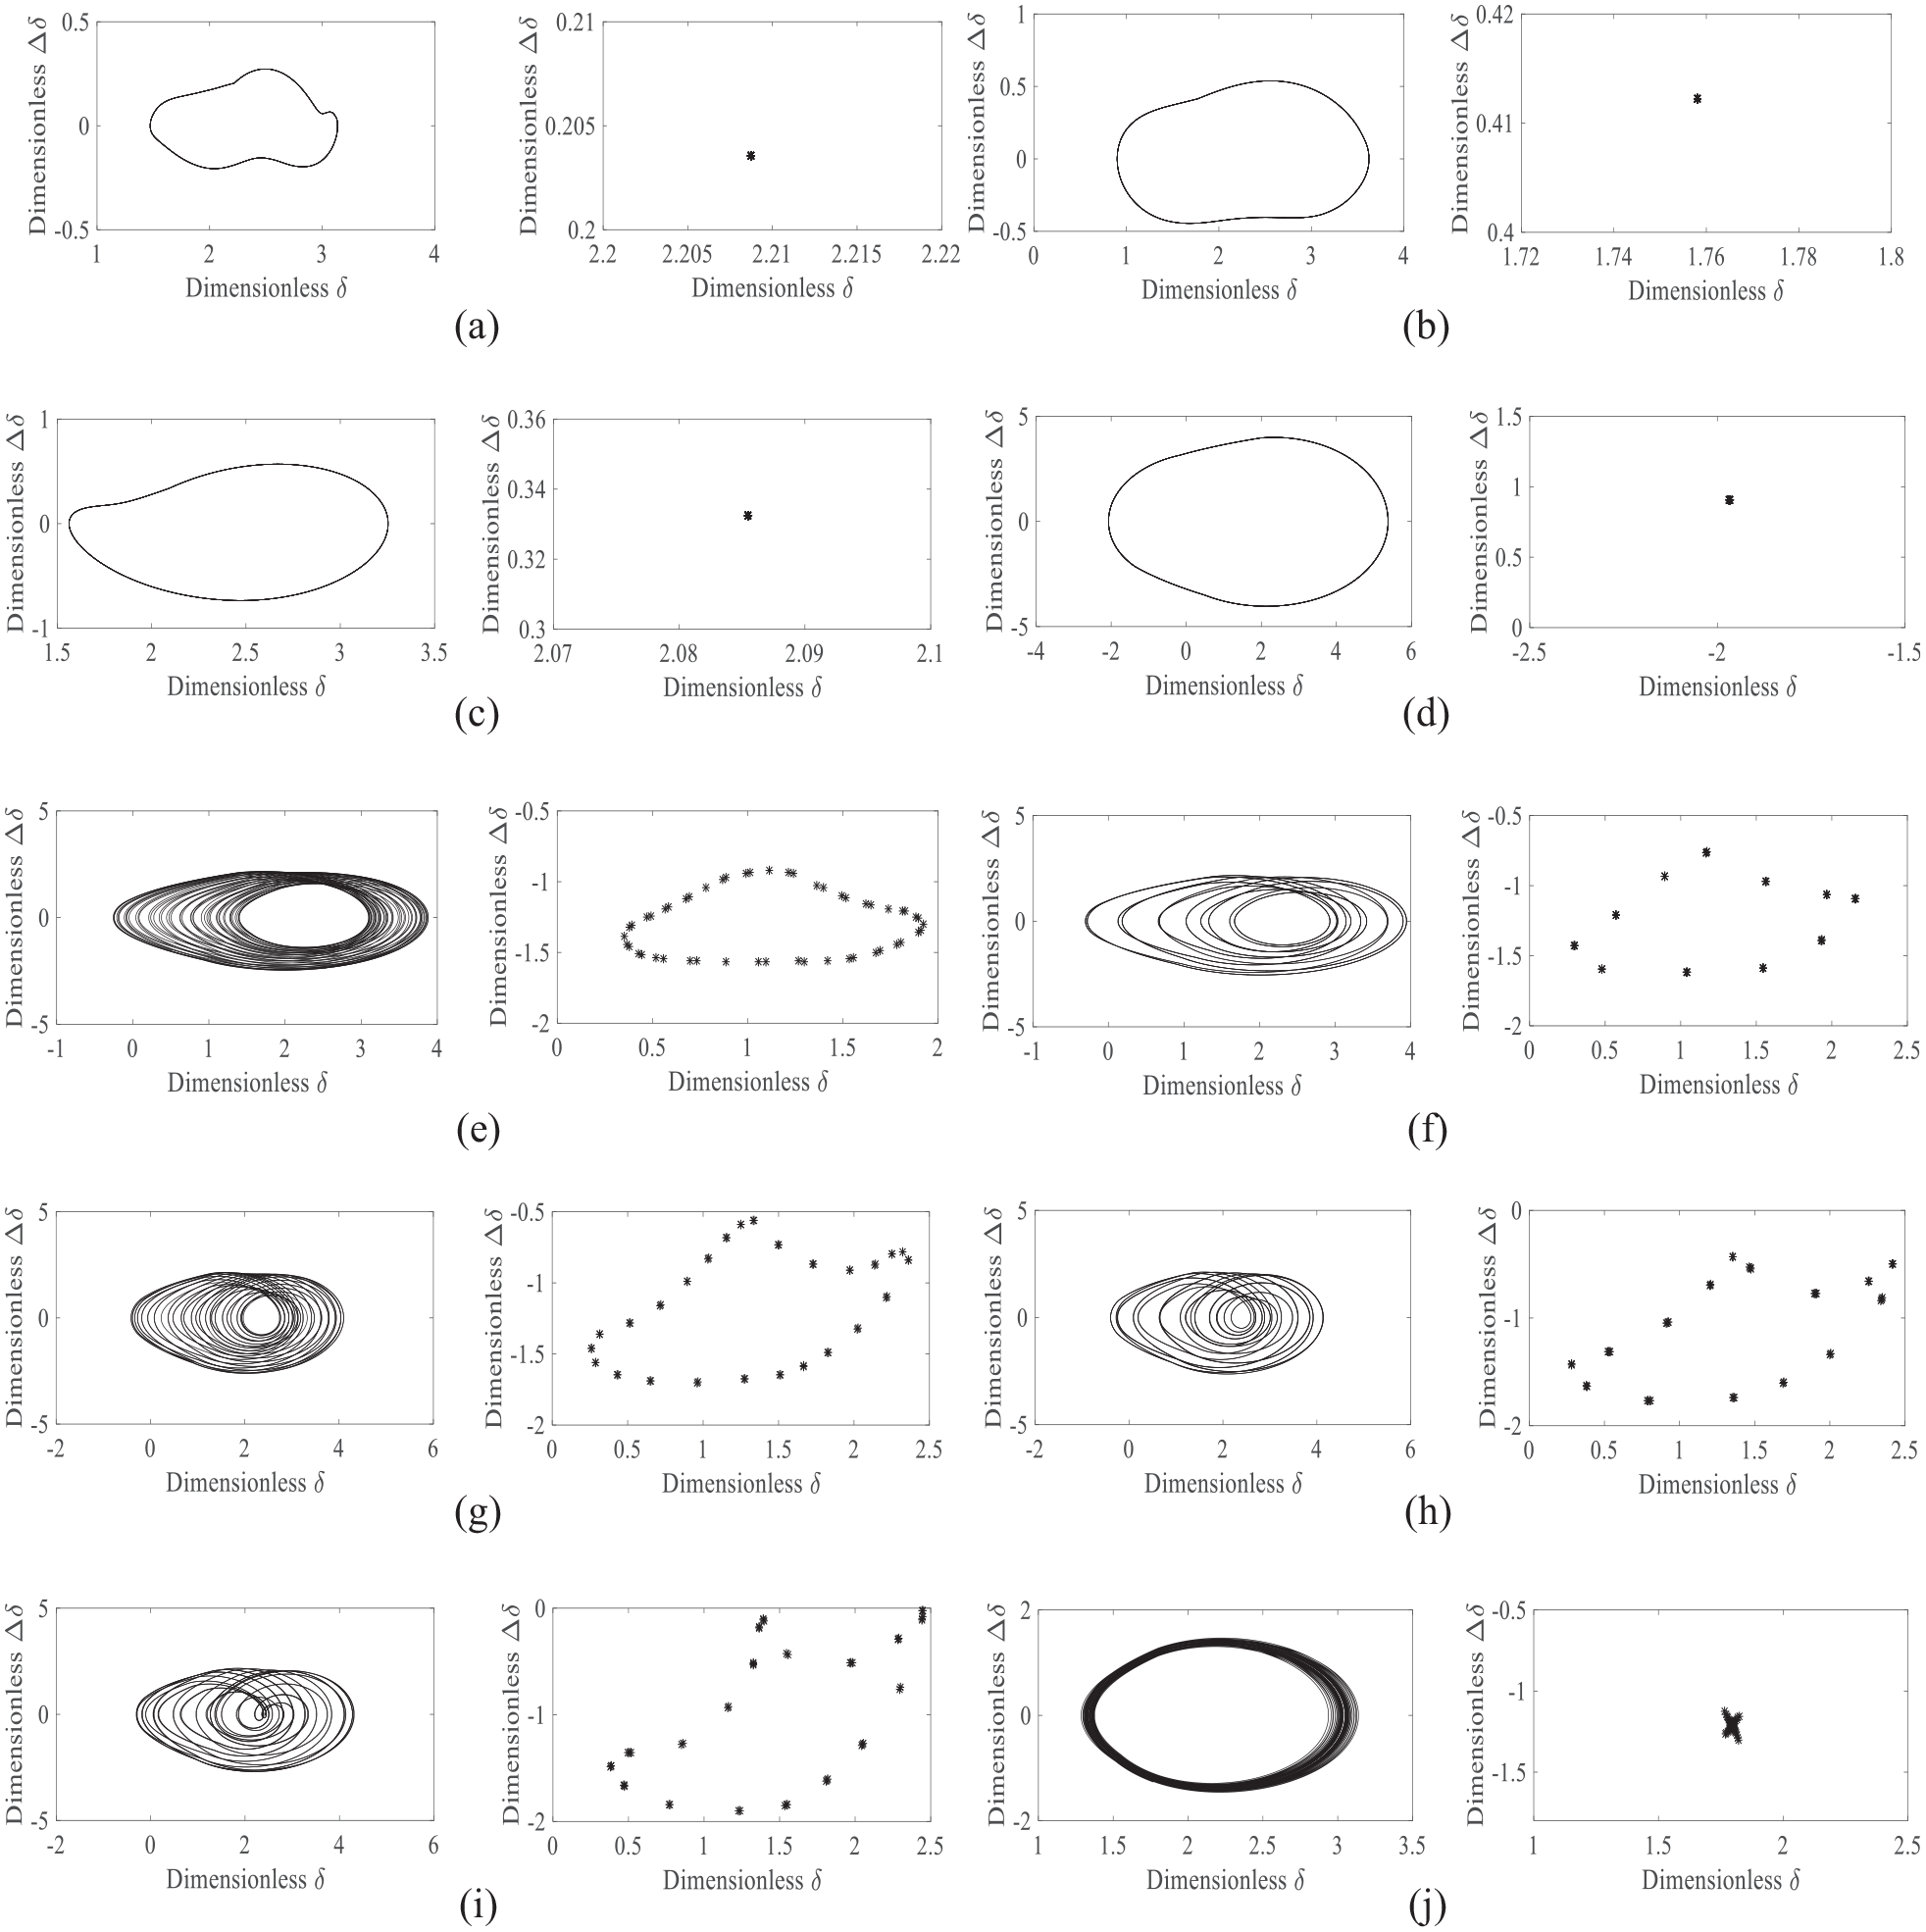
Phase diagrams and Poincaré maps under different rotation speeds when the input torque is 190 Nm: (a) 2526 rpm, 1T periodic motion, (b) 3800 rpm, 1T periodic motion, (c) 6560 rpm, 1T periodic motion, (d) 10,900 rpm, 1T periodic motion, (e) 13,250 rpm, quasi-periodic motion, (f) 13,530 rpm, 11T periodic motion, (g) 13,840 rpm, quasi-periodic motion, (h) 14,090 rpm, 15T periodic motion, (i) 14,500 rpm, 18T periodic motion, and (j) 15,500 rpm, 1T periodic motion.
Nonlinear dynamics under time-varying torque
Figure 19 are the bifurcation diagrams under time varying torque. The input torque is decreasing from 190 to 10 Nm or increasing from 10 to 190 Nm. From these figures, the trend of DET is gradually increased or decreased corresponding to the trend of torque. And the gear pair exhibits a diverse range of chaotic behaviors and periodic motions under both cases at high speeds, whether the input torque is high or low. And the motion is more complex and more chaotic intervals exist at the range of 190 to 10 Nm than those at the range of 10 to 190 Nm. While, the gear system exhibits synchronous n T periodic motion and chaotic motion at a low speed range under a time-varying torque from 10 to 190 Nm. This condition does not appear under a torque from 190 to 10 Nm. The corresponding phase diagrams and Poincaré maps are shown as follows.

Bifurcation diagram of the pinion with different variable torque: (a) from 190 to 10 Nm; (b) from 10 to 190 Nm.
Dynamic characteristic curves of the gear pair under 190 to 10 Nm
The bifurcation diagrams of the gear pair under 190 to 10 Nm show that the gear system exhibits synchronous 1T periodic motion until 11,200 rpm. The system then undergoes chaotic, n T periodic and chaotic motions at the rotation speed which range from 11,200 to 12,280 rpm. Then the system exhibits nT-periodic and chaotic motions. Finally, the system exhibits 1T periodic motion again. The corresponding phase diagrams and Poincaré maps at various rotational speed are presented in Figure 20(a) to (j).
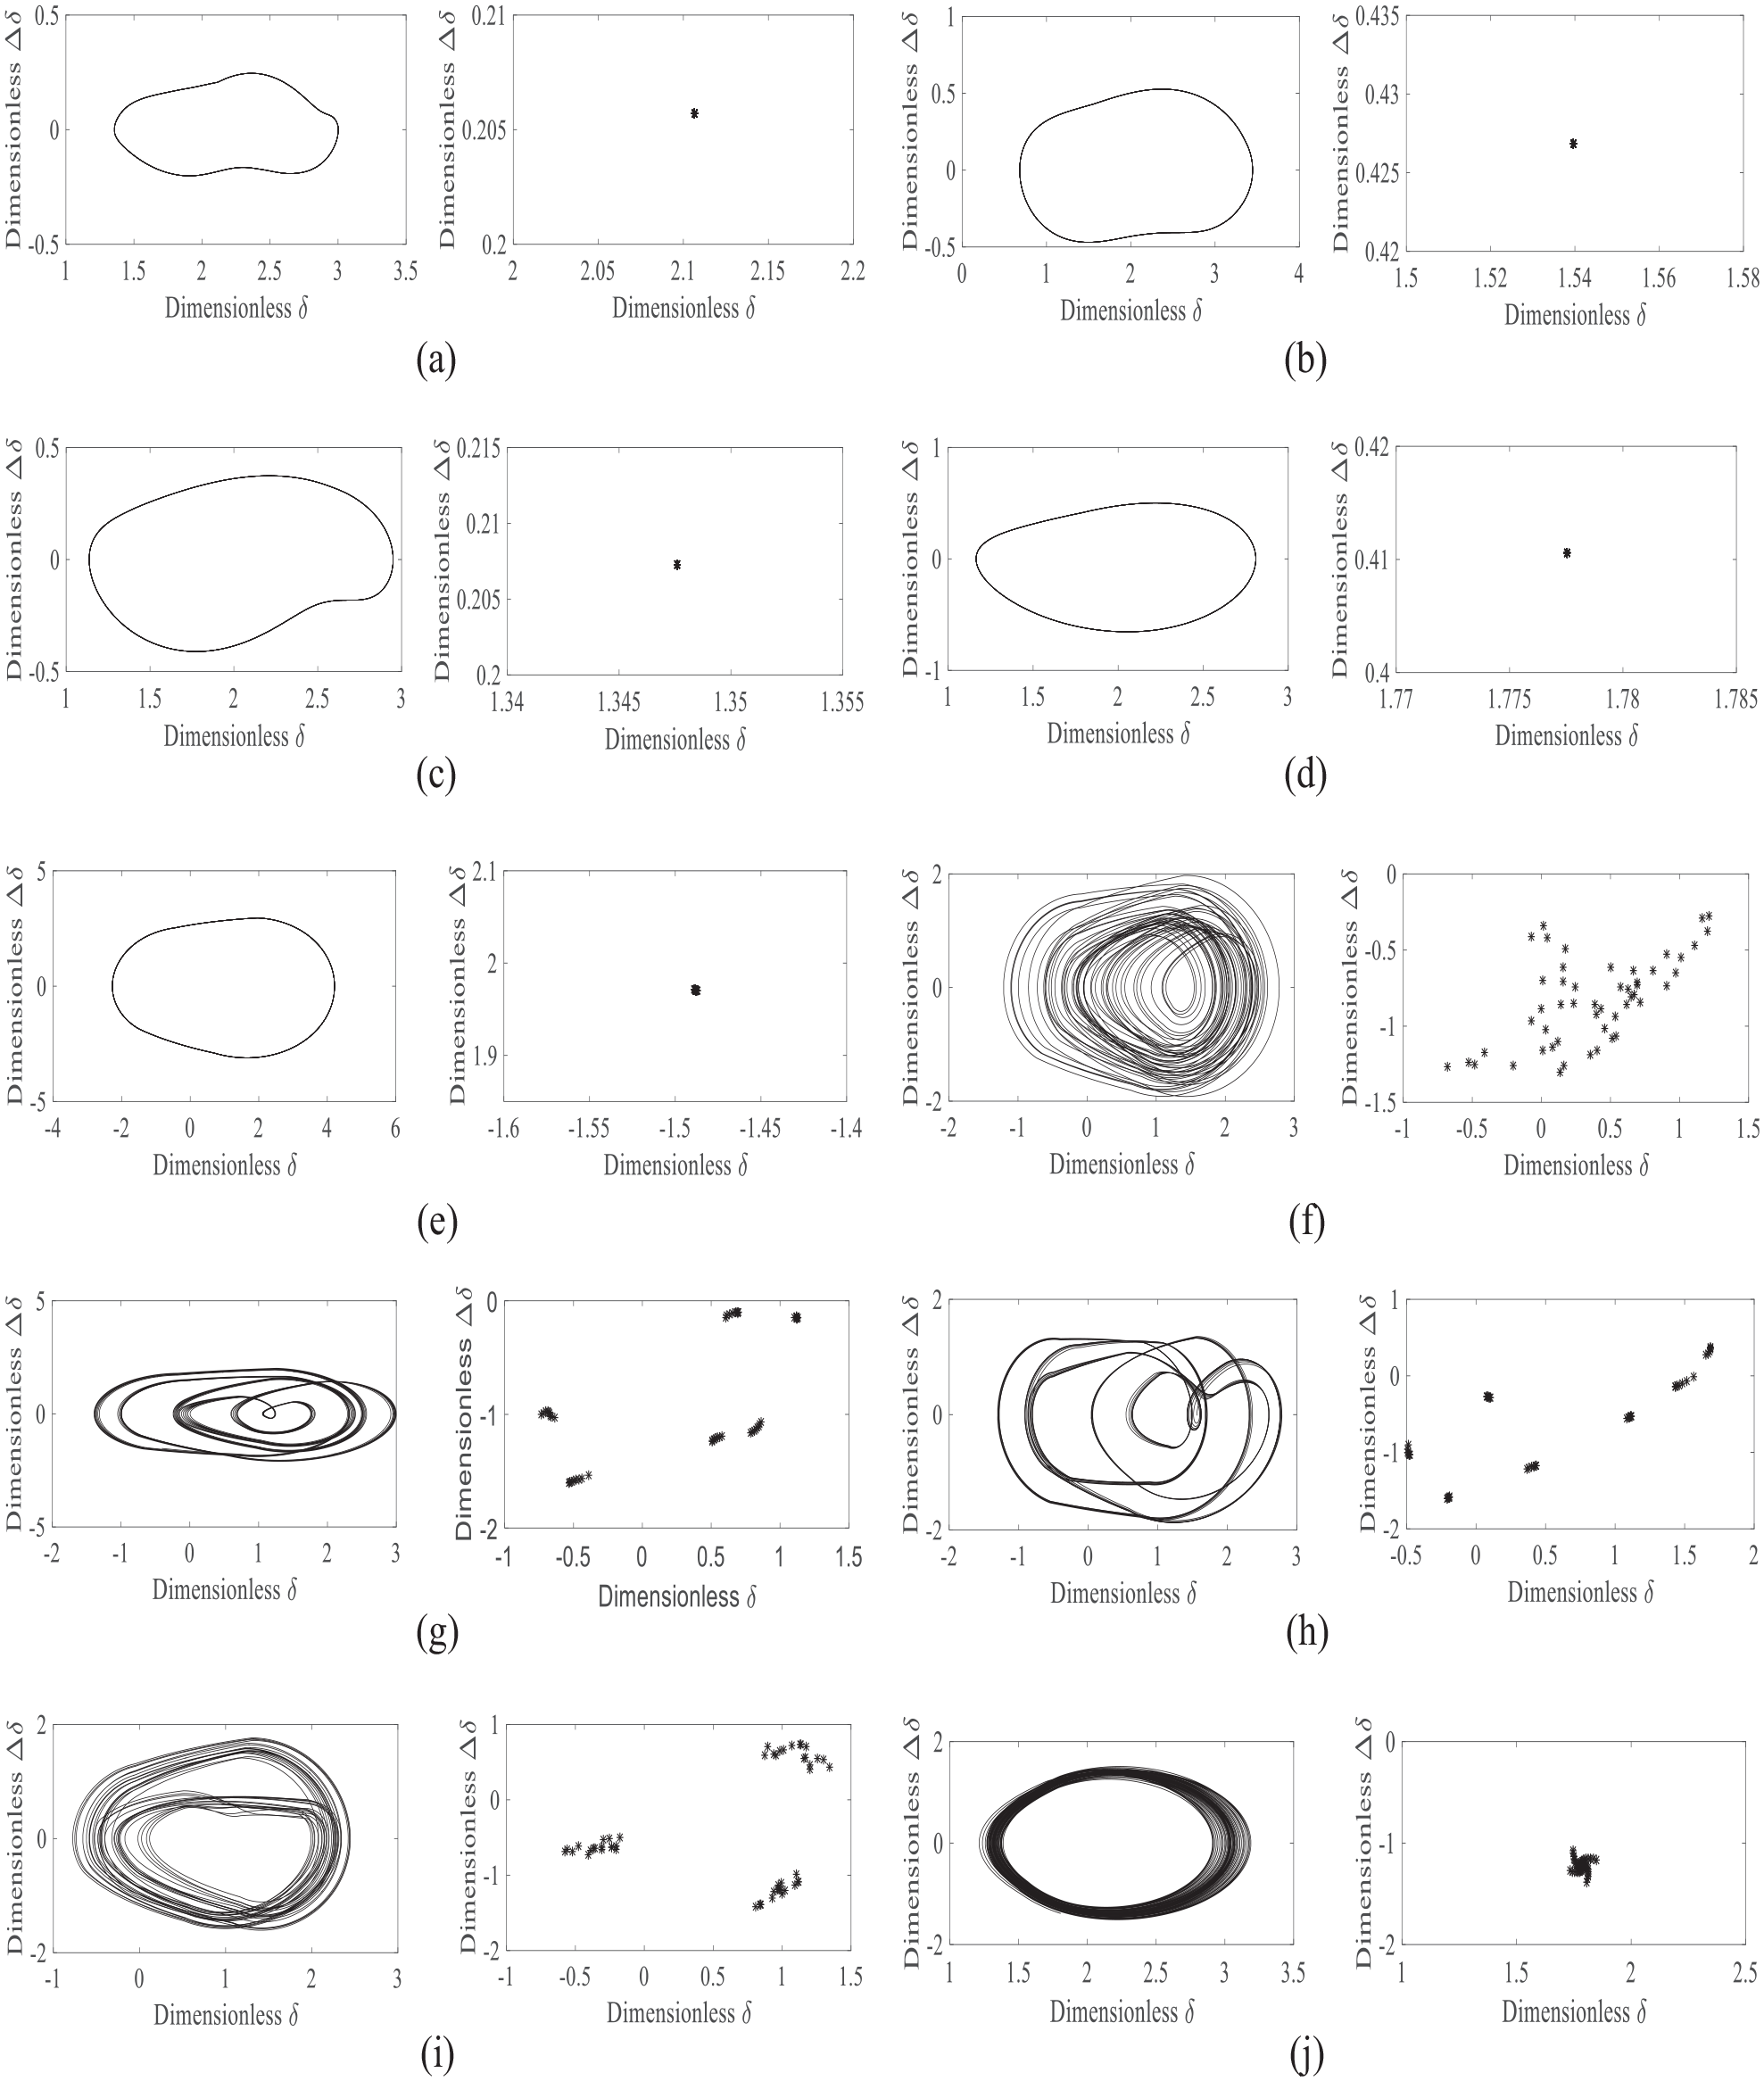
Dynamic characteristic curves of the gear pair under constant torque from 190 Nm to 10 Nm: (a) Phase diagram and Poincaré map under 2526 rpm, (b) Phase diagram and Poincaré map under 3808 rpm, (c) Phase diagram and Poincaré map under 4058 rpm, (d) Phase diagram and Poincaré map under 6560 rpm, (e) Phase diagram and Poincaré map under 9650 rpm, (f). Phase diagram and Poincaré map under 11,200 rpm, (g) Phase diagram and Poincaré map under 11,620 rpm, (h). Phase diagram and Poincaré map under 12,450 rpm, (i). Phase diagram and Poincaré map under 13,550 rpm, (j) Phase diagram and Poincaré map under 15,800 rpm.
Dynamic characteristic curves of the gear pair under 10–190 Nm
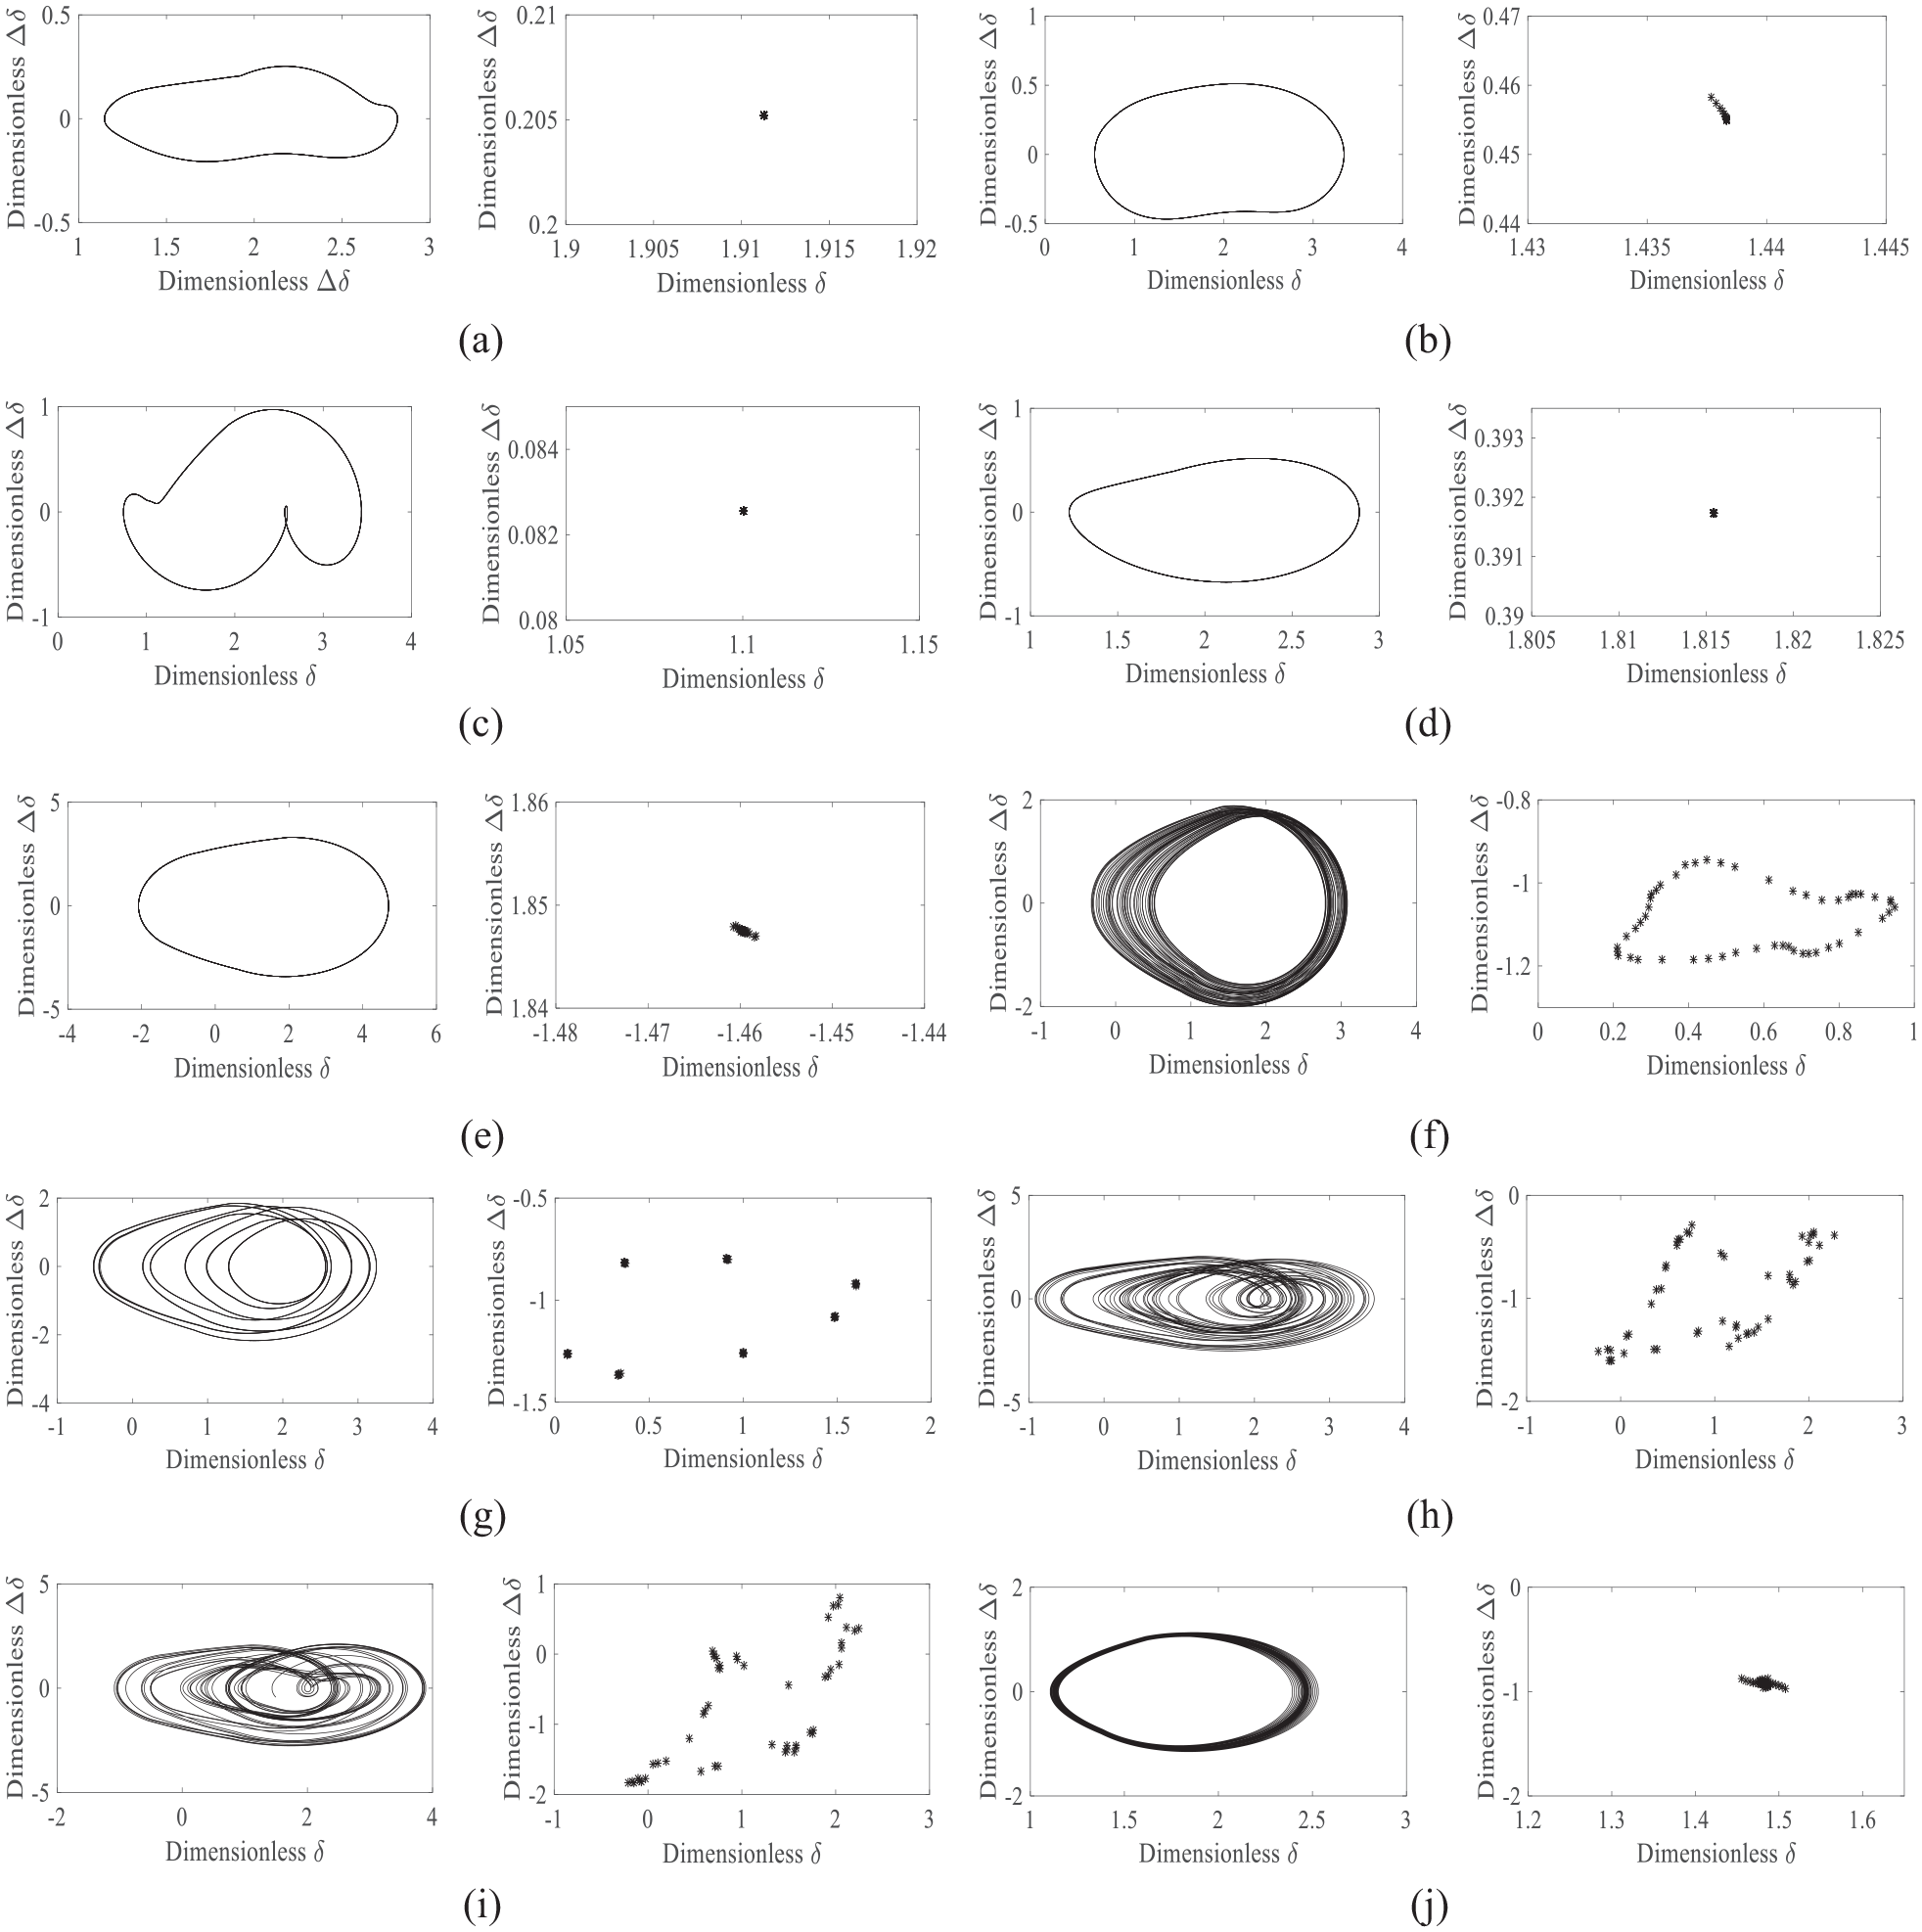
The bifurcation diagrams under 10–190 Nm show that the gear system exhibits synchronous 1T periodic motion until 3995 rpm. The system then undergoes n T periodic motions and chaotic motions at a rotation speed range from approximately 3995 rpm to 4183 rpm. Then the system exhibits chaotic, quasi-periodic and nT-periodic motions after 1T periodic motion. Finally, the dynamic behaviors become 1T periodic motion again. The corresponding phase diagrams and Poincaré maps at various rotational speed as shown in Figure 21(a) to (l).

Dynamic characteristic curves of the gear pair under constant torque from 10 Nm to 190 Nm: (a) 2526 rpm, 1T periodic motion, (b) 3589 rpm, 1T periodic motion, (c) 4058 rpm, 13T periodic motion, (d) 4089 rpm, chaotic motion, (e) 6560 rpm, 1T periodic motion, (f) 9935 rpm, 1T periodic motion, (g) 11,600 rpm, quasi-periodic motion, (h). 12,120 rpm, quasi-periodic motion, (i). 12,560 rpm, 7T periodic motion, (j). 13,500 rpm, 11T periodic motion, (k) 14,120 rpm, 14T periodic motion, and (l). 15,100 rpm, chaotic motion.
The preceding results imply that the input torque can affects the dynamic performance of the gear system. The speed also can affect the dynamic responses, such as the comparison of DTE between low or high speed ranges under different torque conditions. The system would undergoes n T periodic motions and chaotic motions during low speed range under low torque as shown in Figure 19(b). While this condition would not appearance under high torque as shown in Figure 19(a). Therefore, both the effects of torque and rotation speed should be considered in analyzing the dynamic performance of gear pair.
Conclusions
In this study, an improved calculation method of TVMS are proposed, and the effect of torque and rotation speed on TVMS is studied numerically with four constant load and two variable loads. Meanwhile, a 6 DOFs dynamic model of the gear pairs assembled in the ECVT are established. And their nonlinear dynamic characteristics are investigated based on the constructed dynamic model and the calculated TVMS. The main conclusions are as follows,
From the simulation results, the proposed method was found to be very effective in calculating the TVMS of helical gear pair under time-varying condition. Meanwhile, the TVMS increases/decreases with the increase/decrease of torque, the DTE of the gear increases with the increase of torque both under constant torque and variable conditions.
The gear system of ECVT appears in the 1T-periodic, periodic, and chaotic motions under both accelerating and decelerating conditions. Under the constant torque conditions, the system has a hopping point around 10,000 rpm, and does not appear when the torque is 10 Nm. Meanwhile, it exhibits periodic, and chaotic motions under 10 and 30 Nm during low rotational speed, but it does not appear when the torque increases. And, the rotational speed range of the system with the periodic, and chaotic motions under low constant torque is large than these under high constant torque. Moreover, when the rotational speed is larger than 15,000 rpm, the system exhibits respectively 4T-periodic, 2T-periodic and 1T-periodic when torque is 10, 70, and 130 Nm.
The system has a spike step around 4000 rpm both under uniformly drop and raise of torque, and the rotational speed of the system with the spike step under raise of torque is larger than that under drop of torque. The bifurcation characteristics of the system appeared both under drop and raise of torque. However, the extra chaotic motions of the system will appear when torque is small in the low speed range (about 4000–4100 rpm).
Overall, the results presented offer more details about the TVMS and the nonlinear dynamic responses of a helical gear pair under constant and time-varying input torques. This indicate that not only the rotational speed but also the torque should be considered when calculating the TVMS and analyzing the dynamic characteristics of gear pair.
Footnotes
Appendix
Handling Editor: Chenhui Liang
Declaration of conflicting interests
The author(s) declared no potential conflicts of interest with respect to the research, authorship, and/or publication of this article.
Funding
The author(s) disclosed receipt of the following financial support for the research, authorship, and/or publication of this article: The authors gratefully acknowledge the support by the National Natural Science Foundation of China (Grant No. 51475151 and 52075465) and the Natural Science Foundation of Hunan Province (Grant No. 2023JJ50016).