
Abstract
This research work aimed to enhance the crashworthiness of the existing automobile bumper to minimize crash injuries. As per the simulation results the weight of the carbon polyamide-based bumper is reduced in comparison with the existing steel bumper by 9.7 kg or 47.5%, with this reduction in weight 38% increase in fuel economy has been estimated. The energy absorption capability of carbon polyamide bumper is improved from the existing steel and aluminum bumper by 11.15% and 16.3% respectively and with this modification, the impact force is reduced from the existing steel bumper, which has 4.87 kN and aluminum alloy bumper, which has 4.10–1.86 kN. The crashworthiness parameter result analysis showed that the corrugated bumper geometry had a structural energy absorption (SEA), total energy absorption (TEA), and crush force efficiency (CFE) of 103.28 J/kg, 911 J, and 77.99%, which is higher than the hallow bumper geometry of 102.4 J/kg, 847 J, and 65.83% respectively. In addition to that, as the thickness of carbon polyamide bumper reduced from 4 mm to 3.5, 3, and 2.5 mm, deformation increased with a small rate from 13.5 mm to 16.7, 18.52, and 22.04 mm.
Keywords
Introduction
One of the biggest challenges in the present world is to provide optimal, efficient, cost-effective, and environmentally friendly transportation services. Designing a car that is economical, safe, and aesthetically pleasing has been a major challenge for designers. Bumpers are productive elements made of polymer composites and other impact resistive materials. Existing bumpers can withstand high loads but possess more weight. Figure 1 depicts the schematic view of automobile with distinct parts that includes bumper, crush brackets, radiator, and pipes of coolant. The main functionality of a bumper is not only to protects the major components present in the front end but also to improve the vehicle’s towing capacity. In order to utilize the possible options to economize energy, reduction in weight it has been given emphasis to considered the composite materials will make it possible to weight reduction of the bumper without compromising the stiffness, strength, and load carrying capacity. Since this material has more elastic strain energy, can withstand high amount of load, durability, corrosion, and high strength-to-weight ratio as in comparison to those of aluminum alloy and steel bumpers.

Vehicle front structure. 1
This study also presents the kinetic energy absorption during collisions and examines the effect of carbon fiber reinforcement to withstand the collisions that leads to severe damage and also investigate the most suitable optimized design for Toyota Camry automobile bumpers using Computer-Aided Engineering. The present study also concentrates on the benefits, performance, and limitations of existing bumper designs. Based on these requirements design improvements and optimizations have been made in terms of size, shape, and material selection. The design of the front bumper of the Toyota-Camry 2012 model car is simulated by utilizing FEM based LS-DYNA software with collision load and strength analysis according to international standards.
The main parameters which are going to be examined are the deformation, energy absorption, and impact force. The Explicit dynamic analyzes of the existing and modified bumpers are then compared under different loading conditions:
The maximum deformation occurs in the existing bumper at 20.2 mm, while the modified model deformed at a value equal to 13.5 mm. This indicates that the modified model provide better survival space and protection for the main front components of vehicle at event of front crush.
The modified model with an internal energy value of 911 J absorbs the maximum amount of kinetic energy, while the existing model remains at 791 J. This indicates that the modified model can absorb more kinetic energy with less deformation under the same conditions, which helps reduce the energy transferred to the main front components.
The maximum impact force occurs in the existing model with a value of 9.78 kN. The modified model has a force of 1.38 kN and a difference of 8.40 kN. This large force difference can add momentum to the vehicle and cause serious damage to the vehicle.
Literature review
A review of the existing literature provides insights to develop better designs and reduce Toyota Camry car injuries in the event of an accident in Ethiopia. From a cost-effective and rational use perspective, different studies on different bumper analyzes using different materials, methods, and experiments are being conducted around the world. This is done in different approaches; the collision safety performance of the entire bumper system is familiar regardless of the collision speed. The front end of the car is sturdy enough with foam inserts and bumper-cover to absorb a small amount of energy at low speed impacts without further damage to the critical components behind radiators, intercoolers, condensers, etc.2–7. In addition to all the above studies, “frame member behind the bumper beam and energy absorber was also investigated as well for a possible hybrid material replacement for crashworthiness improvement.”8,9 The choice of car bumper material depends on the following factors and Requirements: Absorb more energy while in collision, High resistance to rust, Low cost, Light in weight, availability of the material environmental condition, Easy for large scale manufacturing, and others. 10 About 75% of fuel consumption directly relates to vehicle weight. Lightweight composite materials provide opportunities for reducing vehicle weight, thus increasing fuel efficiency and reducing emission of harmful pollutants. On the condition of everything else remaining the same, 6%–8% increase in fuel economy can be realized for every 10% reduction in weight. Carbon fiber reinforced polymers, or often carbon fiber, are very strong and lightweight fiber reinforced plastics that contain carbon fiber.11,12 The shape of the honeycomb minimizes the use of expensive and heavy materials, so aluminum honeycombs are manufactured by an expansion process.13,14 The foam metal bumper has excellent impact resistance. There are two types of foam metal, open type and closed type. In the automobile manufactory, the closed type is mainly used for the manufacture of bumpers, which guarantees the optimum energy absorption.15–20
Vehicle safety standard for bumper
The National Highway Traffic Safety and Administration (NHTSA) have created several bumper standards for light passenger cars to understand the performance qualification of vehicles in low-velocity front and rear destruction. Bumper manufacturers must meet the following criteria: Components such as radiators and headlights that are placed immediately after the bumper should function the same as before and after the impact, the car bumper must withstand an impact of 4.023 km/h (2.5 mph) across the full width and an impact of 1.609 km/h (1.609 km/h) at the corners of the parked vehicle and the bumper should place from 16 to 20 inches above the road surface.21–25 All bumpers must meet the above criteria. As shown in Figure 2, the bumper has visible functional and safety damage in the vertical pendulum collision test at 4 km/h and pendulum collision test at the corner of 1.0 km/h. High velocity Impact Test: No bumper damage or yield after 8 km/h (complete impact) head-on collision against a flat and rigid barrier.26,27
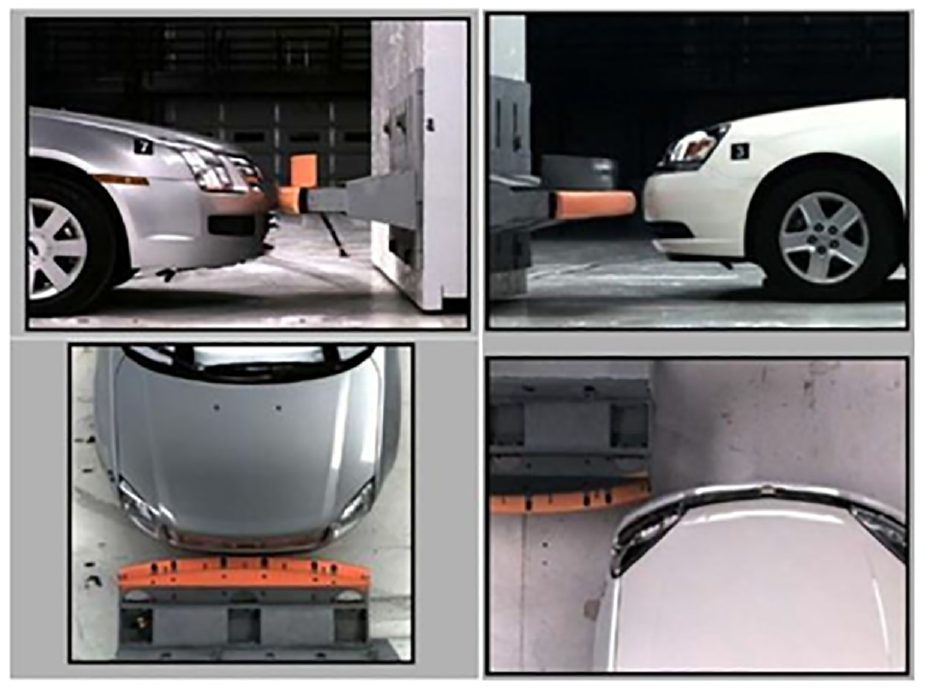
Full frontal impact and front corner impact. 28
The collision process produces accident records and relevant data for engineers to assess vehicle safety. Due to complicated crash procedure, preparing for each crash test is expensive and time consuming, and the data is only useful in a particular category (front, back, or side). This is because such a system is located at the front of the vehicle and is likely to come in to contact with the impact objects, regardless of impact type or velocity. Therefore, it is essential that the bumper system has excellent shock protection performance. 29
Crashworthiness test dynamic
Bumper test collision safety is largely dependent on either physical collision safety analysis or computerized finite element collision test simulation. CAE and FEA simulation techniques have many advantages over traditional physics testing. In addition, all domains are highly customizable, and the design group can iteratively adjust certain domains until they meet the design objectives, so the progress of the simulation is reproducible.30–32 The integration of the force-deformation curve provides the energy absorption of the corresponding deformation. Some concepts and terminology related to energy absorption and its \right)measurement are described below:
(a) Mean or average crush load (Favg), It is defined as the absorbed energy divided by the current deformation. It is better to use mean crushing load to compare different energy absorbers. This is an important parameter used in all analysis throughout this research.

(b) Peak crushing force (PCF) (Fmax), It is the maximum force which occurs during folding of tubes. This force should be kept equal to/preferably below a certain level in case of automobile crash safety design as a large Peak Crushing Force generally leads to high acceleration of the passenger.

(c) Crush force efficiency (CFE), It is the ratio between the average crushing load (Favg) and the maximum crushing load (Fmax), and it can be obtained from the equation:

This is a very important parameter for assessing the performance of structures during the crushing process. A useful measure of collapse load uniformity; for the optimal energy absorber, η = 1.
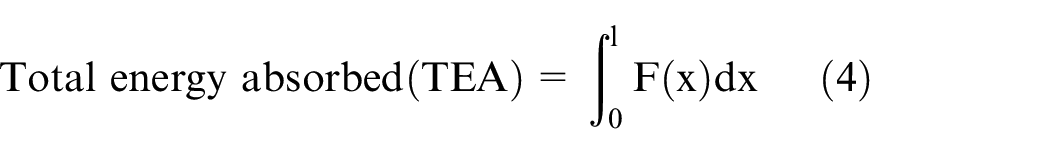
Where l is the effective squeezing stroke and F(x) is the squeezing force currently applied. Specific energy absorption (SEA) is the ratio of total energy (TEA) absorbed by a structure due to plastic deformation to the total mass (m) of the structure. The optimal requirement is to absorb the maximum impact energy with the lowest possible mass of the EA structure. In today’s automotive industry, structures with excellent power-to-weight ratios are highly valued. SEA is expressed as follows.
Materials and methods
The data collection was from a local car manufacturer’s manual and the bumper was modeled using SOLIDWORKS software with existing bumper model specifications. Once the CAD model of automobile bumper is designed, it is imported into LSDYNA pre-post environment to perform frontal crash simulation using the specified low-impact speed and also explicit dynamics have been performed for various bumper shapes. In case LS DYNA simulation, the most common and logical verification parameters are Energy balance, Energy Ratio, Ratio of hourglass energy (HE) to IE.33–35 The energy balance of the system in the event of an impact follows the law of conservation of energy. According to the law of conservation of energy, energy can neither be created nor destroyed, but it can be transformed from one form of energy to another. Applying the same principle to collision analysis, the amount of kinetic energy lost during impact must be converted to other forms of energy such as internal energy, sliding energy, and hourglass energy. Kinetic energy is the input work and internal energy is the output work. Internal energy is the energy absorbed by the system and is directly proportional to the product of force and deformation. Total energy is the sum of kinetic energy and potential energy of the whole system. The kinetic energy should be decreasing and internal energy should be increasing; and ideally the sum of kinetic energy and internal energy should be equal to total energy.
Energy ratio
The ratio of “work done by total initial energy” to “total energy” is called energy ratio. The total energy of the system =

An energy ratio with value of equal to 1 shows more stable and reliable FEA result, but most of it is difficult to achieve such value. This is due to the modeling error which may increases or decreases the total energy. There are two causes which can be considered when checking the energy ratio. If e > 1, which mean that artificially energy is added in the model and rises the total energy values, as a results instability occur, most of the time the rises of total energy is due to a numerical instability or through initial penetration. If e < 1, which indicates that the total energy reduces because of artificially energy is absorbed, either by excessive hour-glassing or during stabilization of an colliding contact surface.36–39 Generally, energy ratio simply is different from unity, and then there are high probability FE results to contain errors. Since it is difficult to obtain energy ratio equal to unity so, the acceptable value of the ratio is 1.00 ± 0.07 the discrepancies in the ratio are due to spurious energy produced in the system and simulation error.40,41
Ratio of TE/HE
From the energy balance curve graphs, the viability of the finite element model can also be judged from the relationship between the total energy and the hourglass energy. Hourglass energy causes zero-energy level for the model. If the hourglass Energy is less than 5% of the total energy, the finite element model is reliable. Modification and analysis of the different bumper geometries are presented. Optimization and analysis of the new model for the respective optimization parameters are imported and discussed in LS-DYNA.
3D-printed materials and FFF method
3D printing is an additive manufacturing process in which materials are applied layer by layer until the desired object is formed. On the other hand, traditional manufacturing refers to four major elimination manufacturing methods: CNC machining, injection molding, plastic molding, and plastic bonding. 3D printing allows for the design and print of more complex designs than traditional manufacturing methods. Traditional manufacturing involves cheap mass production and access to a large pool of skilled workers around the world, but there are design limitations that no longer apply when using 3D printing.
Carbon Polyamide (P-A 6/66) is based on a poly-amide matrix reinforced with carbon fibers containing 10% by weight. Poly-amides (P-A) are usually macro-molecules characterized under CO-N-H amide category. P-As belong to the semi-crystalline polymers, in which the macro-molecular chains in the solid state tend to be arranged in normal regular structures arranging along crystalline regions popularly called as “crystallites.” The distribution of the polymeric chains of CO-N-H between the amino group develops a strong bond between the adjacent macro-molecules. The addition of chopped carbon fibers with 10% by weight makes it feasible to achieve a composite material with high stiffness, mechanical and thermal resistance. The poly-amide matrix offers easy processing and high toughness at lesser temperatures. Carbon P-A has low-warpage and high dimensional accuracy during printing even despite of semi-crystalline polymeric behavior. 3D Printed Carbon P-A provides an excellent surface appearance, weight reduction with density as 1.16 g/cm3 and possible metal replacement in automotive and industrial applications. However, in order to protect the 3D Printed Carbon P-A from deformation over time due to its water absorb tendency, spray plasticizer will act as water proof for the component and also the component will get protected from UV light. 3D Printed Carbon P-A has excellent mechanical properties in comparison to aluminum AA-1050A, thus this material performs best for high mechanical stress applications such as motorsport, spoilers for F-1 cars, functional components such as Pedals and brake levers for motor-cycle bikes.
3D-printed carbon P-A
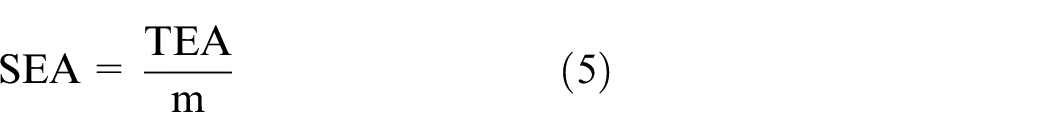
Manufacturing Process Samples were manufactured on a ROBOZE-ARGO-500, fed with fine filament having a diameter of 1.75 ± 0.05 mm, as shown in Figure 3. This thermo-plastic filament was continuously extruded through a 0.6 mm diameter of a nozzle. Before 3D printing process, concentration of water molecules will be minimized, that may be absorbed by the filament due to exposure to the moisture in environment. Carbon P-A spools were exposed to a drying cycle at a temperature of 100°C for 10–12 h in Thermal Dryer. The temperature inside the deposition chamber was set to 120°C. The printing parameters are given in Table 1, after the printing process the samples will be separated from the supports.
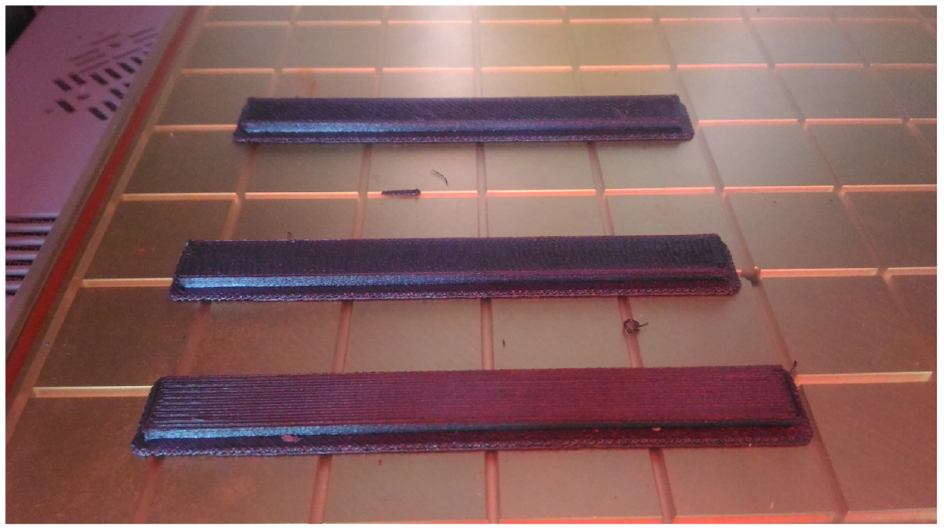
3D printed samples on the printing bed.
3D printing parameters of Carbon P-A.

Material characterization
Differential-Scanning-Calorimetry (D-S-C)
A state of melting point occurs at temperature when thermo-plastic polymers are exposed to higher temperatures unlike thermo-setting polymers, they experienced a progressive softening behavior until they reach throughout melting state. The heat energy applied through heat irradiation can slowly weaken and rapidly breaks the Vander-Walls bonding between the distinct polymer chains. This thermal phenomenon predominates further in reduction of the stiffness of the polymer, that stops an inherent elastic solid state and begins to assume the typical state of a viscous-elastic material. Moreover, at elevated temperatures, the thermal energy supplied to the polymer increases, that leads to the progressive dissolution of the crystalline polymeric domains. The phenomenon occurs at this temperature state is called melting temperature (Tm). The method popularly allows to evaluate the Tm is the Differential-Scanning-Calorimetry (D-S-C) as shown in Figures 4 to 6, for 0°, 45°, and 90° Carbon Fiber Orientation. Carbon-PA is a polyamide (P-A) matrix composite material along with chopped carbon fibers reinforcement. P-A offers good resistance to many hydrocarbon forms, such as fuels, Gasoline, Diesel fuel, Hydrocarbons, Aromatics, Oils, and Fuels. This makes poly-amides ideal for motor sport different automotive applications. The Tg value is the temperature at which polymers becomes from hard to soft. The major crystalline regions in semi-crystalline polymers influence the rigidity of the polymer. The crystalline melting temperature Tm can be utilized for 3D printing quality control and its better applications. These temperatures help in determining the texture of polymer state behavior and characteristic features of 3D printed polymers. Moreover, at the Tg the material can be sustain good mechanical properties during its usage. Therefore, it is important to determine for the bumper applications to be used at higher temperature regions or otherwise once exceed the Tg, the material starts to lose its stability to withstand impact loadings. Tg is typically determined by using a half-height method in the transition region. If the 3D printed polymer is cooled below this temperature, it will be hard and brittle, some polymers are utilized above glass transition temperatures and some are used below based on the application. Precautions must be taken while printing the polymer to regulates the temperature inside the 3D printing chamber in order to control the isothermal time and rate of cooling during post polymer heat treatment and modification to attain higher energy absorbing capacity. At Glass transition temperature hard-glassy state of a polymer material is transformed to a rubbery state.

DSC characteristics of layer thickness 100 µm at 0° fiber orientation.

DSC characteristics of layer thickness 100 µ at 45° fiber orientation.

DSC characteristics of layer thickness 100 µ at 90° fiber orientation.
Tensile properties
The angular coefficient determined from the linear elastic region by the tangent line is known as Young’s Modulus (ECPA), which is the proportionality constant between the strains experienced by the material and the applied stress as shown in Table 2. Young’s modulus is generally determined from the applied stresses at 0.05% and 0.25% strain. 3D printed components produced by AM possess anisotropic mechanical properties. The aim of the AM process is to create components of complex shape geometry; it is very tough to align the part in the direction that provides maximize mechanical behavior. For the present case considered, the variation of the mechanical properties was less than 30% between the combination being highest performance along (XZ) and the part with the lowest mechanical properties along (ZX), thus indicating a good precision of isotropy of the FFF based specimen. The ASTM-D638 standard was utilized to perform the characterization of the samples. The speed used to determine the tensile modulus was 1 mm/min and then increased up to 50 mm/min until the specimen got total deformation.
Tensile properties of Carbon PA measured at 25°C for different fiber orientations.

Dynamic mechanical analysis
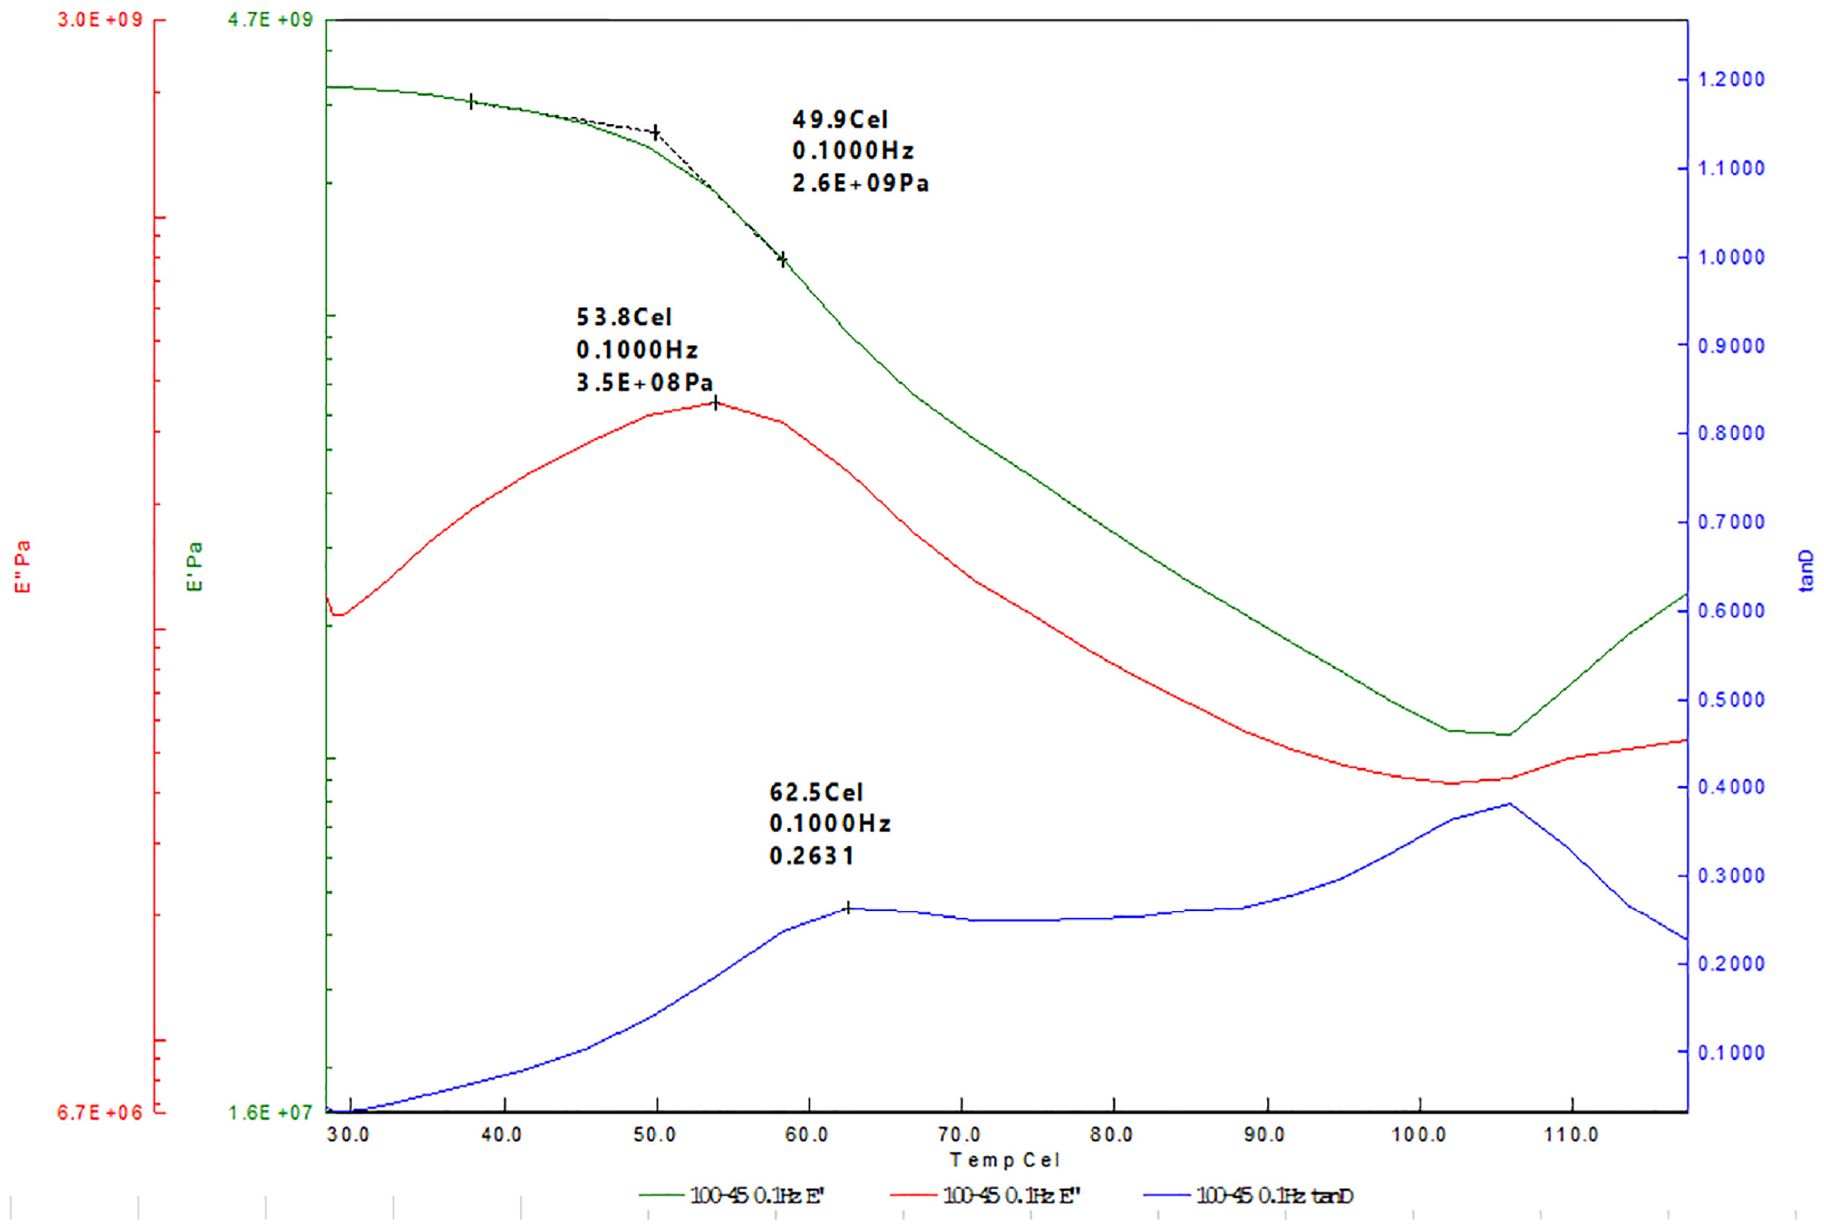
DMA is an important method used to measure the viscoelastic and mechanical and properties of materials such as thermosets, thermoplastics, Elastomers, Metals and ceramics etc. In DMA, the specimens are subjected to a periodic stress under different modes of deformation such as tension, bending, compression, and shear. Phase transitions can be estimated based on the measured Modulus as a function of time or temperature. DMA technology is the perfect solution when maximum accuracy is required and the material has to be characterized over a wide range of stiffness and/or frequency specially in the present research work to understand the behavior of the 3D Printed carbon CF under periodic stress at the prescribed frequency to sustain the impact absorption energy. The Additively manufactured specimens are clamped in the measurement head of the DMA setup and tested under Dual cantilever bending mode as shown in Figure 7. During DMA measurement, sinusoidal force is applied to the specimen via the probe. Dynamic Mechanical Analysis was utilized to evaluate the effect of carbon fiber orientation such as 0°, 45°, and 90° through additively manufactured 3D Printed Carbon P-A in absorbing the impact Energy. All three specimens were cyclically loaded using a given frequency under oscillation mode, throughout a controlled temperature at 5°C per minute, from 30°C to 135°C in order to evaluate both behavior till the glass transition region for the thermo-plastic polymer matrix as well as pseudo room temperature behavior of the sample. The software package connected to the DMS-6200 extrapolates a spectrum of output data, both in tabular and graphical format, including E′, E″, and tan δ as a function of temperature. A typical graphical output provided by the DMS6200 software package is shown in Figures 8 to 10 for printing layer thickness 100 µ at 0°, 45°, and 90° CF orientation. By exploring each graph, it has been noted that graphs are sub-divided into three color, each color coordinated subset of curves, green, red, and blue, corresponds to one of the three measured material properties, E′, E″, and tan δ or tanD respectively. Deformation caused by the sinusoidal force is detected and the relation between the deformation and the applied force is measured. Properties such as elasticity and viscosity were extrapolated as given in Tables 3 to 5 with different fiber orientations. The following Viscoelastic properties such as Storage modulus: E′, Loss modulus: E″, Loss tangent tanδ = E″/E′, was measured by using DMA6200.

Dual cantilever bending mode for DMA.

DMA characteristics of layer thickness 100 µ at 0° fiber orientation.
DMA characteristics of layer thickness 100 µ at 45° fiber orientation.

DMA characteristics of layer thickness 100 µ at 90° fiber orientation.
Extrapolation of 3D printed Carbon P-A-DMA characteristics for 0° CF orientations.

Extrapolation of 3D printed Carbon P-A DMA characteristics for 45° CF orientation.

Extrapolation of 3D printed Carbon P-A DMA characteristics for 90° CF orientation.

The maximum estimated storage modulus (E′) was determined for all three 3D printed specimens. as shown in Figure 11, In examining it has been observed that the Storage Modulus for 45° is higher that signifies, the Higher the storage modulus higher will be the energy storage capacity of the 3D printed Carbon P-A material with 45° fiber orientation. Also, Material flow recovery possibility will be more than a less storage modulus value toward their original state after removing the impact force.

Storage modulus.
The maximum estimated Loss modulus (E″) was determined for all three 3D printed specimens, as shown in Figure 11, It represents the absorption energy stored in the 3D printed material and If it is higher when compare to other fiber orientations then it can be regarded as mainly more elastic. The loss modulus represents the viscous part or the amount of energy dissipated in the sample and it is the major requirement of energy absorption during its functionality as in the present consideration of bumper.
The maximum estimated Loss tangent (Tan δ) was determined for all three 3D printed specimens, as shown in Figure 12, the Tan δ is indication of the effectiveness of a 3D printed material’s damping capacity in response to the impact forces. The higher the Tan δ, the greater the damping coefficient of the material and more efficient the material will be in accomplishing energy absorption during collision. It signifies the material quality of absorbing energy. It can be seen from the Figure 13, that loss tangent value is higher for the 45° fiber orientation. By comparing all the DMA characteristics of the proposed 3D Printed Carbon P-A material for the application of the bumper, material properties of carbon reinforced fiber with 45° orientation has been utilized for the crashworthiness analysis in LS-DYNA software simulation for evaluation of energy absorbing assessment under vehicle safety standard conditions.

Loss modulus.

Loss tangent (Tan δ).
FEA based LS-DYNA simulation
Modeling and analysis
Collect the necessary data about Toyota Camry car existing bumpers is helpful for numerical analysis. Various data have been collected to understand the current state and methodology of car bumper research, which also helps in the development and modification of car bumper structural impact resistance. Technical specification and necessary data of the existing Toyota CAMRY vehicle has been collected from the vehicle manual itself and carfolio car specifications. All necessary information of Toyota Camry vehicle is shown in Table 6. In addition to this, when dealing with crash worthiness, the mass of the vehicle parts plays vital role.42,43
Toyota Camry 2.5 (2012) specifications.

The model has been done using the overall dimension of length, width, and height of the vehicle structure. Over all dimensions of the vehicle of 2012 Toyota Camry overview are Length = 4806 mm, Width = 1821 mm, and Height = 1471 mm. Use CATIA v5 and SOLIDWORK 2015 to develop a 3D model of the vehicle bumper as shown in Figure 15. Mesh generation includes mesh type, size, and geometrical attributes. There are three different mesh types, 1D, 2D, and 3D, relevant to element dimension. Automobile bumper were mostly a shell plate, which means that the length and width of the structure is considerably larger than its thickness. Therefore, 2D mesh type was used. The bumper was meshed with a mixture of linear quadrilateral 97.7% and triangular elements 0.295% using LS DYNA software. The total number of elements in the entire mesh model was 35,295 and the number of nodes was 38,392. So, the whole meshed model is very complex and computationally intensive, Pre-analysis checking Checks that need to be performed before performing an analysis on LSDYNA as shown below in Figure 14.

Front bumper model.
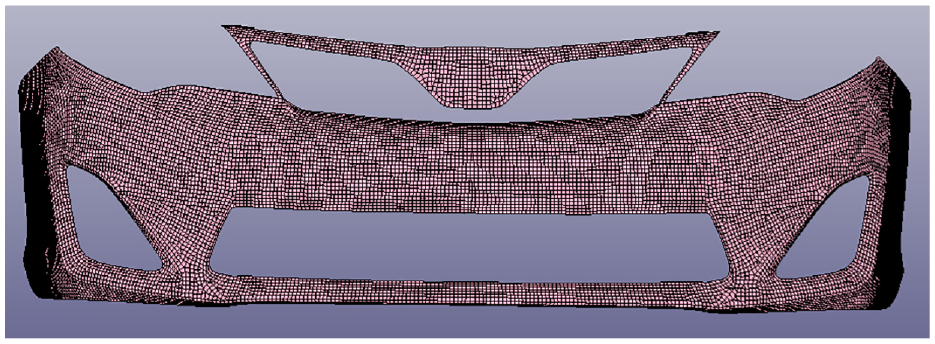
Meshed model for bumper.
Inertia considerations
To easy the model, the entire car component is not modeled, but is represented as a point mass and a rigid body. The components worked primarily in series, traveling from the front to the center of the car, all interconnected. According to Lad and Rao,
44
Gouasmi et al.,
45
and Gholipour et al.,
46
the impactor mass should be the same as the mass of the entire vehicle; thus, a gross mass of the vehicle was given to the impactor. Hence the initial mass of impactor while modeling and defining material has default mass
Definition of material properties on LSDYNA workbench
To meet both lightness and strength requirements, composites are important lightweight automotive materials due to their excellent properties and have extended application in many vehicle models. The vehicle component material was selected from the LSDYNA material library. The keyword for existing car bumper materials is MAT_PIECEWISE_LINEAR_PLASTICITY, and in case of impactor, this part is un-deformed and is modeled with MAT_RIGID.
Loading and boundary condition
According to National highway traffic safety administration (NHTSA), the bumper should withstand at a speed of 2.5 mph (4.023 km/h) across the full width and 1 mph (1.609 km/h) on the corners. No bumper damage or yielding after 8 km/h (full impact) frontal impact into a rigid barrier. 47 , 48 Contact pairs frequently experience non-linear plastic and permanent deformation Depending on the deformable body shape and material properties, and thus LSDYNA comes with a selection contact computational algorithms to deal with contact definitions with a contact interaction property between the bumper and the rigid impactor with static and dynamic friction of 0.3 and 0.2 respectively. These input parameters are applied during operation, and when the analysis is carried the back edge of the bumper is constrained as shown below in Figure 16.

Boundary condition given to rigid pole and bumper: (a) front and (b) back view.
Verification parameters
For LS DYNA simulations, the most common and logical validation parameters are:
Energy balance: The energy balance of the system in the event of an impact follows the law of conservation of energy. The kinetic energy should be decrease and internal energy should be increase; and ideally the sum of kinetic energy and internal energy should be equal to total energy. The energy of the hourglass should be less than 5% of the total energy.
Energy Ratio: the energy ratios with a value of 1 give more stable and reliable FEA results, but due to modeling errors it is difficult to equalize the energy ratio to 1, the permissible value for this ratio is 1.00 ± 0.07.
Ratio of hourglass energy (HE) to IE: Hourglass energy can cause a zero-energy model. If the hourglass Energy is less than 5% of the total energy, the finite element model is reliable. 49 , 50
Modification on the existing automobile bumper
Excessive modifications can affect the road handling performance of the vehicles, that is, adding too much weight and other safety measures can affect the stability, fuel economy, and also leads to inaccurate laws and violate insurance sites. Therefore, it is very important to remain safe and legal when modifying a car. In order for the improvements to be made on automobile bumper the following additional criteria should also be satisfied, Have little or no impact on the vehicle’s compliance with mandatory vehicle standards. Does not compromise the safety, strength, or reliability of critical systems. 51 , 52 The vehicle must be structurally sound and able to support/adjust the necessary adjustments without the need for mechanical repairs.53, 54 The added energy absorbing parts are designed in order to have a controlled deformation. This deformation zones not only absorbed the kinetic energy of impactor, but also the kinetic energy of the whole vehicle as depicted in Figure 17.

Corrugated reinforcement.
Materials of different thicknesses exhibit different performances. The finite element model of the carbon-polyamide composite bumper system relied on the existing model of the steel bumper system. The cross-sectional dimensions and length of the bumper are the same as the conventional high-strength steel bumper. The wall thickness of the composite bumper should be designed bigger as the stiffness of the material is lower than high-strength steel given the same volume and the wall thickness of the composite set approximately twice as high as a high-strength steel bumper. If the bumper is made too thick, further kinetic is transferred from the impactor to the automobile and less plastic strain energy will be dissipated, reducing post-impact deformation. The orientation of the fiber in LSY-DYNA software is shown Figure 18.

CP-A fiber orientation in LSDYNA.
The layup design is major factor that contributes to the impact strength of the laminated composite structure against low speed impacts. For that reason, when outline the composite laminate, it is useful first consider the stacking order of the layers and define the proper symmetry and balance of the stacking.37,55, 56
Results and discussion
As shown in Figure 19: the maximum resultant deformation and von-Misses stress for the hollow bumper geometry is 12.88 mm and 1480 MPa respectively.

(a) Max. resultant deformation = 12.88 mm and (b) max equivalent (von-misses) stress = 1480 MPa at 4 km/h.
Energy balance for hollow bumper geometry
According to the law of conservation of energy, the amount of kinetic energy lost during impact must be converted to other forms of energy such as internal energy, sliding energy, and hourglass energy. From Figure 20, the total energy consumed is constant throughout.

Energy balance.
Energy absorption
Initially, the high kinetic energy at the start of the impact is equal to the total energy with a value of 1090 J, and when the crushing event begins, the system’s kinetic energy begins to decay slowly and is transformed to other form energy, eventually reaching energy of 188 J. From this difference, 902 J of energy is absorbed and converted into internal energy, sliding energy, and hourglass energy. Of these, as shown in the Figure 21 below, 847 J, or 77.7% of the energy, is dissipated in the form of internal energy, and the remaining 22.3% of the energy is dissipated in the form of sliding and hourglass energy.

Internal energy.
Deformation
In LS DYNA, displacement is detected by measuring the relative distance between two nodes. Therefore, to measure the change in bumper displacement, we will use two nodes (node ID 2176465 for node 2181714), by measuring the relative distance between the two nodes after a collision, it is easy to find the overall deformation of the bumper. From Figure 22: that the maximum displacement of node 2176465 with respect to node 2181714 in the X direction is about 15.8 mm.

Resultant x, displacement.
Impact force
Initially, the impact force between the rigid pole and front bumper is almost zero until the time reaches 4.55 ms. after this point, the force begins to increase to its maximum in 48.1 ms with the force value of 3.21 kN and there is almost no fluctuation. The rigid pole and front bumper have equal resultant contact force pulse but acted in opposite direction as shown in Figure 23.

X-impact force.
Verification using energy ratio for hollow bumper geometry
The simulation produce maximum value of 1.001 energy ratios and this value is approximately one with an error of 0.001% which is acceptable range.
Verification using ratio of TE/HE for hollow bumper geometry
The total energy is 1.09 kJ, the maximum value of the hourglass is 0.0377 kJ, and the HE/TE ratio is 3.46%, which is acceptable.
Corrugated bumper geometry
As it is indicated on the counter Figure 24, the maximum resultant deformation and von-Misses stress for the corrugated geometrical shapes is 17.75 mm and 1364 MPa respectively.

(a) Max. resultant deformation = 17.75 mm and (b) max equivalent (von-misses) stress = 1364 MPa at 4 km/h.
Energy balance for corrugated bumper geometry
From Figure 25, the kinetic energy is high at the beginning, with a value of 1080 J at the start of the impact, and slowly decreased and converted into other forms of energy, eventually reaching energy of 146 J.

Energy balance.
Energy absorption for corrugated
Initially, the kinetic energy is high at a value of 1080 J at the beginning of the impact, and when the crushing event begins, the kinetic energy of the system begins slowly decrease. It is then converted into other forms of energy, eventually reaching energy of 146 J. From this difference, we can see that the energy of 934 J is absorbed and converted into internal energy, sliding energy, and hourglass energy. 84.35% or 911 J of energy is dissipated in the form of internal energy, as shown in the Figure 26; remaining 15.65% of the energy is dissipated in the form of sliding and hourglass energy.

Internal energy.
Deformation
Using two nodes of a corrugated bumper (node ID 2176465 (at the center of more damaged area) and node 2181714 (at either corner of a less affected area)). From Figure 27, the maximum displacement of node 2176465 with respect to node 2181714 in the X direction is about 13.5 mm.

Resultant x-displacement.
Impact force
Initially the contact force is almost zero until the time reaches 0.00027 ms, after this point the force starts to increase to its maximum at 0.016 ms with force value of 1.49 kN as shown in Figure 28.

X-impact force.
Verification for corrugated bumper geometry-energy ratio
The simulation produces an energy ratio with a maximum value of 1.0015, which is approximately 1, with an error of 0.0015%, which is acceptable.
Ratio of TE/HE
The total energy is 1.09 kJ, the maximum value of the hourglass energy is 0.00721 kJ, and the ratio of HE/TE is 0.66%, which is acceptable.
Thickness optimization for modified bumper geometry-deformation
The deformation values are obtained by measuring the relative displacement from two nodes (one at the right or left end of the bumper and the other at middle of the bumper). With this measurement the value of deformation graph for different thickness of the bumper was shown below. The bumper thickness is 2.5, 3.0, 3.5, and 4.0 mm. Figure 29 shows, as the thickness of the bumper increases from 2.5 to 4 mm, the maximum deformation of the bumper decreases and the rate of decrease becomes also less with the increase of thickness. This does not mean that a bumper with less thickness is always better because more deformation means that there is probability of intrusion to the vehicle main compartments.

Comparison of deformation for different thickness.
Energy absorption
As it can be seen in Figure 30, the higher deformation of the bumper leads to more absorption of energy of the composite bumper. The maximum amount of energy absorbed by the bumper is reduced as the thickness becomes increased.

Comparison of internal energy graph for different thickness.
When the impact velocity increases deformation, energy absorption and impact forces are increased, but too much increasing causes the bumper fail to withstand the impact loads and violating the standards as shown in Table 7.
Comparison of hollow and corrugated bumper model with CPA material at a velocity of 4, 5, and 6 km/h.

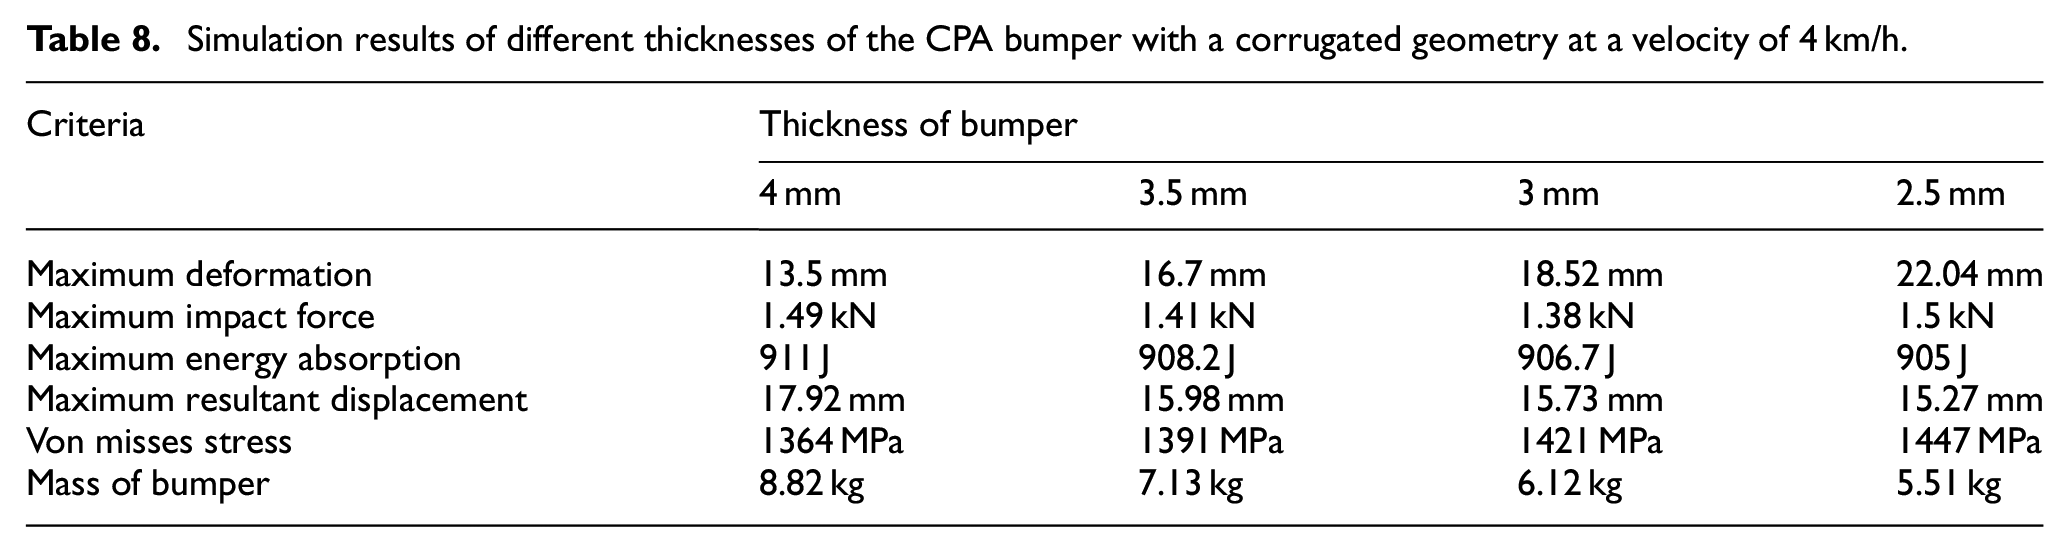
As the thickness of the bumper increases the mass do so and causes for more inertia and too much decreasing the thickness means deformation increases highly and reaches to the interior vehicle parts, therefore as per the results we obtained the optimal thickness chosen is 3 mm as shown in Table 8.
Simulation results of different thicknesses of the CPA bumper with a corrugated geometry at a velocity of 4 km/h.
The corrugated geometry has good CFE and energy absorption with less crash stroke than the hollow bumper geometry as shown in table 9.
Crashworthiness parameter result analysis of hollow and corrugated bumper geometry using CPA material at a velocity of 4 km/h.

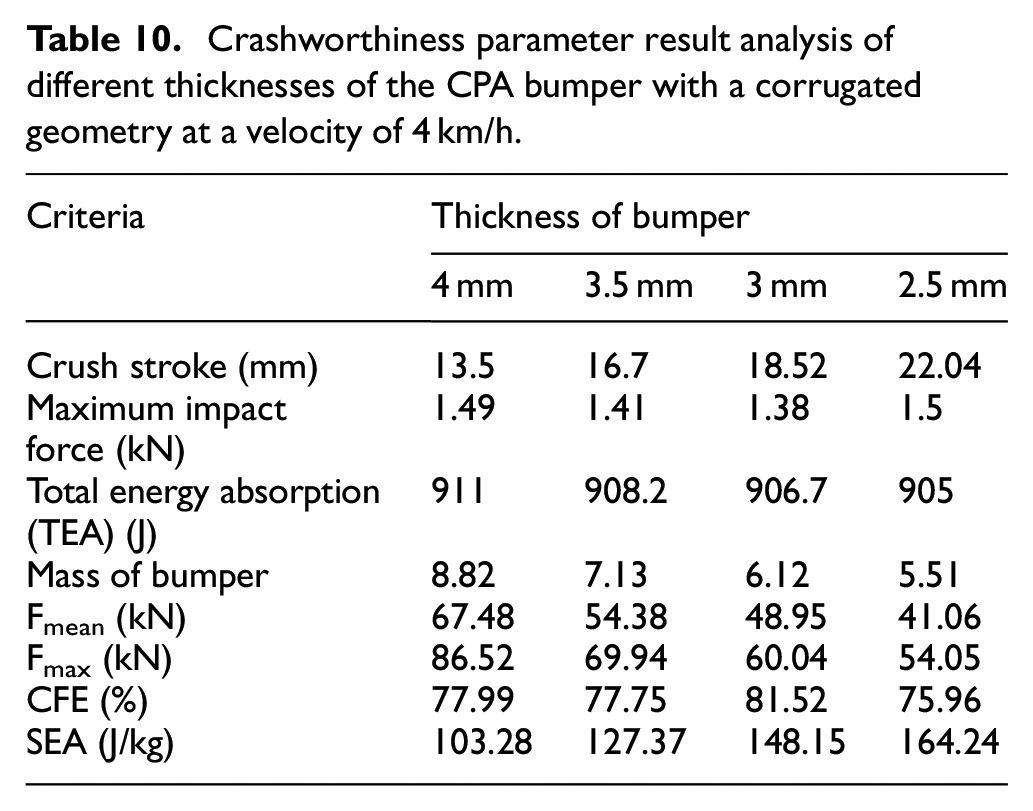
The CFE is high for thickness of 3 mm, even though the energy absorption capacity is increased with thickness but the rate is very small as shown in Table 10.
Crashworthiness parameter result analysis of different thicknesses of the CPA bumper with a corrugated geometry at a velocity of 4 km/h.
Conclusion and recommendation
This study focuses on design optimization and FE analysis of various materials, geometry, and thickness car bumpers for Toyota Camry vehicles. Energy absorption is the most important thing to consider when optimizing design. Toyota Camry car bumpers were analyzed using LSDYNA software. The energy absorption capability of carbon polyamide bumper is improved from the existing steel and aluminum bumper by 11.15% and 16.3% respectively and the weight of the carbon polyamide bumper is reduced as we compare with the existing steel bumper by 9.7 kg or 47.5%, with this reduction in weight 38% increase in fuel economy. The structure of the corrugated model created more living space than the hollow model by only deforming 13.5 mm, while the hollow model deformed by 15.8 mm. This shows that the corrugated model provides 17.03% more protection for sensitive parts of the vehicle. When comparing the corrugated with the hollow model the energy absorption at 4, 5, and 6 km/h is increased by 64, 91, and 170 J respectively. The energy absorption capability of carbon polyamide bumper is improved from the existing steel and aluminum bumper by 11.15% and 16.3% respectively. The crashworthiness parameter result analysis showed that the corrugated bumper geometry had a structural energy absorption (SEA), total energy absorption (TEA), and crush force efficiency (CFE) of 103.28 J/kg, 911 J, and 77.99%, which is higher than the hallow bumper geometry of 102.4 J/kg, 847 J, and 65.83% respectively. As the thickness of carbon polyamide bumper reduced from 4 mm to 3.5, 3, and 2.5 mm, deformation increased with a small rate from 13.5 mm to 16.7, 18.52, and 22.04 mm respectively. The results show that the corrugated bumper model has higher energy absorption and minimal deformation compared to the hollow bumper model. Therefore, the corrugated bumper model is used as the best model to minimize injury to automobile parts and human body in the event of accident.
Footnotes
Appendix
Acknowledgements
The authors extend their appreciation to the Department of Materials Science and Engineering, Adama Science and Technology University, Ethiopia for Technical expertise and financial assistance in doing experiments.
Handling Editor: Chenhui Liang
Author contributions
Every author has significant contribution toward the successful completion of the manuscript.
Declaration of conflicting interests
The author(s) declared no potential conflicts of interest with respect to the research, authorship, and/or publication of this article.
Funding
The author(s) disclosed receipt of the following financial support for the research, authorship, and/or publication of this article: The authors extend their appreciation to the Deanship of Scientific Research at King Khalid University for funding this work through the Large Groups Project under grant number RGP2/367/44.
Data availability
The data will be made available on request.