
Abstract
A rigid-flexible dynamics model is built. In view of established 7-DOF vibration model, the expressions of the output indexes are derived and the influence mechanism of suspension parameters on ride comfort is revealed. The effects of different vehicle speeds on ride comfort on bump road are studied in the frequency and time domains by analyzing the suspension dynamic disturbance by taking the vertical acceleration of the foot floor and seat rail, the wheel dynamic loads, and the suspension dynamic deflections of the suspension as the objects of analysis. The effects of dynamic changes in the suspension spring and damper parameters on the time and frequency domain response indices are analyzed. Two window functions are used on the bump road to process and analyze the time domain charts of the front and rear of foot floors and seat rails in the vertical direction, and the
Introduction
When the vehicle is running, the unevenness of the road and the excitation of the transmission system and other factors will cause the vibration of the vehicle, which will affect the ride comfort. As the vehicle speed increases, the demand for vehicle ride comfort is also increasing. The vehicle ride comfort is mainly to keep the vibration and shock generated by the vehicle in driving within a certain range on the comfort of the occupants. Road surface unevenness and vehicle speed form the excitation of the vehicle vibration system, this excitation through the tires, suspension, seats and other elastic and damping elements finally act on the human body. In this process, the most important part that affects the vehicle ride comfort is the suspension, and the reasonable matching of suspension structure parameters has an important impact on the ride comfort.1,2 And its good and bad directly affect the vehicle ride comfort performance and the driving process of the advantages and disadvantages.
Uys et al. aimed at optimizing the spring and shock absorber parameters for the Land Rover Defender 110 model for optimal ride comfort on different surfaces and at different speeds. The Dynamic-Q algorithm is used to optimize the vehicle speed from 10 to 50 km/h, and it is concluded that the rear shock absorber is as soft as possible, and the front shock absorber is the most comfortable from soft to hard according to the road condition and speed, and the vehicle ride comfort is related to the elastic stiffness of the rear shock absorber. 3 Qi et al. proposed a novel suspension structure with hydraulic linkage suspension and electronically controlled air springs in order to balance the vehicle handing stability and vehicle ride comfort. By simplifying the whole vehicle system with the 9-DOF, hydraulically linked suspension model and electric air springs, the relationship between handling stability and comfort at different suspension heights with different suspension structures is analyzed. 4 Shi et al. investigated the effect of negative stiffness on the performance of suspension systems. This negative stiffness structure consists of a passive magnetic negative stiffness spring and a modified locating mandrel, and it was experimentally demonstrated that the increase in negative stiffness resulted in better vehicle ride comfort. For semi-active suspensions, negative stiffness mitigated the effect of damping in the semi-active oscillator and improved vehicle ride comfort. 5 Trupti et al. adopted a two-degree-of-freedom quarter virtual prototype model with Simulink module to analyze its ride comfort and dynamic response of the road surface in order to enhance the ride comfort for passenger. And the effects of suspension damping coefficient, stiffness, spring load mass and speed on the smoothness of the virtual prototype system were analyzed. 6 Cebon designed a test method for the hysteresis characteristics of leaf springs to investigate the response of the hysteresis characteristics of a vehicle model using two degrees of freedom under random vibration. By conducting random vibration tests on different forms of multi-piece leaf springs, the hysteresis charts of leaf springs at different excitation frequencies were obtained, and the test results obtained can be consistent with the empirical equations of the leaf spring hysteresis model. 7 Abood and Khan researched the effect of vertical secondary suspension stiffness on railroad. The simulation results of the vehicle ride comfort using a railroad vehicle simulation model as an example. A combination of linear the Kalk theory and nonlinear heuristic models was used to optimize the suspension spring stiffness and improve the vehicle ride comfort. 8 Zhang et al. analyzed a variety of the suspension structures based on the vehicle one-fourth suspension model to compare the specific operation of semi-active suspensions under skyhook control, ground-hook control and hybrid control strategies, respectively. And the results showed that the hybrid control strategy was more able to balance the vehicle ride comfort and vehicle handling stability. 9 Bello et al. designed a control method for a suspension structure by first constructing a quarter vehicle state space model with two degrees of freedom and a complete state feedback controller. Simulations using Simulink showed that the active suspension system produces a good dynamic response even at resonant frequencies and had better ride comfort compared to the passive suspension system. 10 Arslan et al. designed a fuzzy logic sliding mode controller and conducted dynamics simulation experiments on the performance of this controller to analyze the biodynamic response of the body to the vehicle vibration system. Numerical results showed that the controller overcomes the shortcomings of previous control methods and greatly reduced the vehicle vibration. 11 Park et al. compared the vehicle ride comfort of passenger vehicles with suspension systems equipped with two different magnetorheological dampers, with the difference between the two MRs being the presence or absence of a bypass hole in the piston. Simulations and experiments have proved that MR dampers with bypass holes provide better ride comfort than dampers without bypass holes. 12 Seifi et al. pit forward a multi-objective optimization method using a nonlinear damper model to improve the vehicle ride comfort and vehicle handing stability. A simulation analysis of the suspension system under sinusoidal road excitation was carried out using a five-degree-of-freedom model of the vehicle. The results showed that the average ride comfort of the front and rear suspension improved by 3.58% and the handling stability improved by 0.74%. 13 Silveira et al. 14 researched the effect of damper damping asymmetry on vehicle ride comfort based on the one-fourth vehicle vibration model and found that the vehicle ride comfort was better considering the damper damping asymmetry than not considering its effect.
The above scholars have conducted local studies on suspension and vehicle performance from the perspectives of structural parameters, suspension form, virtual prototype modeling, and construction of approximate modeling. However, the vehicle ride comfort performance when the vehicle vibrates on a bump road has not been systematically studied in depth, and most of the scholars have conducted studies based on random road surfaces. The systematic effect of vehicle speed on vehicle ride comfort is also not explored in combination with the frequency and time domain perspectives. Secondly, when the vehicle is disturbed by external excitation, the local vibration and global vibration of the vehicle are not considered. Finally, based on the premise that the vehicle is subject to local vibration and global vibration, this is no research on the collaborative optimization and matching of vehicle suspension parameters and vehicle driving ride comfort based on the whole vehicle rigid-flexible coupling model for a specific front and rear suspension structure.
To address the unresolved issues, this research paper considers the following aspects: (1) The effect of different vehicle speeds on vehicle ride comfort of driving on bump road is investigated from the frequency domain and time domain respectively; (2) The output index expression is derived from the 7-DOF vehicle vibration model, and the influence mechanism of spring stiffness and damper damping parameters on vehicle ride comfort is revealed; (3) The systematic effects of suspension spring stiffness and damper damping on the response indices of the vehicle in the time and frequency domains are systematically analyzed; (4) Based on the premise of considering the local and global vibration of the foot floor and seat rail of the front and rear, the window function is designed to process and analyze the time domain charts of the foot floor and seat rail on the vertical direction; (5) The evaluation index of total vehicle ride comfort considering local vibration and global vibration is determined, and the parameters of the front and rear suspension are matched and optimized by multi-objective genetic optimization algorithm to improve the vehicle ride comfort.
7-DOF vehicle vibration system model
For studying the dynamic characteristics of the suspension and revealing the systematic influence of the suspension parameters on the vehicle ride comfort, a 7-DOF vehicle vibration system model is established in this paper, as shown in Figure 1.

7-DOF vehicle vibration system model.
The coordinate system is set to
In Figure 1,
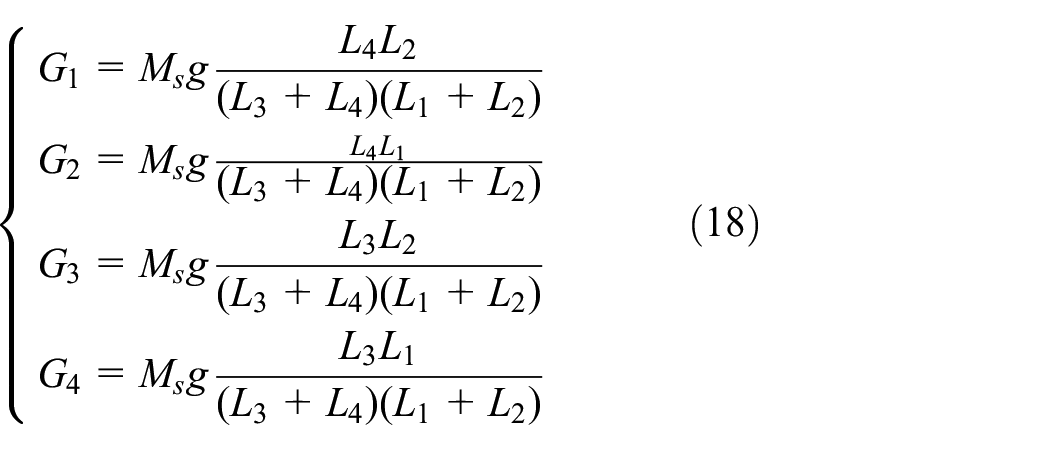
According to Figure 1, the force expression

The vertical displacement

From equations (1) and (2), the motion equation of the body in three directions can be derived as follows:

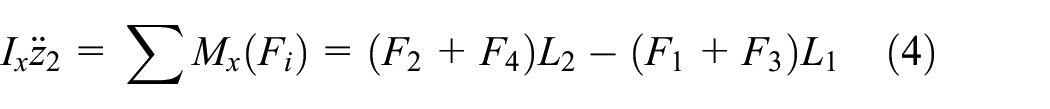

The motion equation of the unsprung mass is as follows:

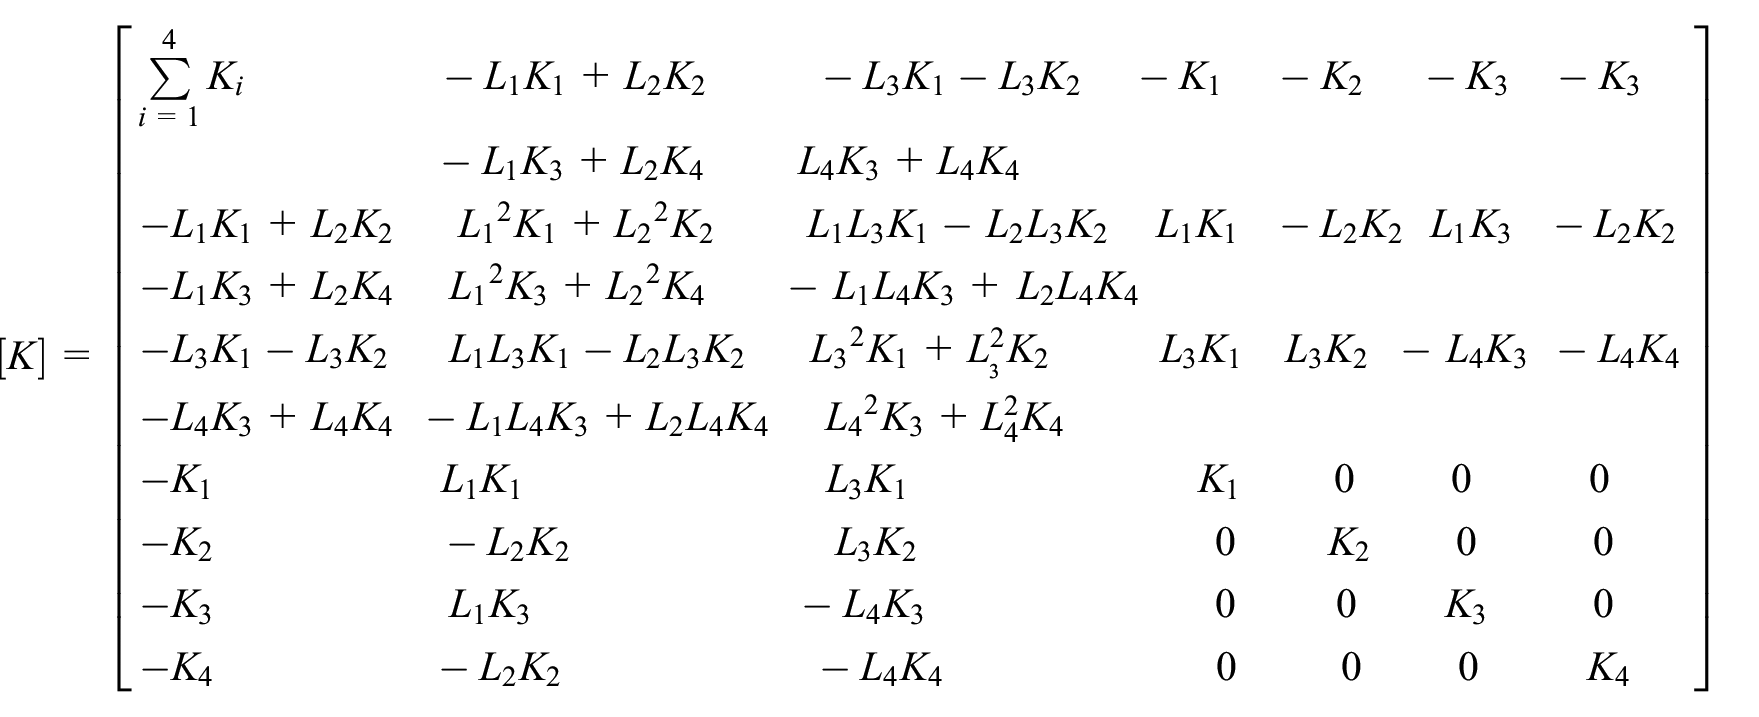
Bringing equations (1) and (2) into equations (3)–(6), the vibration equation is obtained as follows:


In equation (7),
Where
The output indicators of the 7-DOF whole-vehicle vibration system are body acceleration, dynamic load, and dynamic deflection, respectively.
The acceleration includes not only the vertical acceleration, but also the body roll acceleration and pitch acceleration, as well as the vertical acceleration of the four wheels and the body connection. Similarly, the dynamic tire loads and suspension dynamic deflection include the relative dynamic loads and suspension dynamic deflections at the four wheels.
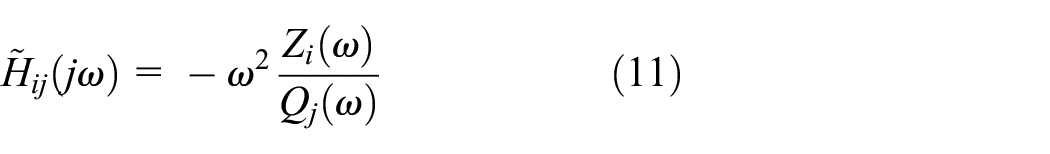
The transfer function of a 7-DOF system is expressed as follows:

The output power spectral density matrix is connection to the input power spectral matrix by the following equation:

In equation (9),

In equation (10),
1)
The second order derivative
where

Then the

2)
From the definition of suspension dynamic disturbance, it can get:

Bringing equations (2)–(14) yields the following equation, so that is:

Squaring both sides of equation (15) yields, that is:

Since
3) Relative dynamic load.
The static load of the wheels relative to the ground is:
The dynamic load of the tire is

Taking equation (1) into (19) yields equation (20), that is:

The Fourier change to equation (20) is:

Defining

where

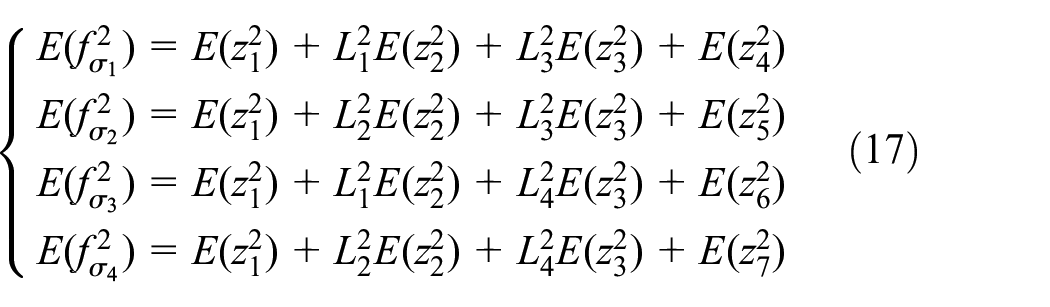
Then the relative dynamic loads are respectively:

From the above derivation process of the output index of the whole vibration system, the mechanism of the vehicle ride comfort of the influence of the spring stiffness and damper damping on the can be summarized as follows:
The difference of spring stiffness and damper damping of the suspension will affect the suspension stiffness and suspension damping respectively, which in turn will affect the transfer function jointly solved by the road unevenness coefficient, the road input spectrum determined by the vehicle speed and the suspension parameters, thus affecting the frequency response function matrix of the output index, and ultimately affecting the vehicle ride comfort.
Establishment of the vehicle multi-body dynamics model and construction of bump road
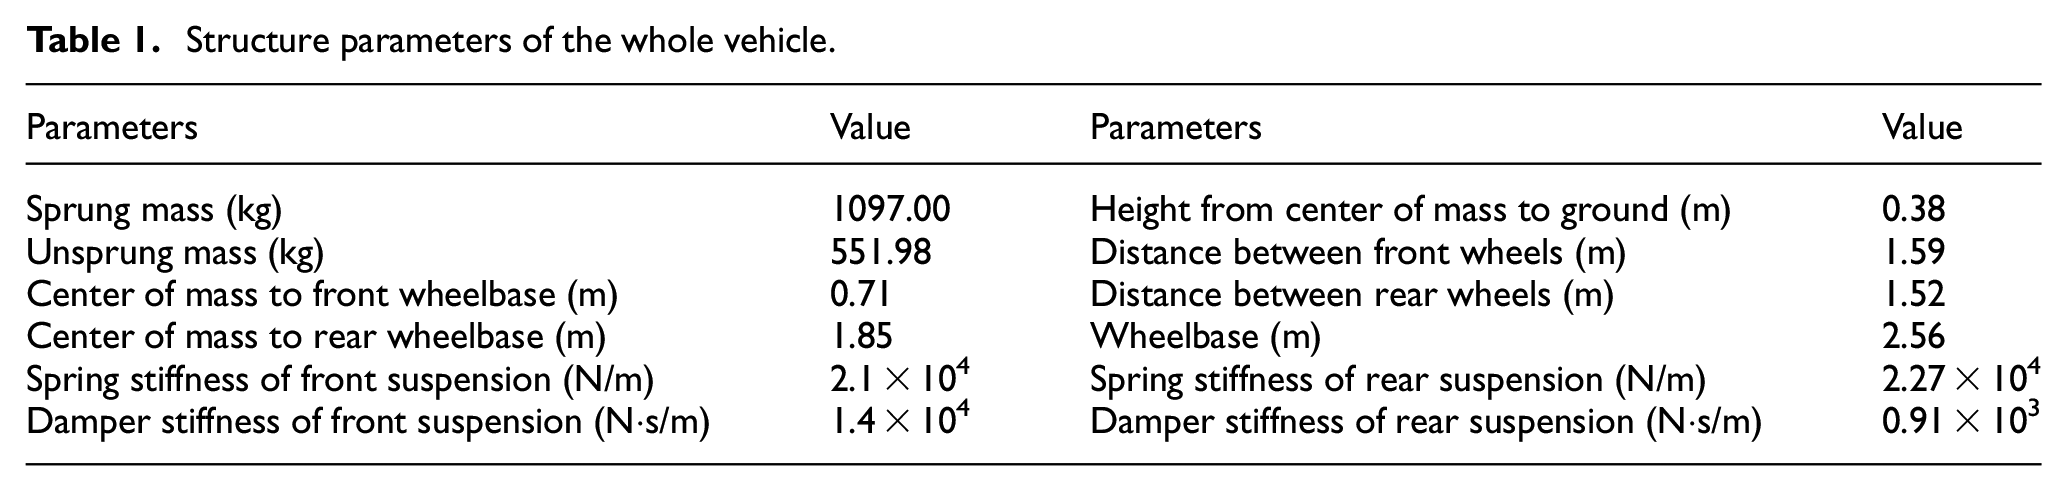
Based on the vehicle three-dimensional model test data and reference to a real vehicle parameter to establish the vehicle rigid-flexible coupling multi-body dynamics model of the front MacPherson and rear torsion beam suspension, as shown in Figure 2. The main structural design parameters of the established vehicle model are shown in Table 1.

The whole vehicle multi-body dynamics model.
Structure parameters of the whole vehicle.
Based on the virtual simulation environment, road unevenness is often derived by inverse derivation of the road unevenness power spectrum density. Depending on the road power spectrum density, road unevenness is segmented into different road levers. There are various methods to generate the frequency domain model of road unevenness, such as: filtered white noise method, harmonic superposition method, Poisson method, Fourier inverse variation method, etc. 15
Therefore, when performing ride comfort simulation, the corresponding road model file should be created first. In this paper, it uses the more commonly used harmonic superposition method to generate a frequency domain model of the road spectrum. The basic idea is to represent the road unevenness function as a sum of a number of sinusoidal functions with random phases.
Based on the harmonic superposition method, the subject gets the required 3D road unevenness characteristics by matlab programing simulation, and then generates pavement files according to the road model criteria, and then imports it into the professional dynamic software, so as to construct and get the bump road. 16
Referring to the relevant provisions of the national standard GB/T 4970-2009,17,18 for the pulse input in the ride comfort analysis process, the bump road should be used. The corresponding values of length, width and height are taken differently for different types of vehicles. Since the object of this paper is a passenger car, the length, width and height of the bumps established according to the regulations are 100 mm × 25 mm × 60 mm. The simulation model of the bump road built in ADAMS is shown in Figure 3.

Bump road.
Effect of different vehicle speeds on ride comfort on bump road
The test evaluation vehicle speed is 30–60 km/h, and the ride comfort simulation is carried out on the bump road surface respectively, and the simulated results of the filtered of the vertical acceleration of the foot floor and seat rail of the front and rear, dynamic load of front and rear wheels and suspension dynamic deflection of front and rear suspension in time domain response are obtained in Figures 4 and 5. For the purpose of exploring the frequency domain characteristics of the vehicle, the time domain system response is transformed into the power spectral density corresponding to the frequency domain system response after Fourier variation and then filtering in Figures 6 and 7.

Time domain response of the front suspension after filtering: (a) vertical acceleration of the front foot floor, (b) vertical acceleration of the front seat rail, (c) dynamic load of the front wheel, and (d) suspension dynamic deflection of the front suspension.

Time domain response of the rear suspension after filtering: (a) vertical acceleration of the rear foot floor, (b) vertical acceleration of the rear seat rail, (c) dynamic load of the rear wheel, and (d) suspension dynamic deflection of the rear suspension.

Frequency domain response after filtering of the front suspension: (a) power spectral density of the vertical acceleration of the front foot floor, (b) power spectral density of the vertical acceleration of the front seat rail, (c) power spectral density of the dynamic load of the front wheel, and (d) power spectral density of the suspension dynamic deflection of the front suspension.

Frequency domain response after filtering of the rear suspension: (a) power spectral density of the vertical acceleration of the rear foot floor, (b) power spectral density of the vertical acceleration of the rear seat rail, (c) power spectral density of the dynamic load of the rear wheel, and (d) power spectral density of the suspension dynamic deflection of the rear suspension.
From Figures 4(a) to (d) and 5(a) to (d), it can be seen that the amplitude of each response quantity of the front or rear suspension system on the bump road tends to increase in general with the increase of the vehicle speed compared to the previous speed. It means that the increase of vehicle speed will increase the amplitude of the bump road excitation, the stronger the system vibration, which is not conducive to the vehicle ride comfort. The amount of system response is affected to some extent for both the front and rear suspensions, but does not change the time domain distribution. Another comparison shows that the rear suspension is subjected to a slightly larger amplitude of vibration than the front suspension.
From Figures 6(a) to (d) and 7(a) to (d), it can be seen that the power spectral density of each response quantity of the front and rear suspension system on the bump road has a rising trend in the overall amplitude change with the increase of the vehicle speed, indicating that the increase in vehicle speed will increase the amplitude of the bump road excitation, and the stronger the system vibration is, which is not conducive to the vehicle ride comfort. It is known that the power spectral density vibration of each response quantity of the front or rear suspension system basically corresponds to the time domain diagram, and the frequency domain distribution does not change with the vehicle speed increase.
Moreover, it is known that the rear suspension is subjected to a slightly larger amplitude of vibration than the front suspension. And the physical meaning of the power spectrum density is the energy conversion per unit of time, which can be obtained in the rear foot floor and seat rail, dynamic load of the rear wheel and the working space of rear suspension, the body to overcome the energy required for vibration than the front suspension on some large.
Effect of spring and damper parameters on time and frequency domain response
From actual engineering design experience, take the rear sus-pension as an example, so that the spring stiffness or damper damping is reduced to one-half or increased to two times of the original value, other parameter values remain unchanged.
The vehicle is driven at a constant speed of 30 km/h on a bump road, and the simulation of the vehicle vibration system is performed to obtain a comparison of the time domain and frequency domain charts of the system response quantities under the variation of spring stiffness and damper damping values. Due to the limitation of space, only the time domain variation of the vertical acceleration of the rear seat rail is presented in Figures 8 and 9 (The initial values are noted as Baseline in the figure in order to distinguish the different parameter values.).
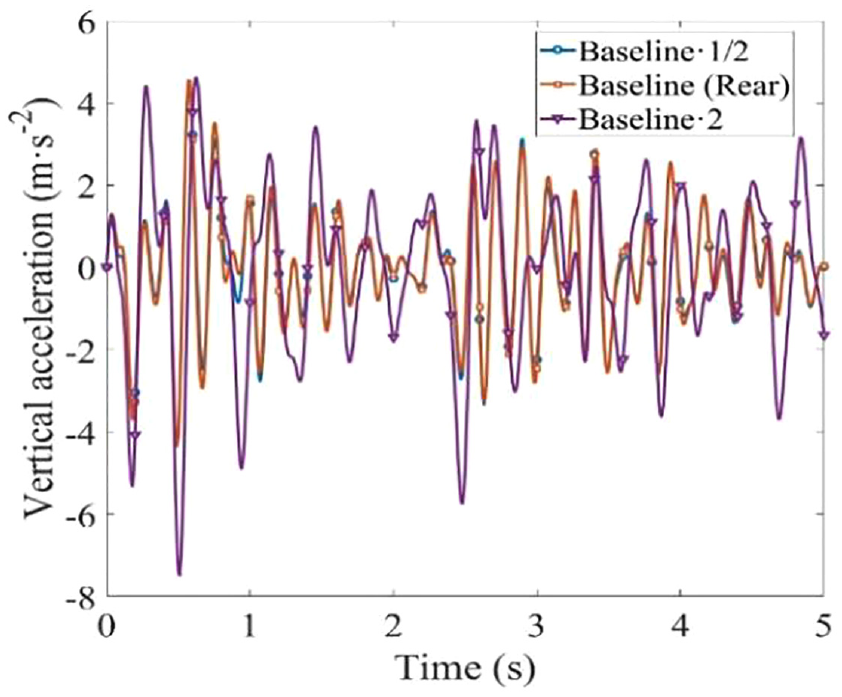
Time domain variation of vertical acceleration of the rear seat rail under the change of spring stiffness.

Time domain variation of vertical acceleration of the rear seat rail under the change of damper damping.
From the results in the time and frequency domains, it can be seen that when the spring stiffness is increased to twice the original value, the amplitude of each response quantity of the system has increased to some extent compared to the original value, especially the magnitude of the vertical acceleration of the foot floor and seat rail of the front and rear, the suspension dynamic deflection of the front and rear suspension, and the dynamic load of the rear suspension increases more, and dynamic load of the front wheel increases slightly. When the spring stiffness is reduced to one-half of the original value, and the response of the system is reduced to some extent compared to the original value, but the magnitude of the reduction is small. For the frequency domain results, the power spectral density vibration of each response quantity of the front or rear suspension system basically corresponds to the time domain response variation.
When the damper damping is increased to twice the original value, the amplitude of the system response is reduced to a certain extent compared to the original value, especially the vertical acceleration of the foot floor and seat rail of the front and rear, and the dynamic load of the rear wheel. The suspension dynamic deflection of the front and rear suspension is also reduced to a certain extent, but the magnitude of the reduction is slightly smaller. The dynamic load on the front wheel is almost unchanged and the magnitude of the original value is almost the same. When the damper damping is reduced to one-half times of the original value, the change of each response quantity of the system from the original value is the opposite. For the frequency domain results, the power spectral density vibration of each response quantity of the front or rear suspension system basically corresponds to the time domain variation.
Therefore, the variation of suspension spring stiffness and damper damping will have an impact on the time and frequency domain response indicators of the car, thus affecting the vehicle ride comfort, which is coincide with the theoretical analysis in Section 3 above.
The above analysis shows that:
1) In a certain range of stiffness, the appropriate reduction of spring stiffness in a certain degree to reduce the amplitude of fluctuations in the partial response of the system, such as vertical acceleration of the front and rear foot floor and seat rail, suspension dynamic deflection. While the tire dynamic load increases slightly, the overall system vibration intensity is reduced. Therefore, the spring stiffness is reduced within a certain range to improve the vehicle ride comfort.
2) In a certain range of stiffness, the appropriate reduction of damper damping in a certain degree to reduce the amplitude of fluctuations in the partial response of the system, such as vertical acceleration of the front and rear foot floor and seat rail, suspension dynamic deflection of the front and rear suspension, dynamic load of the rear wheel. Therefore, the damper damping is increased within a certain range to improve the vehicle ride comfort.
Analysis of the vehicle ride comfort on bump road
In this paper, transient vibrations are considered by using the continuous
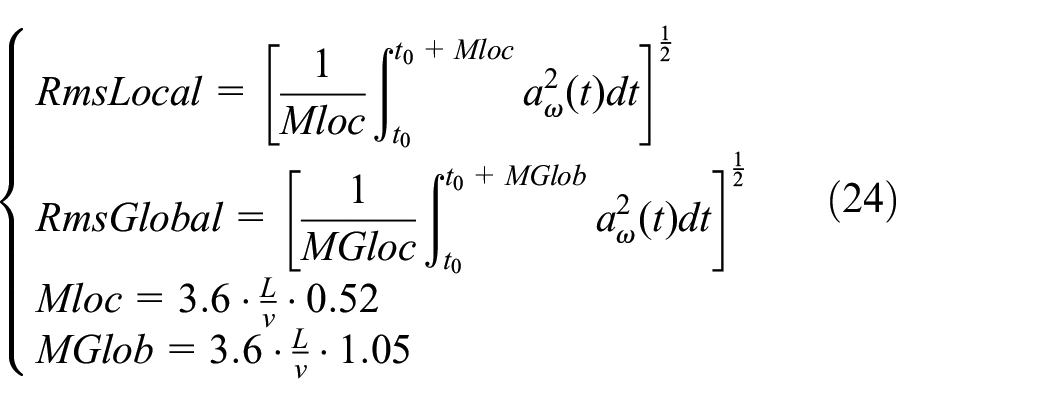
In equation (24),
Figure 10 displays the time domain signal charts of the vertical acceleration of the foot floor and seat rail of the front and rear when the vehicle passes the bump road at a speed of 30 km/h. In other words, the change chart of local vibration

Variation charts of local vibration and global vibration: (a) vertical direction of the front foot floor, (b) vertical direction of the front seat rail, (c) vertical direction of the rear foot floor, and (d) vertical direction of the rear seat rail.
It is clear from the figure that both the curves of both local vibration
The value of
Optimized matching
Determination of optimization variables and objective function
The suspension springs and dampers play the role of shock mitigation and vibration suppression respectively during the driving process of the vehicle. 19 Based on the fact that the above two types of components play a decisive role on ride comfort, the spring stiffness and damper damping of the suspension are used as optimization variables.
To facilitate the simulation calculation, the spring stiffness and damper damping are multiplied by a scale factor to change the size respectively, and the design variables are in Table 2.
Optimization of design variables.

Optimization objectives include the
Then the total optimization objective can be expressed as follows:

The constraints are as follows:

In equation (26),
Optimization algorithm and optimization results
In this paper, the multi-objective optimization algorithm PE’s HMGP sub-algorithm is used for the multi-objective collaborative optimization of spring stiffness and damper damping of the front and rear suspensions. 20 The whole vehicle model is driven at a uniform speed of 30 km/h on a bump road, and the Pareto solution set based on ride comfort obtained through iterative optimization calculations after building an integrated platform. Then all the solutions in the Pareto solution set are compared, and the optimal solution set is selected by coordinating trade-off and compromises among the objectives to make each subobjective as optimal as possible. 21
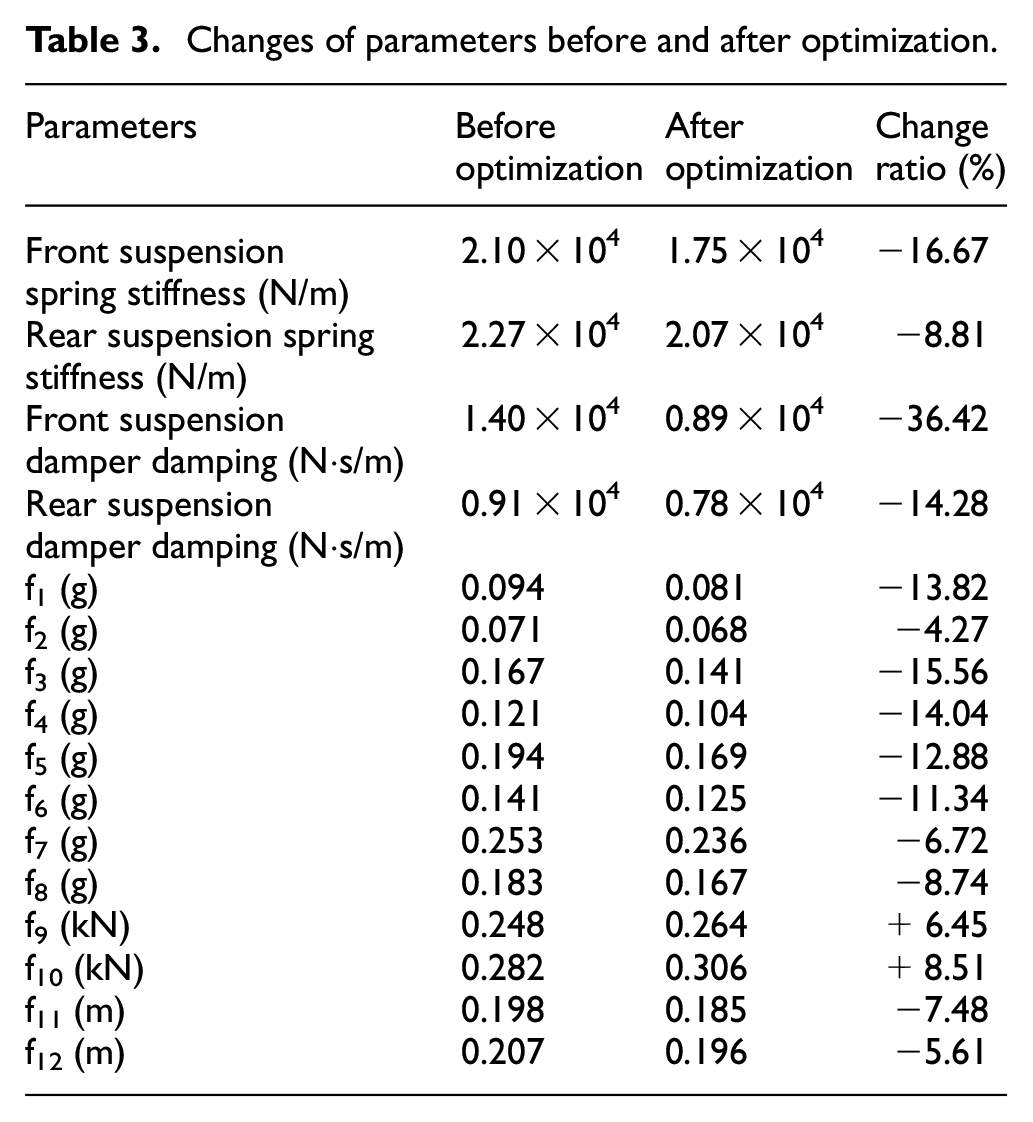
Only some of the Pareto solution sets of the optimization objective in the optimization space are listed due to the length of the article, as shown in Figures 11 and 12. The blue dots in the Pareto illustration set are the Pareto front solutions. The changes of parameters before and after optimization are shown in Table 3. From the results in Table 3, it can be seen that the evaluation indexes of ride comfort have been effectively improved after optimization, then the vehicle ride comfort has been improved.
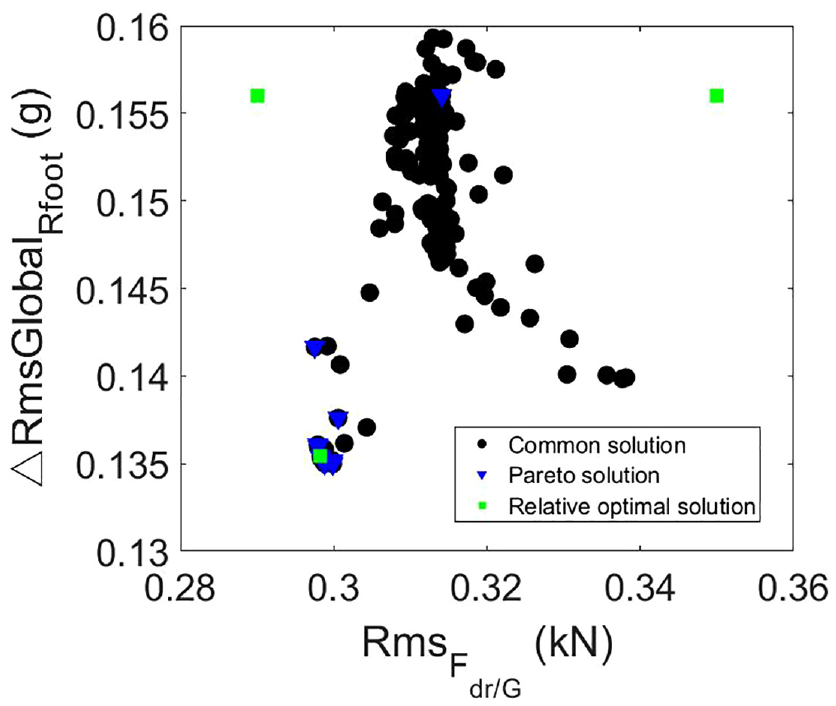
Pareto solution set of the

Pareto solution set of the
Changes of parameters before and after optimization.
Conclusion
In this paper, the vehicle suspension parameters of the whole vehicle rigid-flexible coupling model with front double wishbone and rear torsion beam suspension are analyzed and matched to improve the vehicle ride comfort on bump road. The main conclusions are as follows:
1) The amplitude of the time domain response and the power spectral density of the frequency domain response of the front or rear suspension on the bumpy road surface both tend to increase in general with the increase of the vehicle speed compared to the previous speed. The amplitude change of the time domain response and the power spectrum change of the frequency domain response are more obvious, but with the increase in speed does not change the time domain and frequency domain distribution, and the rear suspension is subject to slightly larger vibration than the front suspension.
2) The difference in spring stiffness and damper damping will have an effect on suspension stiffness and suspension damping, which in turn will affect the transfer function and thus the frequency response function matrix, ultimately affecting the vehicle ride comfort. Moreover, within a certain range, the appropriate reduction of spring stiffness and increase in damper damping is conducive to reducing the fluctuation of the partial response of the vibration system, thus helping to improve the vehicle ride comfort. And the parameter change does not change the time and frequency domain distribution of the front or rear suspension response.
3) On a bump road, the value of
4) Genetic algorithm is used to optimize the matching of spring stiffness and damper damping of front and rear on a bump road with a driving speed of 30 km/h, as shown by the optimization results: The
Footnotes
Acknowledgements
The authors are greatly appreciated for the financial support.
Handling Editor: Chenhui Liang
Declaration of conflicting interests
The author(s) declared no potential conflicts of interest with respect to the research, authorship, and/or publication of this article.
Funding
The author(s) disclosed receipt of the following financial support for the research, authorship, and/or publication of this article: This project was supported by National Natural Science Foundation of China (NSFC) (No. 51965026).