
Abstract
A design method for suspension parameters is proposed to ensure the desired performance of a railway vehicle despite uncertainties. The method used in this study consists of two loops: a sub-loop, which uses parameter uncertainties to determine the minimum value of target performance, and a main loop, which optimises suspension parameters such that the minimal performance achieves Pareto optimality. Thus, by selecting a suitable Pareto solution that ensures the minimum performance is equal to or higher than the required performance, the robustness of the designed vehicle against the parameter uncertainties can be achieved. The lowest low-frequency damping ratio in the service speed range was selected as one of the design targets. The other target was the critical speed. Two wheel-rail contact characteristics were applied, considering the worst conditions for each design target. The distribution of the parameter uncertainties that minimised the vehicle performance showed distinct characteristics between the longitudinal and lateral suspension parameters, which provides useful information for the maintenance of railway vehicles. The performance analysis for 100,000 random samples shows that the vehicle performed better than the targets with a high probability despite the parameter uncertainties. Further, the simulation results using multi-body dynamics simulation software validated the viability of the proposed method.
Introduction
In railway vehicles, suspension systems significantly affect running performance, such as stability, safety and ride comfort. As a result, suspension design becomes more important in high-speed railway vehicles to maintain high safety standards and quality service even at high speeds. Furthermore, the related performances of railway vehicles often conflict, deriving an adequate balance between them is crucial.
Optimisation techniques effectively solve problems with multiple input variables and one or several output variables. As a result, studies have been conducted on the use of optimisation in the design of suspension parameters of railway vehicles. He and McPhee 1 introduced a two-loop method using a genetic algorithm and sequential quadratic programming to optimise the lateral stability of railway vehicles. In addition, they proposed a method for multibody systems using a hybrid multidisciplinary optimisation method and reported the trade-off relationship between lateral stability and curving performance. 2 Johnsson et al. 3 introduced the Pareto optimisation method to enhance the safety and comfort of high-speed railway vehicles. The objective functions of safety and comfort were calculated from the response of a three-car model for lateral track irregularities and revealed a trade-off between safety and comfort based on the suspension parameters. The sensitivity of the optimal solution was also investigated for train speed, worn wheel profile, load and friction coefficients. It was found that speed and wornness significantly influenced safety and comfort. They further expanded their research to include the rate of wear of the wheel and rail and suggested some adaptive control strategies based on the optimisation results for the vehicle speed. 4 Mousavi Bideleh et al. 5 presented a multistep method for improving the computational efficiency of Pareto optimisation. Five scenarios with different track radii and vehicle speeds were applied to calculate the objective functions, and the advantages and disadvantages of the asymmetric suspension system were reported. Yao et al. 6 proposed optimal suspension parameters for hunting stability robustness, defined as five indices (linear stability indices for three vehicle speeds, standard deviations for suspension parameters and equivalent conicity). The K-Means clustering method was adopted to categorise Pareto fronts into six groups to meet the multiple objectives and matching rules for key suspension properties were suggested upon analysing each group characteristics. Chen et al. 7 suggested a multi-objective optimisation of high-speed train suspension parameters for hunting stability. The multi-objective function comprised stability indices for low and high wheel-rail contact conicity, and the robustness index defined as the standard deviation of the stability indices with the equivalent conicity distributed in 0.05–0.3. They also investigated the stability and wear Pareto optimisation of suspension parameters for a high-speed passenger train. 8 Stability indices were defined as the lateral ride comfort at low equivalent conicity and the bogie frame acceleration at high conicity. The contact spreading index and wear number were proposed for wheel wear performance. Li et al. 9 studied suspension parameter matching of high-speed locomotives for stability and comfort Pareto optimisation. They proposed three types of parameter combinations and investigated the performance characteristics for the vehicle speed and rail cant variation. Recently, to solve conflicting problems in vehicle performance, optimal suspension design methods with variable passive dampers such as the frequency-dependent yaw damper, have been introduced.10,11 In addition, active suspension systems12–14 have been developed for decades to improve vehicle performance under various environments. However, only a few systems were commercialised for railway vehicles.
Most components used in suspension systems differ from the designed values due to manufacturing tolerances, service periods and external environments. Uncertainties in design parameters can cause deviations in the optimal performance, and furthermore, in severe cases, make original optimal performance unsatisfactory to their requirements or constraints. Hence, the robustness of the optimal design against uncertainties in design parameters is important, but a related study has rarely been introduced. The robustness can be secured in two main ways. The first method is evaluating the robustness of the optimal results using sensitivity analysis after the design process is complete. Mousavi Bideleh 15 investigated the robustness of Pareto optimal values for the uncertainty of suspension parameters modelled as a lognormal distribution. The maximum entropy and M-DRM concept improved the computational efficiency with fairly appropriate accuracy. Gao et al. 16 proposed the Hermit orthogonal polynomial expansion method to analyse the sensitivity of the critical speed with uncertain parameters. Zhou et al. 17 carried out the global sensitivity analysis of the stochastic response of the railway vehicle with uncertain parameters based on the polynomial chaos expansion method and Sobol indices. Park 18 investigated the influence of the tolerance of suspension parameters on the optimal performance through parametric studies based on yaw and lateral stiffness and damping of the bogie frame. The disadvantage of the first method is that it requires large-scale additional computational work after the optimisation is completed. In addition, if the optimised parameters cannot meet the desired robustness, the optimisation or robustness evaluation should be repeated by changing their constraint conditions. Simple methods,19,20 ignoring the interaction between suspension parameters and changing only one parameter at a time, can be applied with a low computational cost; however, they are less quantitatively accurate in evaluating the robustness. The other method is to apply robustness indicators to the objective functions of the optimisation process. It has the advantage that no additional work is required to evaluate the robustness. However, few studies have been conducted, and they have disadvantages. Martowicz et al. 21 proposed a response surface method to describe the relationship between the target performance and an uncertain parameter. Many simulations to acquire the surrogate model should precede before the optimal design. Standard deviation6,7 of target performance for parameter uncertainties needs the distribution model of parameter uncertainties, and the modelling accuracy for uncertainty distribution affects the optimisation results. Thus, a design method that is more computationally efficient and always ensures the robustness for parameter uncertainties is required.
This study proposes a new design method, considering the uncertainty of suspension parameters. The proposed method requires no additional work and modelling or assumptions regarding the distribution of parameter uncertainties apart from the range of uncertainties. It consists of a sub-loop to find the minimal performance as the parameter uncertainties vary and a main loop to optimise the suspension parameters until the minimal performance reaches Pareto optimality, that is a condition of optimal trade-off among conflicting performance indicators. Thus, the railway vehicle always performs better than required, despite the parameter uncertainty, if the proper suspension parameters can be selected among the Pareto solutions.
The validity of the proposed method was verified through the design process and the results of suspension parameters for two target performances of a linearised high-speed railway vehicle model. The distribution of parameter uncertainties that minimises vehicle performance was examined using Pareto solutions. The Pareto set that satisfied the minimum required performance of the railway vehicle was chosen as the final optimal suspension parameters, and for 100,000 random samples assumed as their uncertainties, the variation characteristics of the vehicle performances were investigated. Finally, the performances of the reference vehicle model and the designed vehicle model were compared through simulation results using multi-body dynamics simulation software.
Design procedure
Linearised vehicle model
A 17-degrees-of-freedom railway vehicle model was used to design the suspension parameters and analyse the vehicle characteristics. This model was established in a previous study18,22 and was slightly modified in the current study: the parameter of primary suspension was separated into a rod bush (


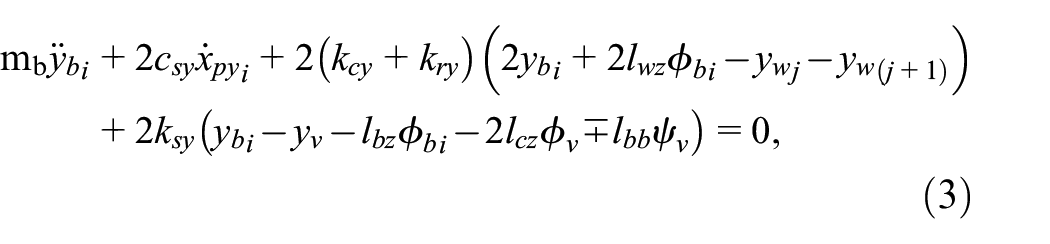


for equations (1) and (2):
Here,
High-speed rail way vehicle model: (a) rear view and (b) top view.
Equations (9) and (10) are the dynamic equations of yaw and lateral dampers. The yaw damper model only acts against the relative yaw motion between the carbody and bogie frames, whereas the lateral damper model affects the lateral, roll and yaw motion between the carbody and bogie frames. The other main parameters are listed in the Appendix.
Design variables, objective functions and design process
The low-frequency damping ratio, closely related to ride comfort, and the critical speed, a measure of hunting stability, were chosen as the objective functions. The goal is to maximise their lowest values, determined by the uncertainty of suspension parameters. The design variables were composed of the longitudinal and lateral stiffness of the rod bush, series stiffness and damping coefficient of the lateral and yaw dampers, respectively. Equations (11) and (12) express the design variables and boundary conditions, respectively.


Assuming that the uncertainty range of each suspension parameter is the maximum allowable tolerance of the rubber components and hydraulic dampers for railway vehicle suspensions specified by European norms,24,25 it can be expressed as:


where
The low-frequency damping ratio and critical speed can be calculated from the eigenvalue analysis of the linearised vehicle model. The state-space equation of the vehicle model, expressed as equations (1)–(10), can be written as:


where


The eigenvalues and eigenvectors of the yaw and lateral dampers were calculated along with those of the other variables; however, they were ignored in the eigenmodes of the vehicle. Thus, the linearised vehicle model has 17 eigenmodes; the modes with

As the

where
In this study, the critical speed
where
Wheel/rail contact parameters of the linearised vehicle model.

Figure 2 presents the schematic of the proposed design method. As shown in Figure 2(a), the workflow comprises the main loop that optimises the suspension parameter

Schematic of the proposed design method: (a) workflow and (b) optimisation algorithm.
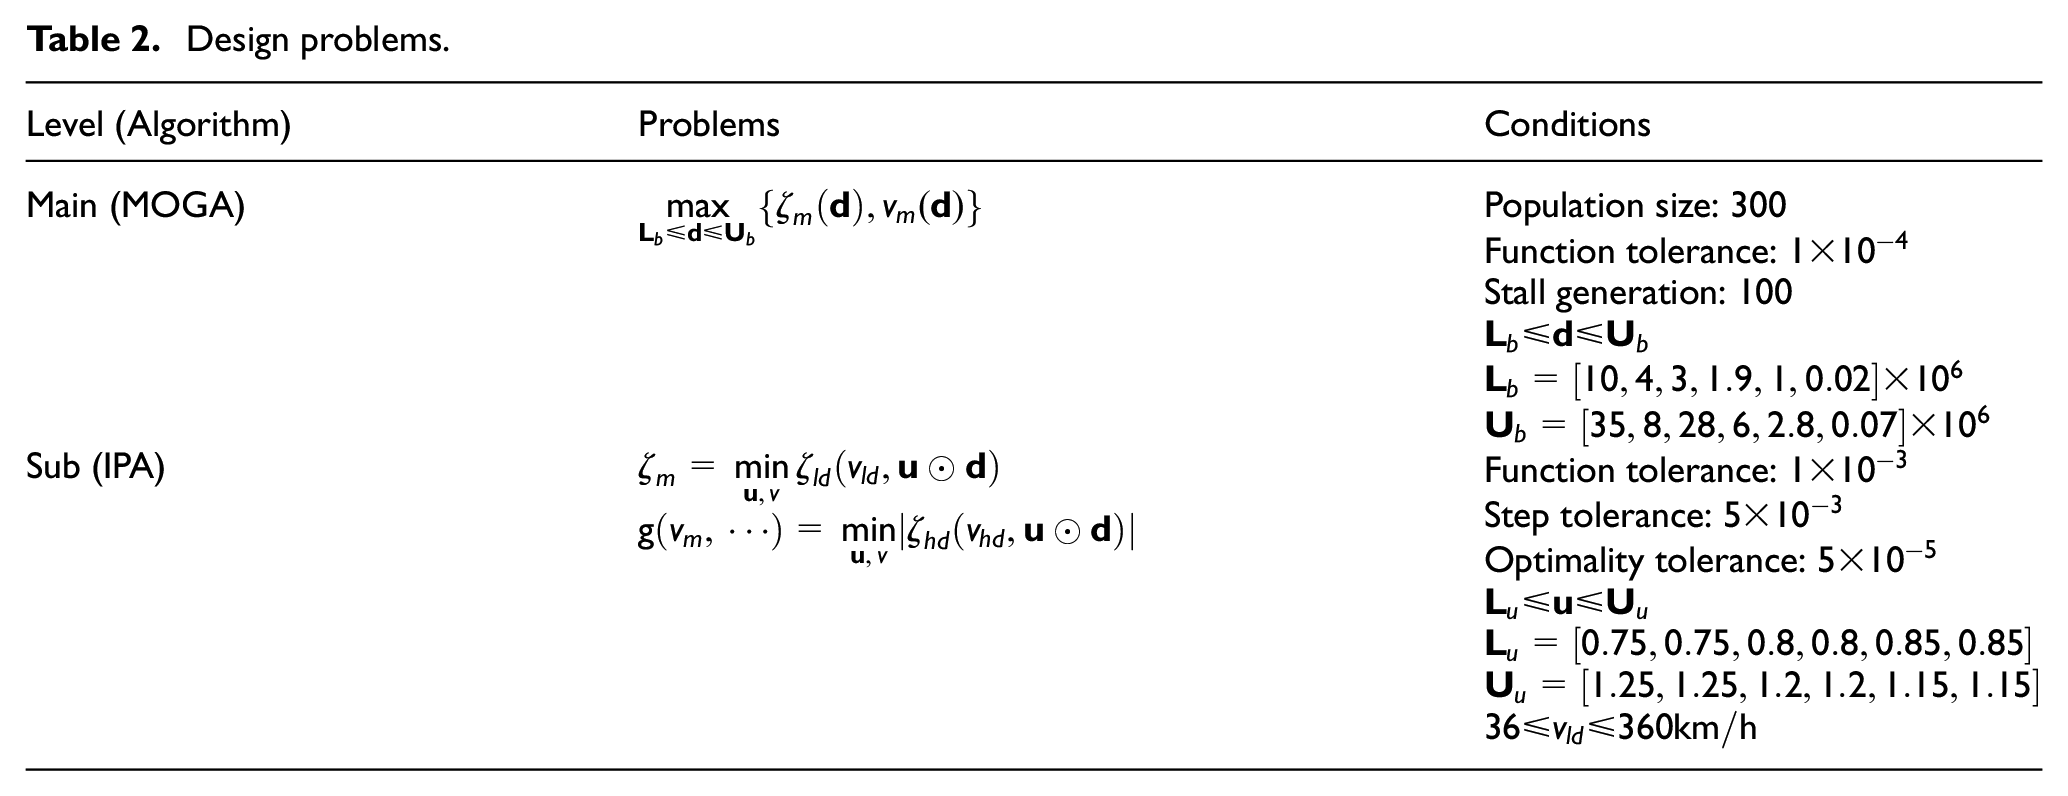
Design problems.
Design results
Figure 3 shows the Pareto solutions obtained using the proposed method. Because the objective functions are defined by equations (22) and (23), the Pareto fronts, indicated by blue circles in Figure 3(a), show minimal performances owing to the parameter uncertainties; however, they were maximised as much as possible without degrading each other by MOGA of the outer-loop. Red squares represent the nominal performances when the optimised suspension parameters without parameter uncertainties are applied, which were acquired from additional calculations when the optimisation process was completed. Because the minimum required performance was determined to be over 10% for the lowest

Design results: (a) Pareto fronts (blue circles), nominal performances (red squares) and minimum required performance (dashed line), and Pareto set for (b)
Figure 4(a) displays

Damping ratio and modal frequency of the high-speed vehicle model: (a) low-frequency and (b) high-frequency damping ratio under W1 condition, (c) low-frequency and (d) high-frequency damping ratio under W2 condition.
Since each of the 105 Pareto fronts represents the minimised performance by the parameter uncertainties although optimised by MOGA, it is possible to consider the corresponding

Histogram of suspension uncertainty minimising the vehicle performances: (a)
Validation
Variation of vehicle performances for arbitrary parameter uncertainties
Investigating the performance distribution for arbitrary parameter uncertainties to evaluate the validity of the design results is necessary, as the proposed method only considers the minimised performance of the vehicle. This study used 100,000 sets of normalised random uncertainties, modelled to be uniformly distributed between

Distribution of vehicle performances for uniformly random uncertainties in suspension parameters: (a) the lowest
Consequently, in most arbitrary uncertainties, the two target performances of the vehicle model are higher than the minimum required, and the probability that they are lower than the minimum required is zero and equal to the minimum required is extremely low. It implies that the proposed method worked well as expected, and the minimum performance of the vehicle model is always secured regardless of the uncertainties of suspension parameters.
Simulation
As the suspension parameters were designed using a linearised vehicle model, several simulations were performed with VI-Rail – a commercial software for simulating the railway vehicle dynamics of VI-grade GmbH©, to estimate the validity of the achieved performances. The vehicle model in VI-Rail had nonlinear characteristics such as nonlinear damping coefficient, nonlinear secondary air spring and nonlinear wheel/rail contact. The critical speed was evaluated for the MO, MN and MC. In combination with the 60E1 rail, a wheel profile that satisfied the W2 condition was used. Figure 7(a) and (b) display the high-speed railway vehicle modelled in VI-Rail and the equivalent conicities of the wheel-rail profiles applied to satisfy conditions W1 and W2. Figure 7(c) to (e) show the lateral displacements of the leading wheelset of each vehicle model for the ramped track irregularity in the lateral direction. There is good agreement with the predicted values from the linearised vehicle model (Figure 4(d)), which implies that the combination of wheel-rail profiles used in VI-Rail has the characteristic of supercritical Hopf bifurcation. 31

Simulation results for critical speed: (a) vehicle model in the VI-Rail, (b) equivalent conicities of applied wheel profiles with 60E1 rail, (c) MO, (d) MN and (e) MC.
The ride comfort was estimated for the MO, MN and MD. When the vehicle models travelled on a tangent track of 10 km with ERRI low rail irregularities, the accelerations were measured at the front, centre and rear positions of the carbody floor. The front and rear positions were on the centre of two bogies. In this simulation, the wheel profile for the W1 condition was applied to the vehicle models. Figure 8(a) shows the measured lateral accelerations at the front and rear positions in the MN and MD with a vehicle speed of 350 km/h, and Figure 8(b) to (d) show the estimated ride comforts for each model in accordance with EN 12299.
32
NMV indicates the mean comfort of the test track section; the smaller the value, the better the ride quality. As shown in Figure 8(b), in the MO, the differences between the indices of the front and rear positions are quite large because of the coupled mode of the bogies and the carbody. The ride comfort improved as the vehicle speed increased, which is consistent with the curve shape of

Simulation results for ride comfort: (a) lateral accelerations of the carbody floor for MN (top) and MD (bottom), and ride comforts for (b) MO, (c) MN and (d) MD, respectively.
Conclusions
Uncertainties in the parameters of the suspension elements widely used in railway vehicles, such as rubber bushes and hydraulic dampers, are often caused by the manufacturing process, service period and the environment. Therefore, designing suspension parameters such that the railway vehicle satisfies the minimum required performance despite their variations owing to uncertainty is necessary. Satisfying this requirement is guaranteed when the performance minimised by the uncertainty is equal to or higher than the minimum required performance. Hence, a design method for suspension parameters securing the minimum required performance of a railway vehicle despite the uncertainty is proposed. This method comprises two loops: the sub-loop finds the performances of the railway vehicle minimised by the parameter uncertainties, and the main loop seeks solutions where those minimum performances reach Pareto optimality. The proposed method also requires no information for parameter uncertainties apart from their range.
The low-frequency damping ratio in the low equivalent conicity condition and critical speed in the high equivalent conicity condition, which are dynamic characteristics representing the ride comfort and running stability of a railway vehicle, were selected as design targets. Since the damping ratio changes according to the vehicle speed and suspension parameters, the lowest low-frequency damping ratio in the service speed range was used instead of the damping ratios at certain specified vehicle speeds. Consequently, the overall low-frequency damping ratio in the service speed range could be improved.
The distribution of the parameter uncertainties acquired from the Pareto set suggests that the longitudinal suspension elements whose parameters significantly deviate from their nominal values in both directions and the lateral suspension elements whose parameters excessively change in the decreasing direction be devoted particular attention within the scope of maintenance.
A performance analysis using 100,000 random samples further verified the viability of the proposed method. The designed vehicle performed better than the minimum required performance in most parameter uncertainties, and the probability of being less than the minimum required was zero, indicating that the proposed method worked well as expected.
Because of the otherwise excessive computational cost of the proposed design method, a linearised vehicle model and its dynamic behaviour in the frequency domain were used for optimisation of suspension design, although they could only represent some characteristics of a railway vehicle. However, the simulation results for the target performance of this study using the railway vehicle dynamics software VI-Rail demonstrate the validity of the proposed method and the linearised vehicle model. The result for
Notably, the quantitative design results are limited to the vehicle model used in this study. However, the proposed design procedure can be applied to designing suspension parameters for almost all railway vehicles with appropriate objective functions calculated from various methods. It can also be extended to robust design of suspension parameters for other uncertainties, such as changes in wheel-rail contact characteristics due to wear or changes in vehicle mass and moment of inertia due to passenger/cargo weight, by simply adding uncertain parameters and their normalised ranges to the sub-loop.
In future studies, the actual range of suspension parameter uncertainties will be investigated from a number of high-speed railway vehicles in operation. Also, shapes of their wheels will be measured to determine the actual uncertainty range of wheel-rail contact parameters. Then, the suspension parameters will be re-designed with their actual uncertainty ranges and actual uncertainty range of wheel-rail contact parameters. Finally, the vehicle performance will be compared with this study.
Footnotes
Appendix
Main parameters of the reference model

| Symbol | Definition | Value |
|---|---|---|
| Wheelset mass | 2186 kg | |
| Yaw inertia of wheelset | 1321 kg m2 | |
| Pitch inertia of wheelset | 148 kg m2 | |
| Bogie frame mass | 3911 kg | |
| Yaw inertia of bogie frame | 4720 kg m2 | |
| Roll inertia of bogie frame | 3509 kg m2 | |
| Carbody mass | 39,646 kg | |
| Yaw inertia of carbody | 1,841,330 kg m2 | |
| Roll inertia of carbody | 95,250 kg m2 | |
| Longitudinal stiffness of rod bush | 3.36 × 10⁷ N/m | |
| Lateral stiffness of rod bush | 4.0 × 10⁶ N/m | |
| Longitudinal stiffness of coil spring | 1.764 × 10⁵ N/m | |
| Lateral stiffness of coil spring | 1.764 × 10⁵ N/m | |
| Vertical stiffness of coil spring | 5.291 × 10⁵ N/m | |
| Series stiffness of yaw damper | 1.31 × 10⁷ N/m | |
| Series stiffness of lateral damper | 4.0 × 10⁶ N/m | |
| Longitudinal stiffness of air spring | 1.457 × 10⁵ N/m | |
| Lateral stiffness of air spring | 1.457 × 10⁵ N/m | |
| Vertical stiffness of air spring | 2.158 × 10⁵ N/m | |
| Damping coefficient of yaw damper | 1.387 × 10⁶ N s/m | |
| Damping coefficient of lateral damper | 4.0 × 10⁴ N s/m | |
| Damping coefficient of secondary vertical damper | 4.5 × 10⁴ N s/m | |
| Wheel base in a bogie | 2.6 m | |
| Distance between bogie centers in a carbody | 17.5 m |
Handling Editor: Sharmili Pandian
Declaration of conflicting interests
The author declared no potential conflicts of interest with respect to the research, authorship, and/or publication of this article.
Funding
The author disclosed receipt of the following financial support for the research, authorship, and/or publication of this article: This study was supported by a grant from the R&D Programme of the Ministry of Land, Infrastructure, and Transport (Grant No. RS-2022-0014-3396), Republic of Korea.