
Abstract
The existence of tire slip angle and camber angle causes that the test results of conventional rolling resistance tester are often very different from the measured results installed on the vehicle. In addition, the test cost of rolling resistance tester with sideslip and roll is high. To solve the above problems, the effects of cornering characteristics on rolling resistance of complex tread tires were analyzed by finite element method (FEM). The numerical simulation model of a tire with complex tread patterns was established, and the reliability of the established numerical simulation model was verified by the experiments. The response relationships between tire lateral force, sideslip angle, camber angle and rolling resistance under multiple pure sideslip conditions and combined conditions were compared and analyzed, as well as the contribution rate of each tire component to rolling resistance under the corresponding conditions. The obtained research results can provide support for vehicle chassis adjustment and energy saving and consumption reduction in tire structure design.
Introduction
The vehicle will be affected by the air resistance caused by the car body, the internal friction resistance between internal mechanical components, and the rolling resistance of the tires during operation. The tire rolling resistance is mainly the energy loss caused by the elastic hysteresis of the rubber material, accounting for about 20%–30% of the energy consumption of the whole vehicle. It has an important impact on the power consumption of the vehicle, fuel consumption and even the service life of the tire itself.1–3 Therefore, the study of the generation and change mechanism of tire rolling resistance plays an important role in effectively reducing the rolling resistance during vehicle operation and improving the vehicle power and fuel economy.4–6
In the process of vehicle performance adjustment, toe angle, camber angle and other constraints will be imposed on the wheel assembly, which will lead to great differences between the steady-state test results of the conventional tire rolling resistance tester and the test results of the actual loading operation. The conventional six component tire testing machine can be used to test the rolling resistance under compound working conditions, but due to the large range of the sensor, it will produce large measurement errors. The rolling resistance testing machine with sideslip and roll mechanism is expensive and the test cost is high.
The research methods of tire rolling resistance usually include theoretical analysis method and the experimental method.7,8 In recent years, with the development of computer technology, the research methods also show a diversified trend,9–12 of which numerical simulation calculation method is one of them. However, due to the lack of computing power and algorithm development, most scholars have simplified the tire tread patterns in the numerical simulation of rolling resistance, which leads to the poor correlation between the test and numerical simulation results.
Ali et al. 13 used the FEM to analyze the variation law of rolling resistance of glossy tires of heavy trucks under low-speed steering and sideways leaning conditions. Since the influence of tread pattern was not considered, the research results only qualitatively simulated the performance characteristics of tire. Liang et al. 14 studied the response relationship between the rolling resistance and the grip of radial tires using a combination of simulation and experiments, and designed and optimized the tire structure based on the results to improve the rolling resistance performance and grip of the tire. Wang et al. 15 analyzed the influence of the design parameters of tread pattern on rolling resistance by using regression method, and optimized the tire tread pattern to reduce tire rolling resistance by fitting the relationship between design parameters and rolling resistance.
Rafei et al. 16 analyzed the effects of model parameters and material properties on tire rolling resistance using computer simulations, focusing on the differences between linear and nonlinear viscoelastic models on tire rolling resistance performance. Wei and Olatunbosun and Wei et al.17,18 studied the effects of cross-sectional area, spacing, crown angle and strength of reinforcing cord on the slack length of rolling tires by means of an explicit finite element procedure, and the results provided support for the research of the generation mechanism of rolling resistance. Davari et al. 19 investigated tire rolling losses in combination with an extended brush tire model, which considered the effects of driving conditions, wheel alignment parameters, and materials, providing a basis for rolling loss optimization studies. Bazi et al. 20 analyzed the effects of pavement texture, roughness, and deformation on tire rolling resistance by the FEM, quantified the rolling resistance component induced by pavement structure, and provided a basis for the optimization of pavement structures with low rolling resistance. The above studies on tire rolling resistance basically did not consider the influence of tire in sideslip or roll state.
The main objective of this paper is to study the variation trend of rolling resistance of radial tire with complex tread pattern under roll and yaw conditions by using numerical simulation method. The finite element model of the tire with complex tread pattern was established, and the material parameters of the model were determined by uniaxial tensile test. The verified simulation model was used to analyze the rolling resistance performance of the tire under the pure sideslip conditions and combined conditions, and the influence laws of cornering characteristics on tire rolling resistance were revealed, which provides guidance for the performance improvement in the process of vehicle chassis performance adjustment and tire matching.
Finite element modeling of tire
Material parameters determination
Tire rubber materials are viscoelastic and nearly incompressible materials, and the constitutive models commonly used to characterize their characteristics include Neo-Hookean, Mooney-Rivlin and Yeoh.21,22 Since the strain in the grounding area of the tire studied in this paper is less than 25% and the tread grounding area is basically compressive strain, the Neo-Hookean model, which contains only one parameter and is unconditionally stable, was chosen to characterize its material properties. The Neo-Hookean model is applicable to tensile deformation below 40% and shear deformation below 90%, which fully satisfies the analysis situation in this paper. The expression of Neo-Hookean model can be described as follows:

where,
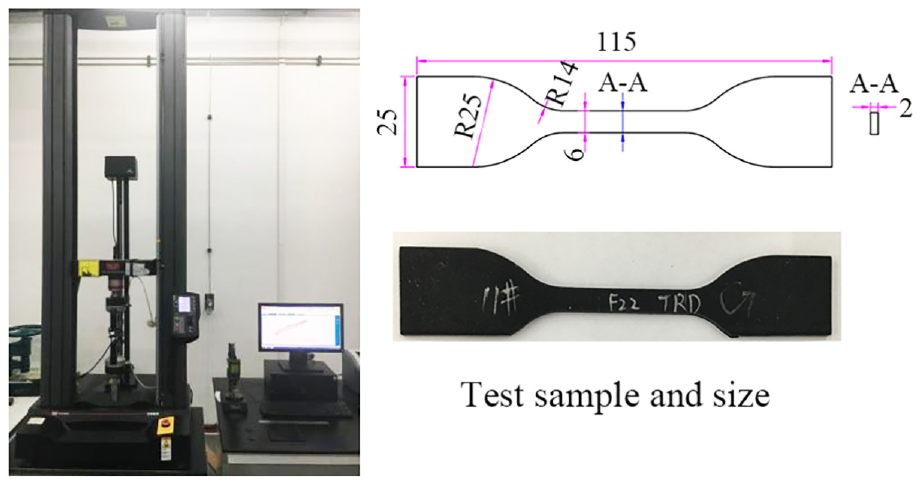
Uniaxial tensile test of rubber compound.
Identification parameters of main rubber components.

Modeling process
According to the two-dimensional structure plan of 205/55R16 tire, as shown in Figure 2, the finite element structure model considering complex tread patterns was established by Abaqus software.25–27 In the process of finite element modeling, a two-dimensional axisymmetric model was established according to the tire contour map and material distribution map, in which the rubber entities adopt the twisted axisymmetric quadrilateral elements CGAX4, and the linear axisymmetric double node skeleton material elements SFMGAX1 sharing the nodes with rubber solid elements were established by skin command. Then, the three-dimensional carcass model was established by rotating 150 parts in the circumferential direction. As for the modeling of tire tread pattern, the middle pitch of tread pattern was selected to establish the three-dimensional solid model of tread block in CATIA, and the meshed pattern model was spliced in ABAQUS. Finally, the binding command was used to bind the pattern with the three-dimensional carcass model to complete the finite element modeling of tire structure. The established three-dimensional finite element model of the tire is shown in Figure 3, including 287,298 nodes, 220,092 rubber solid elements and 72,900 rebar elements.
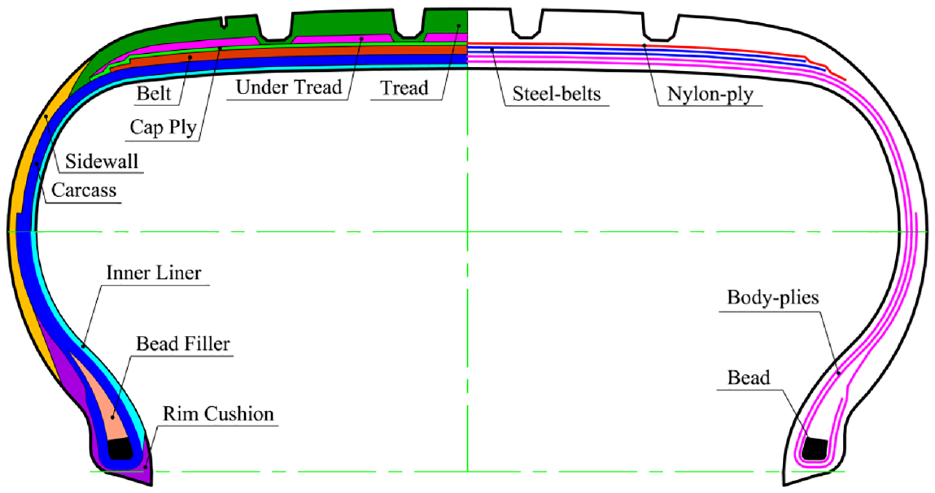
Two-dimensional section of 205/55R16 tire.

Finite element modeling process of tire with complex tread patterns.
Verification of tire finite element model
Experimental verification of cornering characteristics
In order to verify the accuracy and validity of the established finite element model, a 205/55R16 radial tire was taken as the test object, and the cornering characteristics experiments under different working conditions were conducted by the MTS Flat-Trac CT test bench, as shown in Figure 4. During the experiment, with the tire pressure at 210 kPa and speed at 60 km/h unchanged, the tire was subjected to axial load at 40%, 80%, and 120% of the reference load (

Tire cornering characteristic test.
Comparing the test results and simulation results of lateral force with the change of slip angle under different axial loads in Figure 5, it can be seen that the simulation results are in good agreement with the experimental results, which shows that the finite element simulation model established in this paper has high reliability in simulating tire cornering performance.

Comparison between simulation and test results of tire cornering characteristics under different loads: (a) 40%
Experimental verification of rolling resistance
To verify the established finite element model can be used for the analysis of rolling resistance characteristics, the tire rolling resistance experiments were carried out on the rolling resistance test bench with a drum diameter of 200 cm, as shown in Figure 6. During the test, the air pressure of the test tire was 210 kPa, and the applied axial load was the standard load. The rolling resistance under two different speeds of 60 and 80 km/h was tested respectively.
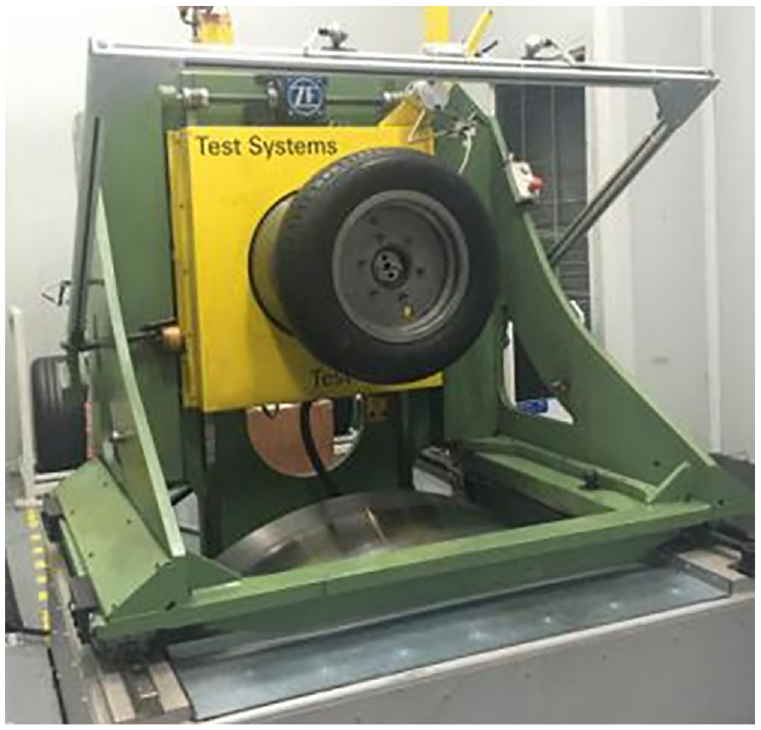
Rolling resistance test of tire.
The comparison of experimental and simulation analysis results of rolling resistance under different speed conditions is shown in Table 2. From the comparison results of the two working conditions, it can be seen that the error between the simulation value and the test value of rolling resistance is about 7%, and the error fluctuation between working conditions is small, which shows that the finite element model established in this paper has high reliability to simulate the rolling resistance of tire. Therefore, the cornering characteristics and rolling resistance characteristics of tires can be analyzed and studied based on the established simulation model.
Comparison between simulation and experimental results of tire rolling resistance.

Results and discussion
Working conditions
In order to effectively and comprehensively analyze the influence of tire cornering characteristics on rolling resistance, when using the established radial tire finite element model for simulation analysis, the cornering characteristics were divided into two cases: single action of slip angle and combined action of slip angle and camber angle. The tire inflation pressure was 210 kPa and the speed was set to 60 km/h. The specific simulation conditions are shown in Table 3.
Specific simulation condition setting of rolling resistance analysis.

Pure sideslip conditions
Figure 7 shows the three-dimensional spatial response curve between tire rolling resistance, sideslip angle and lateral force. It can be seen from the figure that in the three-dimensional spatial coordinate system with the sideslip angle as the X-axis, the lateral force as the Y-axis and the rolling resistance as the Z-axis, the change of rolling resistance is a spiral curve issued near the origin, low in the middle and high at both ends. Under different loads, multiple clusters of spiral curves of rolling resistance form a spatial sector structure.
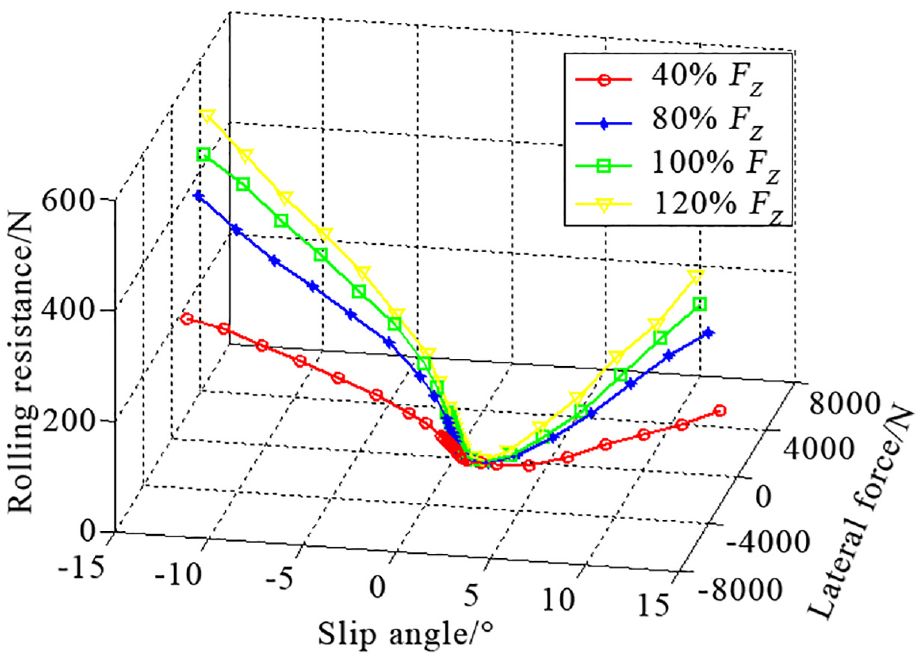
Three-dimensional spatial response curves of the rolling resistance under different loads.
Figure 8 displays the variation curve of rolling resistance and lateral force under different loads. It can be seen from the figure that with the gradual increase of radial load, the peak value of lateral force is larger, and the corresponding rolling resistance value is larger. In addition, it can be seen that the larger the opening at the top of the variation curve is, the greater the curvature at the bottom of the curve is. With the increase of the absolute value of the lateral force, the change gradient of the rolling resistance increases, and the inflection point of the peak value of the lateral force is the starting point of the linear growth of the rolling resistance.
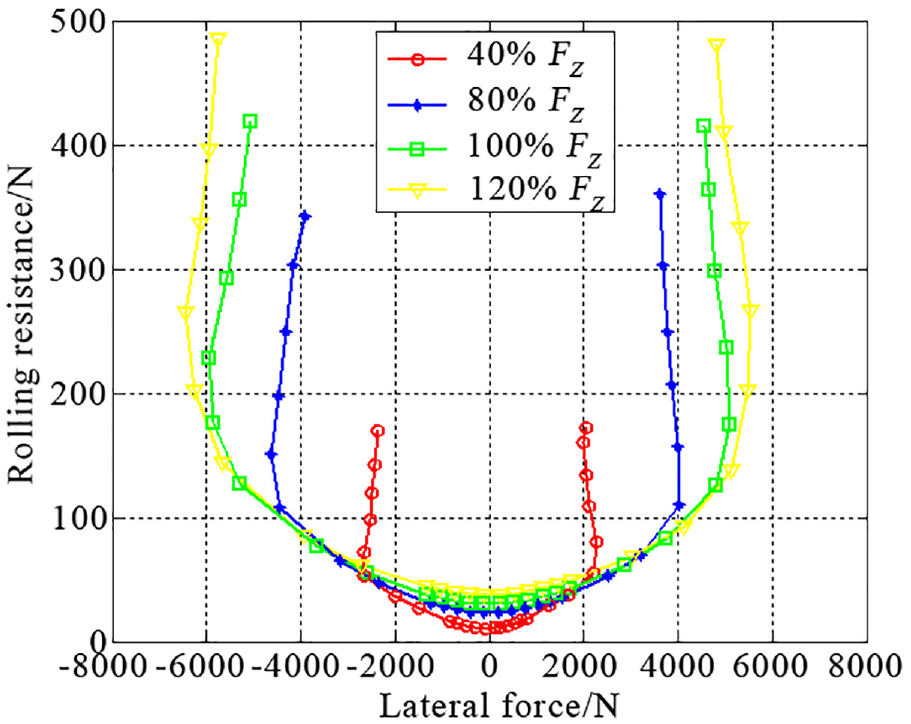
Response curve of rolling resistance with lateral force.
Figure 9 shows the response of rolling resistance to the change of sideslip angle under different loads. It can be seen from the figure that the rolling resistance roughly changes in a symmetrical “V” shape with the sideslip angle from negative value to positive value. With the increase of radial load, the opening angle of “V” curve decreases gradually, and the change gradient of angle also decreases gradually. Moreover, it can be seen from the local enlarged view in Figure 9 that when the tire rolls freely at a small positive sideslip angle, the minimum rolling resistance value can be obtained.
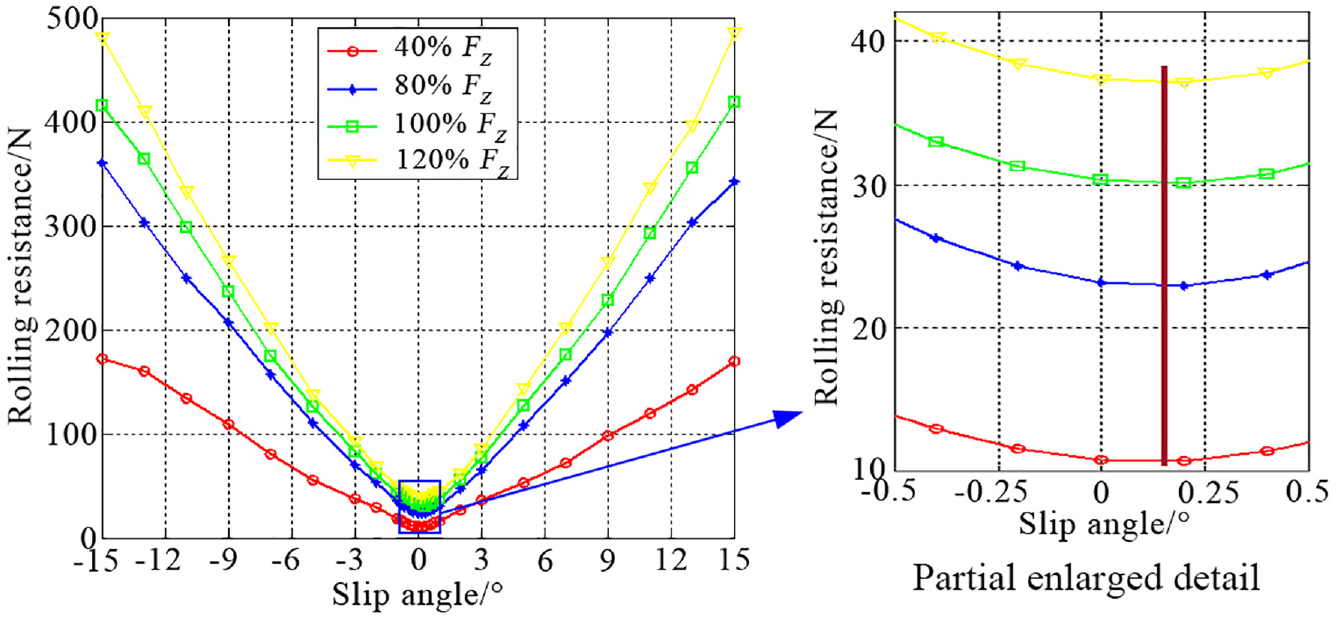
Response curve of rolling resistance with sideslip angle for pure sideslip condition.
In order to analyze the contribution of tire components to rolling resistance under different sideslip angles, three typical working conditions (

The contribution of rolling resistance of each component under typical working conditions.
Rolling resistance of different components under typical working conditions.

Combined conditions of sideslip and camber angle
The front wheels of the vehicle are generally set with positive camber angle and negative sideslip angle. Therefore, when setting the working conditions, only the combined conditions of positive camber angle and sideslip were analyzed. Figure 11 shows the relationship between tire rolling resistance, sideslip angle and lateral force under different roll angle conditions. It can be seen that the rolling resistance still presents a spiral spatial curve under the combined conditions, with low middle and high ends, and the difference between the curves is small.
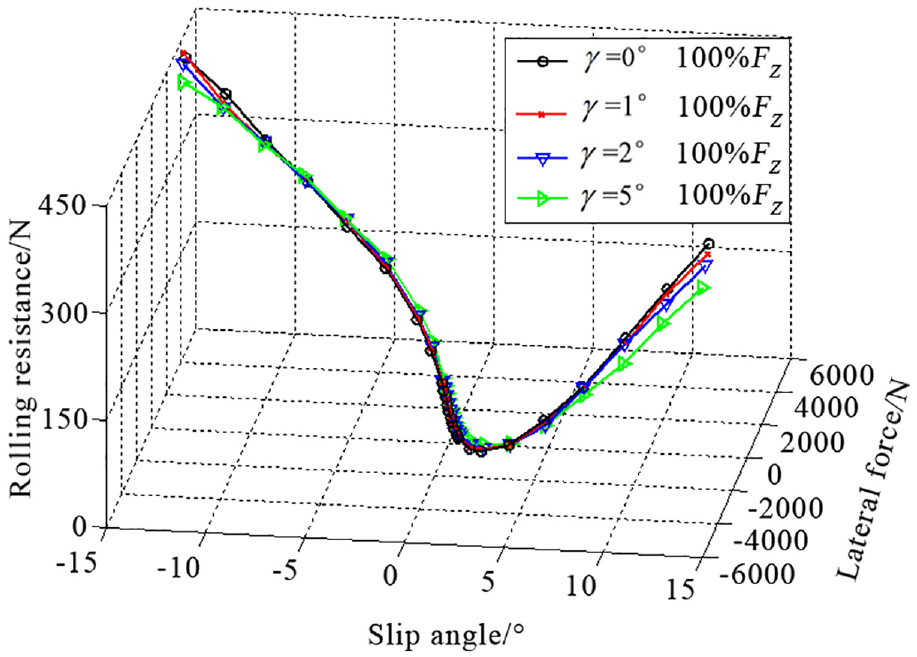
Three-dimensional spatial response curves of rolling resistance under combined working conditions.
Figure 12 shows the variation curves between lateral force and rolling resistance under combined conditions. It can be observed that the existence of camber angle has little effect on the rolling resistance value before the lateral force reaches the peak, but after the lateral force reaches the peak, the camber angle will affect the growth speed of rolling resistance.

Response curves of rolling resistance with lateral force under combined conditions.
Figure 13 shows the relationship between tire rolling resistance and sideslip angle at different camber angles. It can be seen from the figure that under the action of camber angle, the valley value of “V” shape of rolling resistance deflects, and the valley value decreases with the increase of camber angle.

Response curves of rolling resistance with sideslip angle under combined conditions.
Figure 14 shows the histogram of the contribution rate of rolling resistance of various parts of the tire. It can be seen that the change of sideslip angle transfers the energy dissipation between tire parts, the proportion of tread energy dissipation decreases, and the energy dissipation ratio of carcass and sidewall increases.

Variation of rolling resistance contribution of different tire components (
Conclusions
In order to analyze the influence of tire cornering characteristics on rolling resistance, a numerical simulation model of tire with complex tread pattern characteristics was established based on the FEM, and the accuracy of the simulation model was verified by cornering characteristics and rolling resistance experiments. On this basis, the rolling resistance characteristics under the pure sideslip conditions and the combined conditions were further analyzed. The conclusions obtained can be summarized as follows:
Under the pure sideslip condition, the rolling resistance presents a cluster of spiral curves with low middle and high ends issued near the origin in the three-dimensional spatial coordinate system composed of lateral deflection angle (X axis), lateral force (Y axis) and rolling resistance (Z axis). The curves under different loads show spiral fan structure. In addition, the change of spiral curve is not obvious under the action of camber angle.
Under the pure sideslip condition, the tire rolling resistance changes in a symmetrical “V” shape with the sideslip angle, and the rolling resistance valley is located on the small positive sideslip angle. With the increase of radial load, the included angle of “V” opening decreases gradually, and the gradient of included angle decreases gradually.
With the increase of the absolute value of the lateral force, the change gradient of the rolling resistance increases, and the inflection point of the peak value of the lateral force is the starting point of the linear growth of the rolling resistance; Before the lateral force reaches the peak inflection point, the contribution ratio of tread increases sharply, and the contribution ratio of other components decreases; When the lateral force reaches the peak inflection point, the rolling resistance increases linearly, but the contribution ratio of each component changes little.
Under the combined conditions of roll and sideslip, the sideslip angle will change the dissipated energy distribution of tire, which is mainly reflected in the decrease of tread dissipated energy and the increase of carcass and sidewall dissipated energy. Moreover, with the increase of roll angle, the positive yaw angle corresponding to the minimum rolling resistance decreases.
Footnotes
Handling Editor: Chenhui Liang
Declaration of conflicting interests
The author(s) declared no potential conflicts of interest with respect to the research, authorship, and/or publication of this article.
Funding
The author(s) disclosed receipt of the following financial support for the research, authorship, and/or publication of this article: This work was supported by the National Natural Science Foundation of China (No. 51804330) and the Fundamental Research Funds for the Central Universities (No. 18CX02154A).