
Abstract
In order to clarify the contradictory mechanism between tire rolling resistance and grip performance, ten (10) 205/55 R16 radial tires with different tread patterns were selected as the research objects. Using VIC-3D non-contact strain measurement system, the pattern deformation in the contact area under vertical load was tested and the relevant deformation parameters of the contact area were extracted. Correlation analysis was used to establish the relationship between the identified deformation parameters and tire performance indicators. Then the contradiction mechanism between tire rolling resistance and grip performance was identified. The mechanism is such that, in order to improve the grip performance of the tire, it is necessary to reduce the transverse tensile strain of the tread in the contact area and increase the longitudinal tensile strain of the tread, but with the increase of the longitudinal tensile strain, the rolling resistance of the tire will also increase, which leads to the contradiction between tire rolling resistance and grip performance. In order to better understand and solve this contradiction, a finite element model of 205/55R16 tire with complex pattern was established. The influence of the number and width of transverse grooves in outer shoulder area on tire rolling resistance and grip performance was analyzed by numerical simulation, where it was identified that, the longitudinal tensile deformation of the tread is the main cause of contradiction between the two performances. An optimized design of concave transverse groove with narrow groove in the middle and wide groove at both ends was proposed in the outer shoulder area to resolve the contradiction. Compared with the original scheme, the rolling resistance of the optimized scheme was reduced by 2.112 N, and the grip force saw an increase of 10.196 N, and thus delivering a cooperative improvement of tire rolling resistance and grip performance.
Introduction
Tire is one of the key factors affecting the safety and fuel consumption of the automobile. In recent years, the EU and some other countries have developed tire labeling laws which put forward higher and more comprehensive requirements for tire noise, rolling resistance, and grip performance. However, there exist some incompatibilities between these performances to a certain degree.1,2 Zhang Ping et al. 3 found that in some tread areas, an increase or decrease in the stiffness produces either improvement in tire rolling resistance and a decline in grip performance and vise versa. In addition, reducing the ratio of tire pattern groove in tread block can effectively reduce the contact deformation of tread pattern which produces a decrease in the rolling resistance. 4 However, the reduction of tire pattern groove and block ratio will also affect the friction between the tire and road, resulting in a decline of grip performance. 5 Thus, in designing tire tread pattern, a contradictory relationship between rolling resistance and grip performance was found in previous studies, but the contradictory mechanism is still unclear. The tire rolling resistance is caused by the hysteresis losses of rubber material, which is closely related to its deformation. 6 Studies have found that 80%–95% of tire rolling resistance is caused by rolling deformation, and the contribution of tire tread pattern to rolling resistance is about 50%.7,8 The tread rigidity distribution affects the contact pressure distribution and the contact deformation of tread pattern, so the tread rigidity can be controlled reasonably to reduce the rolling resistance.9–11 While the tire grip is generated by the friction between tread pattern and road, the deformation direction of tread pattern rubber significantly influences the friction coefficient.12–14 As a part contacting with the road, the deformation of tread pattern has an important effect on tire rolling resistance and grip performance. Studies have shown that reasonable pattern design could control the pattern deformation to improve the tire grip performance.15,16 However, existing studies are only limited to the effect of tread deformation on a single tire performance indicator without meeting the overall requirements of high-performance green tire design, and thus, fail to comprehensively consider the effect of tread deformation on multiple tire performance indicators.
In this paper, the deformation distribution of the tread in contact area was obtained through the tire contact deformation test, and the influences of the characteristic deformation parameters on tire rolling resistance and grip performance of the tire were analyzed by correlation analysis, and the contradictory mechanism between the two performances is revealed from the tread deformation in contact area. The influences of the number of transverse grooves and the width of the outer tire shoulder area on the rolling resistance and grip performance were explored, and a concave transverse groove design method was proposed in the outer tire shoulder to realize the synergistic improvement of the rolling resistance and grip performance.
Test objects and methods
Test tires
Figure 1 shows ten (10) tread patterns of 205/55 R16 test tires (asymmetric tread tires have outer and inner distinctions, and the left of each tire in the figure is the outer side).

205/55R16 sample tire.
The detailed information and performance data of the test tires are given in literature 17, and the specific results are shown in Table 1. The tire performance tests were carried out in strict accordance with the tire labelling regulations formulated by EU. The rolling resistance coefficient is the ratio of the rolling resistance coefficient measured by the indoor drum test bench and the measured value of the reference tire at a rolling speed of 80 km/h. The smaller the rolling resistance coefficient is, the better the rolling resistance performance will be. The braking distance is the distance from the emergency braking of the vehicle equipped with test tires at the initial braking speed of 100 km/h on the designated dry test road to the stop of the vehicle. The smaller the measured braking distance value is, the better the grip performance of the tire will be.
Brands and performance test data of test tire.

Tire contact deformation distribution test
Test process
The VIC-3D non-contact strain measurement system developed by CSI (Correlated Solutions, Inc.) was used to obtain the three-dimensional coordinates in contact area after loading, as well as the deformation distribution information of the tire tread (as shown in Figure 2).
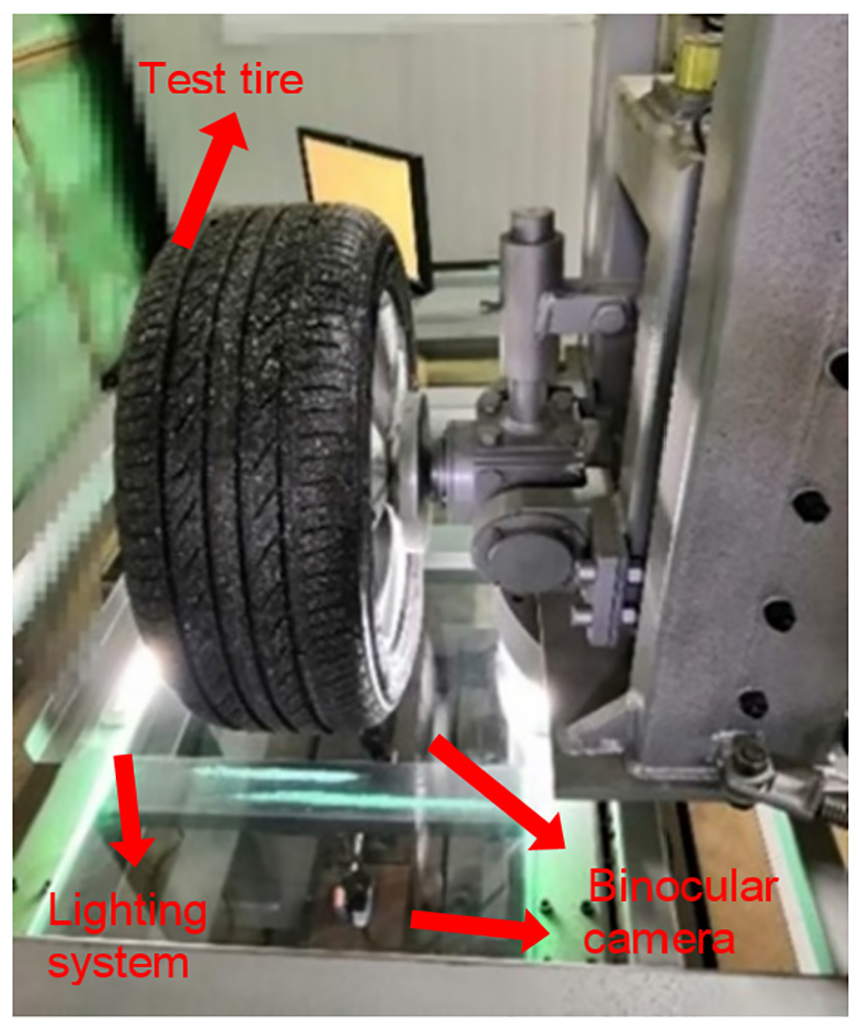
Deformation distribution test in contact area.
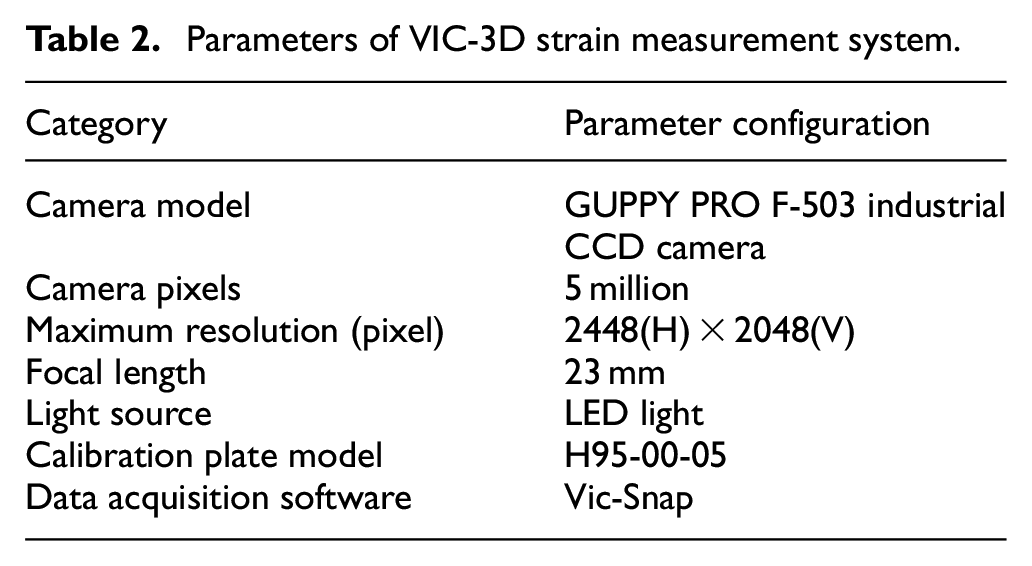
Table 2 lists the parameter configuration of VIC-3D measurement system. Figure 3 shows the schematic diagram of optical test based on digital image correlation method. The measurement and test process of the contact deformation distribution are as follows:
(1) Clean the tire surface and spray paint the tread to make speckles. The purpose of tread speckle processing is to keep the image subregion containing enough information of gray changes, ensuring that the image can be uniquely identified. 18
(2) The assembled test tires were inflated to the rated air pressure of 240 kPa, and the pressure was detected after standing for 24 h. If the pressure range remain 240 ± 5 kPa, the subsequent tests could be continued, otherwise the air pressure was supplemented.
(3) The test tire was installed on the tire stiffness test bench as shown in Figure 2, and the glass plate was selected as the contact base of the test tire.
(4) Positioning of two light sources and a camera located below the glass plate and symmetric arrangement to tire center plane, which height is about 300 mm. The light sources spacing is 800 mm while the binocular camera is located in the center plane symmetric arrangement to the glass plate and light sources, with a height of about 700 mm.
Parameters of VIC-3D strain measurement system.

Schematic diagram of optical test based on digital image correlation method
The spacing of the binocular camera is 600 mm, while the angle between the direction of camera lens to glass and vertical direction is 30°.
(5) The parameters of the binocular camera were calibrated with the H95-00-05 standard calibration plate.
(6) The up and down displacement of the tire was controlled by the lifting mechanism to realize the application of the rated load 4821 N, and the digital images of the tread in contact area before and after the loading were taken.
(7) The contact center of the tread was selected as the origin. Using the tire contact area as XY plane; the forward direction is the positive direction of X axis; the direction of wheel axis pointing from the outside to the inside of tire is the positive direction of Y axis; and the direction vertically pointing to the glass plate is the positive direction of Z axis. Image correlation analysis was carried out on the digital images captured by VIC-3D analysis software to obtain the deformation distribution information of the tread in contact area.
Division of contact area
Figure 4 shows a radial tire with typical tread characteristics. The tread pattern of the sample tire has four longitudinal grooves, which are named as groove 1~ 4 from the outside to the inside of the tire. According to the distribution of longitudinal grooves, the tire contact area can be divided into five zones from outside to inside: the outer tire shoulder area (I), the transition zone (II), center (III), transition zone (IV), and inner tire shoulder area (V). The method of partitioning the tread with longitudinal grooves can ensure that the structural characteristics of the pattern grooves in each area are consistent. This partition method fully considers the influence of the pattern types on tire contact characteristics.

Division of tread in contact area of 205/55R16.
Test results and analysis
Analysis of deformation characteristics in contact area
Figure 5 shows the main strain distribution in the XY plane of the contact area of the three test tires (No. 1, 6, and 7) with typical pattern characteristics. It can be seen that:
The outer tire shoulder area of No. 1 test tire adopts an interconnected transverse groove design, while the inner tire shoulder adopts a closed transverse groove design. Comparing the main strain distribution of the outer and inner shoulder of No. 1 test tire, it can be seen, with a closed groove, the main strain of the transverse tensile deformation area increases. This design can increase the transverse tensile deformation on the tire shoulder area to some extent.
The inner tire shoulder area of No. 6 test tire adopts an interconnected transverse groove design, while the outer tire shoulder area was designed with a combination of a transverse groove and a thin longitudinal groove. Comparing the main strain distribution on the outer and inner tire shoulder of No. 6 test tire, it is evident that, with a thin longitudinal groove outer tire shoulder design, the main strain is significantly increased in the transverse tensile deformation area.
The outer and inner tire shoulder areas of No. 7 test tire were designed with interconnected transverse grooves. Compared with other test tires, there were more tread pattern grooves, which resulted in a relatively small tread stiffness. Therefore, the main strain value in the XY plane of the contact area of test tire No. 7 is obviously greater than that of test tire No. 1 and No. 6.
Tread patterns of different structure lead to the differences of main strain in contact area ranging from numerical and local distribution, but the main strain distribution of the overall contact area obeys the following common laws: The principal strain of the shoulder area (mainly designed for transverse grooves) in XY plane is mainly longitudinal tensile deformation, and the inner tire shoulder close to the longitudinal groove is mainly transverse tensile deformation. Also, the main strain value of the tire shoulder was significantly higher than that of other contact areas. The main strain in the middle three rib pattern regions (generally regarded as longitudinal pattern blocks) in XY plane is mainly transverse tensile deformation, while the main strain near the oblique groove appears to be the normal tensile deformation along the groove, and the distribution of block deformation is larger near the grooves.

Distribution of principal strain in XY plane of test tires: (a) principal strain of No.1 tire, (b) direction of principal strain of No.1 tire, (c) principal strain of No.6 tire, (d) direction of principal strain of No.6 tire, (e) principal strain of No.7 tire, and (f) direction of principal strain of No.7 tire.
To illustrate, the No. 1 test tire is taken as an example to further reveal the common laws of deformation distribution of tread along the X, Y and Z directions in contact area. Based on the combined figures in Figure 6(a) to (c), it can be seen that:
In region I and V, the deformation along X direction (vertical) is mainly tensile, while that of the Y direction (horizontal) is mainly compressive. The deformation in region II, III, and IV along X direction is mainly manifested as compression, while the deformation along Y direction is tensile. The oblique grooved tread area in X and Y direction are mainly characterized by tensile deformation.
The radial deformation of the adjacent region radiates outward from the center likes a shape of wave, which in the central region is the largest, and gradually decreases when transferred from the central to the edge region.

Deformation distribution in contact area of No.1 test tire: (a) strain distribution in X direction, (b) strain distribution in Y direction, (c) deformation distribution in Z direction, and (d) equivalent strain distribution in XY plane.
Figure 6(d) shows the distribution of the equivalent strain (Von-Mises strain) in XY plane, reflecting the amount of contact tread deformation. As seen from Figure 6(d): equivalent strain of region I and V is larger, and the values of region II, III, and IV are small. In addition, the equivalent strain in center area is about zero because the central region is relatively flat, so it is always in contact with the glass plate during the loading, and thus constraining the deformation.
Influence of tread deformation in contact area on rolling resistance and grip performance
Characteristic deformation parameters in contact area
In order to quantitatively describe the characteristic deformation distribution in contact area, the detailed deformation parameters should be defined. In this paper, the following eight deformation parameters
When calculating
Analysis of contradictory mechanism between tire rolling resistance and grip performance
In this paper, Pearson correlation coefficient was used to measure the strength of the linear correlation between the two variables. We assumed that when 0.5<| r |≤0.8, the two variables were significantly correlated, when 0.8<| r |<1, the two variables are highly correlated. The 48 deformation parameters defined in Table 1 were taken as the target values for correlation analysis. Table 3 lists the deformation parameters related to rolling resistance coefficient and braking distance. Where “+” and “−” respectively indicate the significant positive correlation and negative correlation (0.5<| r |). “(+)” and “(−)” respectively refer to weak positive correlation and weak negative correlation (0.3<| r |<0.5). As can be seen from Table 3, the rolling resistance coefficient is mainly significantly correlated with the equivalent strain of the shoulder and transition areas in XY plane. The braking distance was significantly correlated with the tensile strain of the tire shoulder, transition and central tread in X and Y directions.
Deformation parameters highly related to the two performances.

In the outer tire shoulder area, the relationship between the tread deformation and tire rolling resistance, grip performance can be embodied that:
The braking distance shows a significant negative correlation with the vertical (X direction) tensile strain of the outer shoulder area, and a significantly positive relation with the horizontal (Y direction) tensile strain. In other words, a reduction of the transverse tensile strain in the outer tire shoulder and an increase of the longitudinal tensile strain can reduce the braking distance effectively.
Rolling resistance coefficient shows a significant positive correlation with the equivalent strain in XY plane of the outer shoulder area, and a weak positive relation with the tensile strain in X and Y direction. In other words, the equivalent strain in XY plane of the outer shoulder area is closely related to the magnitude of the tensile strain in X and Y directions. Reducing the equivalent strain in XY plane means that the strain in X and Y directions must be reduced at the same time.
In addition, transverse groove is the main distribution form in the outer tire shoulder, and the deformation in XY plane is mainly reflected in the large longitudinal tensile deformation near the transverse groove. Therefore, the equivalent strain of the outer shoulder tread in XY plane can be reduced by reducing the longitudinal tensile deformation of the outer shoulder tread, which will produce a reduction in tire rolling resistance.
Based on the above analysis, it can be seen, the longitudinal tensile strain in the outer tire shoulder leads to the contradictory relationship between the rolling resistance and grip performance to a certain extent. That is, the outer tire shoulder area is the main contradictory region of the two performances. According to the correlation analysis results in Table 3, the longitudinal tensile strain in the inner tire shoulder and inner transition also presents a contradiction between rolling resistance and grip performance, as well as the inner tire shoulder and inner transition area.
Synergistic improvement method of tire rolling resistance and grip performance
Establishment and verification of tire simulation model
The 205/55 R16 radial tire with asymmetric tread pattern is selected as the research object. The establishment process of the finite element model with complex tread pattern is shown in Figure 7. First, the tread profile was imported into the Hypermesh for two-dimensional mesh division, and the tread profile mesh was rotated at a single pitch angle (6°) to obtain the corresponding single-pitch tread mesh model. Secondly, the single-pitch pattern model was divided, and single-pitch tire carcass and pattern model were fitted by “*Tie” command in Abaqus to obtain the single-pitch tire mesh model. After that, the single pitch mesh model was rotated to obtain the whole tire mesh model. The tire rubber and reinforcement material properties employed in this simulation are consistent with reference 20 .

The process of establishing the finite element model of complex tread tire.
In order to verify the reliability of the FE model, the MTM-2 tire comprehensive strength testing machine was used to perform the static contact test, which was loaded to a rated load of 4821 N and an inflation pressure of 240 kPa.
During the static contact test, the tire impressions under the static loading were obtained by ink printing to extract the geometry parameters in contact area. Figure 8 shows the comparison of the contact impressions obtained by static test and FE analysis, and Table 4 shows that the geometry parameters of contact length and width errors obtained by FE model are less than 2%, indicating that the FE model built in this paper can well describe the tire contact characteristics.
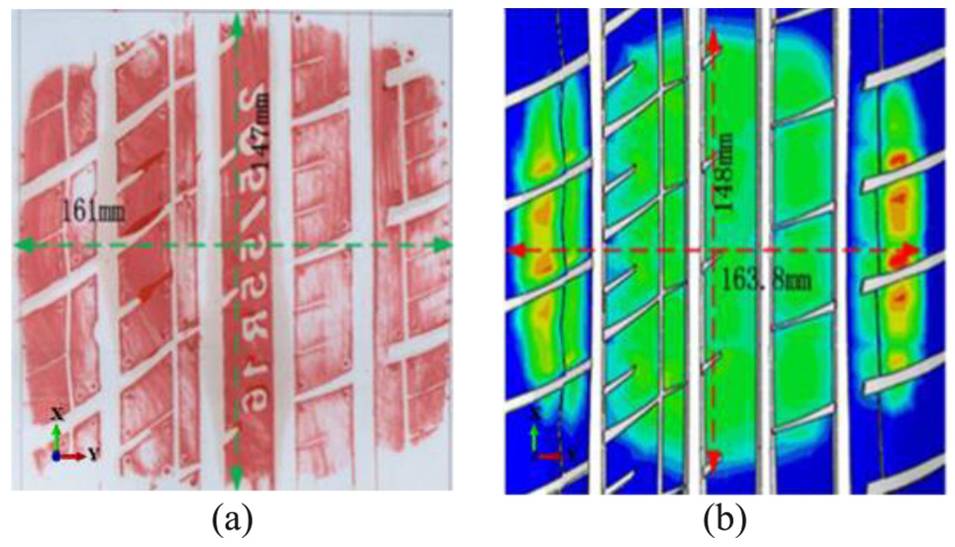
Tire contact impression comparisons: (a) test result and (b) simulation result.
Comparison of geometric parameters in contact area.

Design of tread pattern for synergistic improvement of tire rolling resistance and grip performance
According to the correlation analysis above, the longitudinal tensile deformation of the tread in contact area is a contradictory factor affecting the tire rolling resistance and grip performance, and the longitudinal tensile deformation in the outer tire shoulder is relatively large. Through the tread pattern analysis of test tires, it was found that transverse grooves are mostly used in the outer shoulder area, and the design differences are mainly reflected in the number of grooves and the width of the transverse grooves. In order to explore the influence of the number of transverse grooves in the outer tire shoulder and the transverse grooves width on the tire rolling resistance and grip performance, the original design was modified by removing the longitudinal thin grooves in the outer tire shoulder, and replacing the closed small-angle oblique groove into a horizontal through groove of equal width (5.3 mm) and equal depth slot, recording the modified scheme as a reference scheme (Figure 9 shows a tread patterns comparison of original and reference schemes). In order to simulate the process of free tire rolling, a finite element model is used to analyze the behavior of the tire-road contact under ideal conditions, and the rolling resistance of the tire is calculated by extracting stress-strain information from the units.20,21 The modified attenuation index friction model is used to describe the friction state of the tires and road surface. The tire slip rate is controlled by varying the angular velocity of tires, and the maximum friction corresponding to the optimal slip rate is used to evaluate the grip performance. 22 In this paper, the numerical calculation methods of tire rolling resistance and grip can be referred to literature 23 and 22 respectively.

Tread pattern comparison between the original scheme and the reference scheme: (a) original scheme and (b) reference scheme.
Influence of the number of transverse grooves in outer tire shoulder on rolling resistance and grip performance
On the condition that the ratio of the tire pattern groove and block in the outer tire shoulder remains constant, three sets of 30, 60 (reference scheme), and 120 transverse grooves of the outer tire shoulder were designed for analysis. The comparison of simulation results of rolling resistance corresponding to different schemes is shown in Figure 10, where the black curve represents the rolling resistance value and the red curve represents the grip value. The results show that, with an increase of the transverse grooves number in the outer tire shoulder, the grip performance has been improved, but the rolling resistance has decreased significantly. Specifically, when the number of transverse grooves in the outer tire shoulder doubled, the maximum grip force was increased by 18.098 N relative to the reference scheme, while the rolling resistance was increased by 4.101 N.

Comparison of simulation results for different schemes.
In order to further explore the contradictory mechanism between the two performances caused by the number of transverse grooves, three schemes with different number of grooves were designed, and the corresponding longitudinal strain distribution of the outer tire shoulder is shown in Figure 11. The results show that, with more transverse grooves in the outer tire shoulder, the longitudinal tensile strain value and its deformation area increased significantly, which contributes to the improvement of the grip performance but also increases the rolling resistance. Thus, when designing the tread patterns, the number of tread grooves needs to be reasonable to keep the balance of tire performances comprehensively.

Comparison of longitudinal strain distribution in contact area “I.”
Effects of the transverse groove width in the outer tire shoulder on rolling resistance and grip performance
In order to analysis the influence of transverse groove width of outer tire shoulder on the two performances, five design schemes of transverse groove widths of 1.3, 3.3, and 5.3 mm (reference scheme), 7.3 and 9.3 mm were designed. The comparison of FE analysis results is shown in Figure 12, and the results reveal that:
With an increase of the transverse groove width, the tire rolling resistance also increases. Specifically, when the transverse groove width increases from 1.3 to 3.3 mm, the increase of rolling resistance is relatively significant. Within the range of 3.3–7.3 mm, the rolling resistance increases slightly with the increase of groove width. In addition, when the groove width increases from 7.3 mm to 9.3mm, the rolling resistance of tire decreases slightly.
For the grip performance, when the transverse groove width is within the range of 3.3–7.3 mm, the grip force increases slightly with the groove width increases. However, in the range of 1.3–3.3 and 7.3–9.3 mm, with an increase of groove width, the grip force showed a trend of significant decline.
When the groove width increases from 7.3 to 9.3 mm, the tire rolling resistance and grip force both show a decreasing trend. Compared with the reference scheme, the 9.3 mm groove width in the outer tire shoulder increases the groove volume by 75.5%, which reduces the quality of the tread in outer shoulder and contributes to the improvement of the rolling resistance to a certain degree. However, the substantial increase in groove volume leads to a significant reduction in contact area, resulting in a decrease in tire grip force.
When the groove width reduces from 3.3 to 1.3 mm, both of the tire rolling resistance and grip performance show the significantly improvement. Further analysis shows that, when the groove width is reduced to 1.3 mm, the adjacent pattern blocks changed from a non-contact state when designed with a 3.3 mm groove width to an extruded contacting state after static loading. Therefore, the synergistic improvement of the two performances is related to the change of the contact state in adjacent tread blocks when the groove width drops to 1.3 mm.

Comparison of simulation results for different schemes.
In order to further clarify the synergistic improvement mechanism of the rolling resistance and grip performance when the groove width is reduced to 1.3 mm, Figure 13 compares the longitudinal strain distribution in the outer shoulder contact area corresponding to different groove width design schemes. The results show that in the range of 3.3–5.3 mm, with an increase of the transverse groove width, the longitudinal tensile strain of the outer tire shoulder increases slightly. When the groove width decreases from 3.3 to 1.3 mm, the longitudinal tensile strain value of the tread and the area showing tensile deformation in the longitudinal direction are significantly reduced, which is beneficial to reduce the tire rolling resistance. However, with the groove width dropped to 1.3 mm, the grip performance is not decreased but increased significantly due to the reduction of the longitudinal tensile strain.

Comparison of longitudinal strain distribution in contact area “I.”
In order to explore the mechanism that the tire grip performance increases rather than decreases when the groove width is reduced to 1.3 mm, Figure 14 shows the comparison between the static and dynamic contact pressure distribution for the 1.3 and 5.3 mm groove widths to further analyze the pressure distribution characteristics in contact area.

Comparison of static and dynamic contact pressure distribution: (a) 1.3 mm scheme of static contact pressure distribution, (b) 5.3 mm scheme of static contact pressure distribution, (c) 1.3 mm schedule of dynamic contact pressure distribution, and (d) 5.3 mm scheme of dynamic contact pressure distribution.
Comparing the static contact pressure distribution, it can be seen that, when the transverse groove width of the outer tire shoulder is reduced to 1.3 mm, with a decrease of the groove width, the tire contact area increases, and the contact pressure becomes more uniform, which can effectively improve the grip force to some extent. 24 Comparing the dynamic contact pressure distribution of the above two schemes, for the scheme where the lateral groove width of the outer shoulder is 5.3 mm, the pattern block at the groove edge is “curled” at the rear end of the contact area during braking, that is, the pattern block at the groove edge is subjected to longitudinal shear force to leave the road (shown as the contact pressure is 0), and the effective contact area of the tire decreases during braking. While for the design with a width of 1.3 mm in the transverse groove, the supporting effect of adjacent blocks during braking improves the tread rigidity, which suppress the curling phenomenon effectively during braking and realize the improvement of grip performance.
Concave transverse groove design
From the above analysis, it can be seen that the transverse groove design with a width of 1.3 mm in the outer shoulder can synergistically improve the tire rolling resistance and grip performance. However, considering that the groove width is too narrow, the tire anti-skid performance will be significantly reduced and the wet safety will be compromised. Therefore, a “concave” transverse groove design is proposed in this paper to achieve a synergistic improvement of tire rolling resistance and grip performance on the premise of ensuring the constant volume of the groove. The concave transverse groove design shown in Figure 15, the main features of which are narrow in the middle but wide in both ends. The middle narrow groove design realizes the adjacent pattern blocks to form mutual support after loading, which improves tread rigidity and thus reduces the rolling resistance, and both ends of the width of the groove design allows the tire more longitudinal tensile strain to improve grip force during braking.

Schematic diagram of concave transverse groove.
The concave transverse groove shown in Figure 15 was used to change the shape of the transverse groove in the outer shoulder area in the reference scheme. The design parameters were determined as follows:
Parameter “a” is the length from the center of the middle narrow groove section to the inner edge of the outer tire shoulder, and parameter “b” is the width of the narrow groove section. Figure 16 shows the longitudinal strain distribution curve of the node at the edge of the lateral groove of the outer shoulder corresponding to the X = 0 plane in contact area (the red frame shown in Figure 16(a)). The maximum longitudinal tensile strain is found at Y1 = −74.33 mm, and the longitudinal tensile strain of the tread begins to decrease rapidly at Y2 = −78.14 mm. Therefore, the value of parameter “a” is 21.41 mm from the node at Y1 to the inner edge of the outer tire shoulder, and the value of parameter “b” is b = 2*(Y1–Y2) = 7.63 mm.
The value of the narrow groove width “c” refers to the design scheme in section above: c = 1.3 mm.
In order to avoid stress concentration, 135° chamfering transition is adopted between narrow groove part and wide groove part.
To ensure the groove volume is constant, d = 7.12 mm can be determined by area calculation.

Longitudinal strain distribution of joints at the edge of transverse groove in area “I”: (a) the transverse groove of the outer shoulder corresponding to the X = 0 plane and (b) reference scheme.
The simulation results of tire rolling resistance and grip force of the optimization and original scheme are shown in Table 5. The result shows that, the tire rolling resistance was reduced by 2.112 N compared with the original one after applying a concave transverse groove profile to the outer tire shoulder, and the tire grip force is improved by 10.196 N compared with the original one, achieving a synergistic improvement of tire rolling resistance and grip performance.
Comparison of simulation results for different schemes.

Conclusion
In this paper, ten 205/55 R16 radial tires with different tread patterns were selected as the research objects, and the static identified deformation characteristics of the test tires were obtained through the contact deformation distribution test. The characteristics of the tread deformation distribution of XY plane are as follows: the transverse pattern block with transverse groove is mainly subjected to longitudinal tensile deformation and transverse compression deformation. The longitudinal pattern blocks divided into the longitudinal grooves are mainly transverse tensile deformation and longitudinal compression deformation. The tread area near the oblique groove mainly shows normal tensile deformation along the groove. The deformation distribution of the pattern blocks shows a large deformation in the tread area near the groove and a smaller one near the center of the pattern blocks. The radial deformation shows a largest radial deformation in the central area and a gradual decrease when transitioning from the central area to the edge.
The relationships between the deformation parameters, rolling resistance coefficient and braking distance were established by means of correlation analysis, and the contradictory mechanism between the two performances was revealed. In order to improve the grip force, there is the need to reduce transverse tensile strain and increase longitudinal tensile strain of the tread. However, with the longitudinal tensile strain of the tread increases, the tire rolling resistance also increases, which is the contradiction between the two performances. The longitudinal tensile deformation of the outer and inner tire shoulder, inner tire transition is the main cause of the contradiction between tire rolling resistance and grip performance.
The finite element model with complex patterns was established, and the validity of the FE model was verified by static contact test. The effect of the number of transverse grooves and the transverse groove width in the outer tire shoulder on the rolling resistance and grip performance was analyzed. The results show that, with an increase in the number of transverse grooves, the grip performance of the tire is improved, while rolling resistance decreases significantly. When the transverse groove width of the outer tire shoulder is reduced to 1.3 mm, the adjacent pattern blocks form mutual support after loading, resulting in an increase in tread rigidity, which reduces the average contact pressure effectively and contribute to the synergistic improvement significantly in tire rolling resistance and grip performance.
Footnotes
Acknowledgements
We owe a great deal of appreciation to Bentil M.K. Asafo-Duho, (PhD. Candidate at the School of Automotive and Traffic Engineering, Jiangsu University) for his efforts in improving the language. We are equally grateful to Ruituo Tech’s Engineer, Jiangtao Li for his enormous assistance during the deformation distribution test.
Handling Editor: James Baldwin
Declaration of conflicting interests
The author(s) declared no potential conflicts of interest with respect to the research, authorship, and/or publication of this article.
Funding
The author(s) disclosed receipt of the following financial support for the research, authorship, and/or publication of this article: Financial assistance for this research was provided by National Natural Science Foundation of China (51675240).